

 PDF
PDF Citation
 Print
Print


INTRODUCTION
Body dissatisfaction is influenced by biological, psychological, and sociocultural factors.1 Obesity has been found to be strongly related to body dissatisfaction in previous studies.23456 Even in childhood and adolescence, obese persons suffer psychological disturbances based on unfair prejudice and discrimination.78 Negative parental opinions about body weight and teasing by friends are linked to body dissatisfaction in individuals from a young age.491011 The result is low self-esteem for obese people,25 and the decreased self-esteem links the relationship between body dissatisfaction and depressed mood.12 Therefore, obese children may experience stress due to their entire appearance, including their face and body shape as well as weight. However, few studies have evaluated whether overweight or even children or adolescents of healthy weight are stressed about their appearance using a large population-based study with representative samples.
In Korea, interest in appearance is unusually high.13 The rate of cosmetic surgery in Korea has been reported to be the highest in the world,14 and appearance-related distress is the second most common cause of distress in Korean adolescents.15 Although the rate of obesity is very low (3.8%) in Korea, the desire to lose weight is greater in Korea than in any other countries, particularly for young women.16 Thus, we hypothesized that Korean adolescents, especially obese girls, might be very distressed about their appearance.
The purpose of this study was to evaluate the relation between obesity and distress about appearance in adolescents using a large population-based sample that was designed to be representative of Korean adolescents. Furthermore, we divided the participants into subgroups to reveal different associations according to age and sex.
METHODS
Study population and data collection
This cross-sectional study uses the data from the Korea Youth Risk Behavior Web-based Survey (KYRBWS). This study based on data from one nation employs statistical methods based on designed sampling and adjusted weighted value. Data from the KYRBWS, conducted from 2009 through 2012, were analyzed. The data were collected by the Korea Centers for Disease Control and Prevention (KCDC). Korean adolescents from 7th through 12th grade completed the self-administered questionnaire voluntarily and anonymously. The validity and reliability of the KYRBWS have been documented in other studies.1718 The surveys yielded data from Korean adolescents using stratified, two-stage (schools and classes) clustered sampling based on Ministry of Education data. Sampling was weighted by statisticians, who performed post-stratification and considered the non-response rates and extreme values.
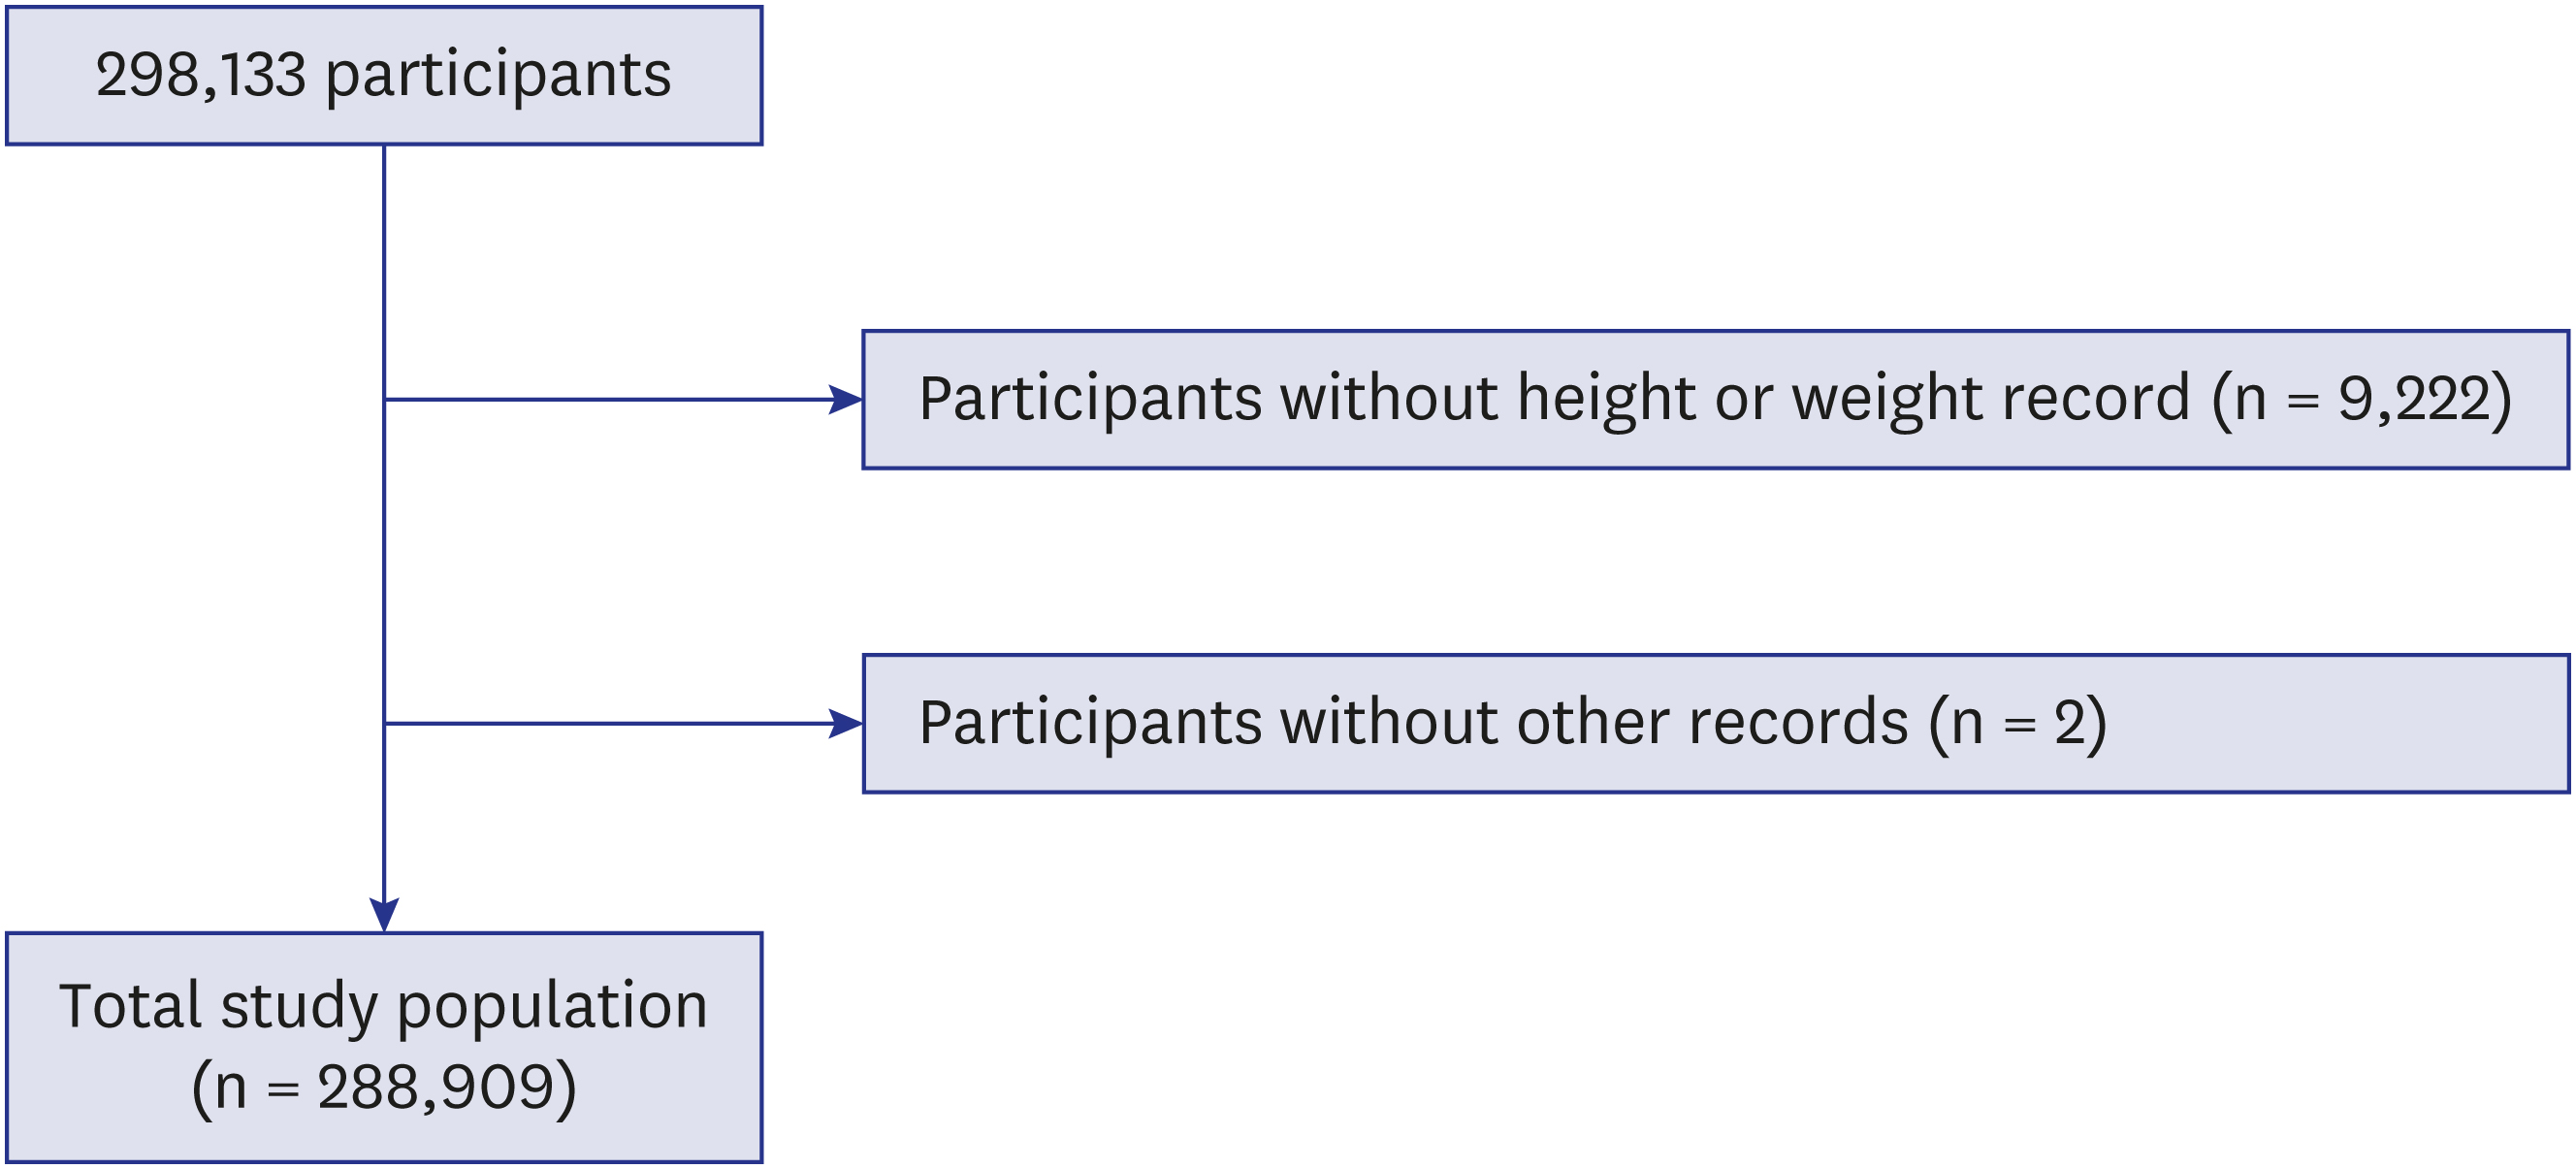
Of the total of 298,133 participants, we excluded the following students from participating in this study: adolescents who did not record their height or weight (9,222 participants) and adolescents who did not indicate the education level of their mother and their drinking alcohol history (2 participants). Finally, 288,909 participants (149,226 males and 139,683 females) from 12 to 18 years old were included in this study (Fig. 1).
Survey
The understanding, reliability and validity of each question were investigated by the KCDC in qualifying the surveys.19 The region of residence was divided into 3 groups by administrative district: large city, small city, and rural area. Obesity was categorized into 4 groups according to KCDC guidelines for body mass index (BMI, kg/m2) for children and teens20: obese, ≥ 95th percentile; overweight, 85th–95th percentile; healthy weight, 5th–85th percentile; and underweight, < 5th percentile. Self-reported economic status was measured in 5 levels from the highest to lowest. Parental education level was divided into 4 groups: parents who had graduated from college or higher; parents who had graduated from high school; parents who had graduated middle school or lower; and those with unknown education or no parents. Participants who did not know their parents' educational level or who had no parents were not excluded, as this could have increased the number of missing values for participants with relatively lower economic status. The participants were asked to indicate their academic performance in their grade at school during the last 12 months. Performance at school was divided into 5 levels: A (highest), B (middle, high), C (middle), D (middle, low), and E (lowest). The participants were asked how many days they had smoked cigarettes in the past month, and this information was divided into 3 groups: 0 days per month, 1–19 days per month, and ≥ 20 days per month. The participants were asked how many days they had consumed alcohol based on 3 possibilities: 0 days per month, 1–5 days per month, and 6–30 days per month.
The participants were asked to indicate their most serious source of stress among conflict with parents, conflict with teachers, peer relationship, academic issue, health problem, family economic situation and appearance (height, body shape, or looks). The participants who chose appearance were classified as being distressed about their appearance.
Statistical analysis
Differences in general characteristics according to obesity status were calculated using linear regression analysis with complex sampling and a χ2 test with Rao-Scott correction.
Odd ratios (ORs) for obesity associated with distress about appearance were calculated using simple and multiple logistic regression analysis with complex sampling.
For the subgroup analysis according to the age and sex (boy vs. girl; younger [12–14 years of age] vs. older [15–18 years of age]), the adjusted odds ratios (AORs) for obesity in relation to distress about appearance were calculated using multiple logistic regression analysis with complex sampling.
Two-tailed analyses were conducted, and P values lower than 0.05 were considered to indicate significance. A 95% confidence interval (CI) was calculated. After the weighted values recommended by the KYRBWS were applied, all results were presented as weighted values. The results were analyzed statistically using SPSS ver. 21.0 (IBM, Armonk, NY, USA).
Ethics statement
The Institutional Review Board (IRB) of the Korea Centers for Disease Control and Prevention approved this study (2014-06EXP-02-P-A). Written informed consent was obtained from each participant prior to the survey. Because this web-based survey was performed at a school with a large number of participants, the study was exempt from obtaining informed consent from the students' parents. This consent procedure was approved by the IRB of the KCDC.
RESULTS
Of the 288,909 participants, 31,322 (10.8%) chose appearance as the most serious cause of their stress. The rate of distress about appearance was the lowest in the underweight group (8.8%), and this rate increased along with weight in the direction of obesity (healthy weight, 10.2%; overweight, 15.3%; and obese, 19.2%). Mean age and the variables of sex, region of residence, economic level, parental educational level, smoking, and alcohol consumption differed according to obesity status (each P < 0.001) (Table 1).
Table 1
General characteristics of the participants according to their performance at school
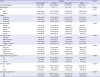
Data are shown as mean ± standard deviation or number (%).
aLinear regression analysis with complex sampling; significance was set to P < 0.05; bχ2 test with Rao-Scott correction; significance was set to P < 0.05.
![]()
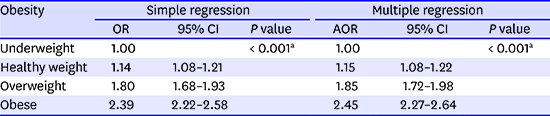
In multiple logistic regression analysis, AOR was higher for participants with obesity (AOR for healthy weight = 1.15; AOR for overweight = 1.85; AOR for obese = 2.45; reference = underweight, P < 0.001). The results of simple logistic regression analysis were similar to the results of multiple logistic regression analysis (Table 2).
Table 2
Odd ratios of obesity for distress by appearance determined using simple and multiple logistic regression analysis with complex sampling

OR = odd ratio, AOR = adjusted odd ratio, CI = confidence interval.
aSignificance was set to P < 0.05.
![]()
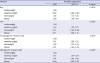
In the subgroup analysis of boys, those with a healthy weight showed AORs under 1 (AOR = 0.92 [95% CI, 0.85–0.99]), while those who were overweight and obese exhibited AORs greater than 1 (AOR for overweight = 1.26; AOR for obese = 1.66, P < 0.001). In the subgroup analysis of girls, AORs increased as body weight approached obesity (AOR for healthy weight = 1.44; AOR for overweight = 2.71; AOR for obese = 3.71, P < 0.001) (Table 3).
Table 3
Subgroup analyses of adjusted odd ratios of obesity for distress by appearance using multiple logistic regression analysis with complex sampling (boy vs. girl; young age vs. old age)
![]()
The results for the younger participants (12–14 years old) and older participants (15–18 years old) were comparable. In the younger age group, the AOR for healthy weight was 1.12, that for overweight was 1.92, and that for obese was 2.72 (P < 0.001). In the older age group, the AOR for healthy weight was 1.15, that for overweight was 1.78, and that for obese was 2.28 (P < 0.001) (Table 3).
DISCUSSION
Compared to the results for underweight individuals, the AORs for body dissatisfaction were higher in the healthy weight, overweight, and obese groups with a dose-response relationship. In previous studies, higher BMI was related to body dissatisfaction2122 and to psychological distress.23 As stated above, obese people are treated with unjust prejudice and discrimination,78 which could be a chronic stressor and could adversely affect their face and body image. As obesity is becoming an increasing problem in westernized countries, social pressure for thinness also increases.24 Therefore, discrepancies between one's desired and actual weight intensify the distress associated with body image. Hence, the obese participants in this study might be stressed about their appearance.
The subgroup analyses revealed that the AORs for girls were higher than those for boys. In other words, girls may be more stressed about their appearance based on their obesity status. This result can be explained by differences in the social expectation of thinness according to sex.7 Moreover, girls and young women are particularly vulnerable to weight balance issues.25 The results from previous large population-based studies that evaluated the relation between BMI and depression232627 and the relation between BMI and body dissatisfaction6 are in accordance with our findings. Istvan et al.26 reported that BMI is related to depression in women but not in men, and Carpenter et al.27 found that underweight men and obese women experienced depression. Notably, the AORs for adolescents of healthy weight were lower and higher than those for the underweight boys and girls, respectively. Thus, a relationship between underweight and distress about appearance was found for boys, whereas a relationship between healthy weight and distress about appearance was obtained for girls. Girls being underweight might be viewed as positive by the media, peers, and family.28 Additionally, underweight women might be less likely to be marginalized in their social environment, whereas underweight men are denounced.293031
The results of the subgroup analysis for the younger and older groups were comparable. Shin et al.5 reported similar results for younger participants. Body dissatisfaction was found to be strongly associated with childhood obesity in 413 elementary Korean children. Because obesity-related stigma is persistent from an early part of a child's life,7 the younger adolescents in this study might have exhibited high AORs for the relation between obesity and distress about appearance. Hence, even younger adolescents could have been highly stressed about their appearance, depending on whether they were obese.
This study has various strengths. The study was the first to compare the association between obesity and distress about appearance with a large population-based survey of Korean adolescents (n = 288,909). Sampling was weighted by statisticians to reflect the mother population. We adjusted for age, sex, region of residence, economic level, parental education level, alcohol consumption, and smoking habits, which could act as confounding factors.3132 The measure of self-reported weight and height was validated in previous studies,1718 and obesity status was identified based on the commonly accepted definition of underweight, overweight, and obese.20 Despite these strengths, this study has several limitations. First, the study used self-reported data pertaining to distress about appearance. This question could be interpreted very differently and not confined to obesity. Furthermore, this was not measured with any objective scale. However, obesity status might be important to appearance, and this item was limited in objectivity, even if it was measured in defined levels. Second, the study was subject to the same limitations that affect all cross-sectional studies, including possible reverse causality; therefore, our calculated ORs should be interpreted with caution. Third, the relationship between body dissatisfaction and self-esteem in adolescents varies across race and ethnicity.1231 This result could apply narrowly to similar race-ethnic groups.
In conclusion, obesity is related to distress about appearance. This association is stronger in girls than in boys, and healthy girls show higher ORs than the underweight group. This relation is comparable between the younger and older groups of adolescents.
 XML Download