

 PDF
PDF Citation
 Print
Print


INTRODUCTION
A medical laboratory test is defined as a test done on a clinical specimen which is meant to provide information about the diagnosis, treatment, and prevention of disease to healthcare professionals.1 Test results are widely used as objective evidence when making clinical decisions or explaining a patient's health status. Laboratory tests are also known to affect medical decisions in about 70% of cases.2
To achieve reliable test results, many laboratories are taking a more focused and stringent approach to standardization. Without standardization, it is impossible to guarantee the reliability or accuracy of test results, which increases the false positive (FP) and false negative (FN) rates. FP results lead to an unnecessary increase in spending on subsequent tests and treatments, and FN results deprive patients of the opportunity to be treated in a timely manner. The World Health Organization (WHO) places importance on ‘accurate and relevant diagnostic testing’ to achieve the medical objectives of the millennium development goals suggested by the United Nations (UN).3
In order to improve the quality of clinical laboratory tests, it is necessary to standardize not only the products used for the tests, but also the standardization of the clinical laboratory practice. Internationally, various means have been developed and introduced to standardize and assure clinical laboratory quality in terms of clinical laboratory practices. The Technical Committee (TC) 212 of the International Standard Organization (ISO) enacted ISO 15189 (medical laboratories: requirements for quality and competence) in 2003. It has already been implemented in Europe and Australia and has recently come into play in Asia.4 The Centers for Disease Control and Prevention (CDC) in America has been running the lipid standardization program to improve the accuracy of clinical testing in laboratories.5
In Korea, no national regulatory standards have been provided for clinical laboratories. The standardization of laboratory practice depends on a private sector entity, the Korean Laboratory Accreditation Program (KLAP), and the Korean External Quality Assessment Scheme (KEQAS).67 In a previous study, it turned out that the result of the KEQAS had significant differences depending on the laboratories with or without KLAP.8 However, it is unknown yet the effects of test standardization caused by the KLAP and KEQAS, so this study is intended to quantify and compare the effect of the two laboratory standardization programs on the prevalence of diabetes mellitus (DM) and impaired fasting glucose (IFG). Although the KLAP and KEQAS do not directly assess the ‘standardization’ level, they aim to pursue the standardization of laboratories through quality assurance. Therefore, the degree of participation in these programs was used as the index of standardization level of each laboratory. To determine disease prevalence, we used data from the Korea National Health and Nutrition Examination Survey (KNHANES), which is a population-based cross-sectional survey designed to assess the health-related behavior, health conditions, and nutritional status of Koreans.9
METHODS
Study subjects and protocol
This study used data obtained from the KEQAS and/or KLAP in 2013. The study protocol involved three steps (Fig. 1): As a first step, all participants in the KLAP and/or KEQAS were categorized into three laboratory subgroups of standardization levels as follows; highly-standardized laboratory (HSL) with both KLAP and KEQAS accreditation; basically-standardized laboratory (BSL) with only KEQAS accreditation; and non-standardized laboratory (NSL) without any accreditation from either program. Next, new diagnostic cutoff values for DM and IFG, with which FP and FN values we obtained, were calculated for each laboratory subgroup using the variance index score (VIS) data on glucose level in the KEQAS. The VIS developed by United Kingdom National External Quality Assessment Service (UK NEQAS) in 1973 was considered as important because it removed the variability of standard deviation and it allowed comparison of performance between samples of different concentration and comparison between analytes by standardizing the error calculation.10 Thus, the VIS gives a simple but reliable indication of laboratory performance that has proved robust over many years of use.11 Lastly, we estimated the prevalence of DM and IFG using the new cutoff values, and compared their differences among laboratory subgroups. To estimate disease prevalence in Korea, we used data from the KNHANES (2013).
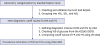 | Fig. 1Steps of the study protocol: 1) All participants in the KLAP and/or KEQAS were categorized into three laboratory subgroups based on their standardization level, such as HSL, BSL, and NSL; 2) New diagnostic cutoff values for DM and IFG which could provide FP and FN were calculated; and 3) The prevalence of DM and IFG were estimated using the new diagnostic cutoff values, and compared among laboratory subgroups.
DM = diabetes mellitus, IFG = impaired fasting glucose, KNHANES = Korea National Health and Nutrition Examination Survey, KLAP = Korean Laboratory Accreditation Program, KEQAS = Korean External Quality Assessment Scheme, HSL = highly-standardized laboratory, BSL = basically-standardized laboratory, NSL = non-standardized laboratory, ADA = American Diabetes Association, VIS = variance index score, FP = false positive, FN = false negative.
|
Diagnostic glucose cutoff values for DM and IFG
Reference cutoff values for DM and IFG in adults aged over 30 were defined as fasting blood glucose levels equal to or greater than 126 mg/dL and 100–125 mg/dL, respectively, in accordance with the guidelines of the American Diabetes Association (ADA).12 We hypothesized that the cutoff values of the ADA diagnostic criteria may differ according to the standardization level of each laboratory. Therefore, new cutoff values were estimated by using VIS data on glucose levels from the KEQAS with taking into account its standardization level of the laboratories. The value of the VIS was computed as follows; VIS = [(Measured value – Reference value)/Reference value × 100]/CCV × 100, in where “measured value” was the result from each participating laboratory and chosen coefficient of variation (CCV) was the chosen coefficient of variation taken from the National External Quality Assessment Scheme in the United Kingdom (1971).13 The CCV of fasting blood glucose used in this study was defined as 7.7.13
From the database of KNHANES, the measured glucose values of the subjects who were diagnosed with DM for each of laboratory subgroups, were estimated by inverting the VIS formula as follows; 1) Glucose (mg/dL) = Reference value × [1 + (VIS × CCV)/104] if the measured value of glucose was larger than the reference value of 126 mg/dL, and 2) Glucose (mg/dL) = Reference value × [1 − (VIS × CCV)/104] if the former was smaller than the latter. Based on the formulae of 1) and 2), the new diagnostic cutoff values for DM were suggested as follows; 3) Cutoff value (mg/dL) = 126/[1 + (VIS × CCV)/104], with which FP results for DM would be estimated, and 4) Cutoff value (mg/dL) = 126/[1 − (VIS × CCV)/104], with which its FN results would be obtained. Similarly, to obtain FP and FN IFG diagnosis, we suggested the following criteria; 5) use a cutoff value (mg/dL) of 100/[1 + (VIS × CCV)/104] to calculate FP IFG diagnoses, while 6) that of 100/[1 − (VIS × CCV)/104] to estimate FN IFG diagnoses. A relationship of changing diagnostic cutoff values with its induced measurement error are illustrated in Fig. 2.
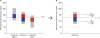 | Fig. 2Relationship between the change in diagnostic cutoff values for diabetes mellitus and its induced measurement error, regarding FP and FN.
FP = false positive, FN = false negative, VIS = variance index score, CCV = chosen coefficient of variation.
|
In case of NSL, no VIS data was available because they did not participate in the KEQAS. However, it was shown that there is the significant difference between the group with or without KLAP and the practice standardization is strongly associated with the accuracy of test results.8 Also, the participants in the KEQAS have achieved good performance (less than 100 VIS) in clinical chemistry tests in number up to 83.2% of all participants during 1990s after the onset of KEQAS,6 so that, in order to estimate the VIS of fasting blood glucose in NSLs, we hypothesized the following scenarios; First, the VIS of fasting blood glucose will increase linearly as standardization level decreases (HSL < BSL < NSL). Second, the VIS of NSL is higher than that of BSL and can be estimated from the difference between HSL and BSL (denoted as ΔHB). Under these assumptions; the VIS of fasting blood glucose of NSL was estimated by adding ΔHB to the median VIS of BSL. Considering that the NL represents the lowest standardized level of laboratories, as a sensitivity analysis, we also computed an addition of twice of ΔHB to the median VIS of BSL NSL. We referred the former as ‘NSL-I,’ while the latter as ‘NSL-II.’
Estimation of the prevalence of DM and IFG using data from KNHANES
Based on the suggested cutoff values for diagnostic criteria, prevalence of DM and IFG were estimated using data from the 2013 KNHANES, which were presented along with its 95% confidence intervals (CIs).
Statistical analyses
All statistical analyses were conducted using the ‘survey’ package of R software (version 3.1.3; The R Foundation for Statistical Computing, Vienna, Austria), which incorporates a survey's complex sampling design by considering its sampling weights and strata.14 Student's t-test was used to compare the VIS for fasting blood glucose between HSL and BSL from the 2013 KEQAS data. Median VIS value was selected as a representative summary measure for our scenarios. In the sensitivity analysis, values of the first and third quartiles were also provided. The demographic characteristics of the subjects from KNHANES were reported as weighted percentage (standard error [SE]) for categorical variables and weighted mean (SE) for continuous variables. They were compared by Rao-Scott χ2 test for categorical variables and analysis of variance for continuous variables.
RESULTS
Laboratory categorization by standardization level
According to the accreditation by the KLAP and/or KEQAS in 2013, a total of 1,242 laboratories were classified into HSL (21%, 261/1,242) and BSL (79%, 981/1,242). The distribution of the VIS of fasting blood glucose for HSL and BSL is given in Table 1. The HSL showed significantly lower mean and median VIS values for glucose level than the BSL (P < 0.001).
Table 1
VIS of glucose according to laboratory standardization levels

| VIS of blood glucose | HSLb (na = 261) | BSLc (na = 981) | P value |
|---|---|---|---|
| Mean ± SD | 26.7 ± 18.1 | 43.7 ± 34.7 | < 0.001 |
| Median (IQR) | 21.2 (15.3–31.8) | 33.3 (21.9–52.2) | - |
P value by Student's t-test.
VIS = variance index score, HSL = highly-standardized laboratory, BSL = basically-standardized laboratory, SD = standard deviation, IQR = interquartile range, KLAP = Korean Laboratory Accreditation Program, KEQAS = Korean External Quality Assessment Scheme.
aNumber of laboratories; bLaboratories received both KLAP and KEQAS accreditations in 2013; cLaboratories received KEQAS accreditation only in 2013.
![]()
Diagnostic glucose cutoff values for DM and IFG by laboratory subgroup
The cutoff values of diagnostic criteria for DM and IFG estimated based on the FP and FN scenarios are presented in Table 2. We note that these values go further apart from the reference value (126 mg/dL for DM and 100–125 mg/dL for IFG) as the laboratory standardization level decreases.
Table 2
Assumptions based on the virtual scenario for the diagnosis of DM and IFG

The reference cutoff values for DM and IFG in adults were 126 mg/dL and 100–125 mg/dL, respectively, as defined by the American Diabetes Association.11
DM = diabetes mellitus, IFG = impaired fasting glucose, HSL = highly-standardized laboratory, BSL = basically-standardized laboratory, NSL = non-standardized laboratory, Q1 = 1st quartile, Q3 = 3rd quartile, FP = false positive, FN = false negative, VIS = variance index score, CCV = chosen coefficient of variation, KLAP = Korean Laboratory Accreditation Program, KEQAS = Korean External Quality Assessment Scheme.
aThe diagnostic cutoff values for DM as follows; cutoff value (mg/dL) = 126/[1 + (VIS × CCV)/104], which can produce FP results, and cutoff value (mg/dL) = 126/[1 − (VIS × CCV)/104], which can produce FN results; bThe diagnostic cutoff values for IFG as follows; cutoff value (mg/dL), whose range is from 100/[1 + (VIS × CCV)/104] to 126/[1 + (VIS × CCV)104], which can produce FP results, and cutoff value (mg/dL), whose range is from 100/[1 − (VIS × CCV)/104] to 126/[1 − (VIS × CCV)/104], which can produce FN results; cLaboratories received both KLAP and KEQAS accreditations in 2013; dLaboratories received KEQAS accreditation only in 2013; eLaboratories received neither KLAP nor KEQAS accreditation (one difference in VIS between HSL and BSL); fLaboratories received neither KLAP nor KEQAS accreditation (two differences in VIS between HSL and BSL).
![]()
Estimated prevalence of DM and IFG using data from KNHANES
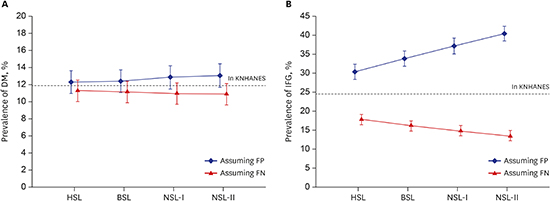
The demographic characteristics of the subjects used in the analysis from the KNHANES are summarized in Table 3 and the estimated prevalence of DM and IFG are in Table 4. When the new diagnostic cutoff values for DM associated with the FP rate were used, the prevalence was overestimated compared to the reference value obtained from the KNHANES data. The estimated prevalence of both NSL-I and NSL-II showed the largest difference. Compared to the prevalence of DM of 11.88% (95% CI, 10.59%–13.17%) in the KNHANES data as a reference value, the estimated prevalence of DM was 12.31% (95% CI, 10.99%–13.64%) in HSL, 12.41% (95% CI, 11.07%–13.75%) in BSL, and 12.86% (95% CI, 11.49%–14.22%) and 13.09% (95% CI, 11.74%–14.45%) in NSL-I and NSL-II, respectively (Fig. 3). The estimated prevalence of IFG showed more severe deviation than DM. They were 30.44% (28.45%–32.43%) in HSL, 33.82% (31.80%–35.84%) in BSL, 37.21% (95% CI, 35.19%–39.22%) in NSL-I, and 40.49% (38.54%–42.43%) in NSL-II compared to the reference value of 24.58% (95% CI, 22.85%–26.31%) with the KNHANES data.
Table 3
Demographic characteristics of the subjects from KNHANES for Korean individuals over the age of 30
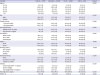
Data were reported as weighted percentage (SE) for categorical variables and mean (SE) for continuous variables.
DM = diabetes mellitus, IFG = impaired fasting glucose, KNHANES = Korea National Health and Nutrition Examination Survey, BMI = body mass index, SE = standard error.
aP values were calculated by Rao-Scott χ2 test for categorical variables and analysis of variance for continuous variables.
![]()
Table 4
Estimated prevalence of DM and IFG for Korean individuals over the age of 30

CI = confidence interval, HSL = highly-standardized laboratory, BSL = basically-standardized laboratory, NSL = non-standardized laboratory, DM = diabetes mellitus, IFG = impaired fasting glucose, Q1 = 1st quartile, Q3 = 3rd quartile, FP = false positive, FN = false negative, KNHANES = Korea National Health and Nutrition Examination Survey, VIS = variance index score, KLAP = Korean Laboratory Accreditation Program, KEQAS = Korean External Quality Assessment Scheme.
aLaboratories received both KLAP and KEQAS accreditations; bLaboratories received KEQAS accreditation only; cLaboratories received neither KLAP nor KEQAS accreditation (one difference in VIS between HSL and BSL); dLaboratories received neither KLAP nor KEQAS accreditation (two differences in VIS between HSL and BSL).
![]()
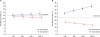 | Fig. 3Estimated prevalence of DM and IFG according to the standardized level assuming false positivity and false negativity. Each point and its vertical bar represents average prevalence and its 95% confidence interval. The dashed line indicates the prevalence in the KNHANES dataset, which is considered the reference value. Estimated prevalence of (A) DM and (B) IFG according to laboratory standardization level.
DM = diabetes mellitus, IFG = impaired fasting glucose, KNHANES = Korea National Health and Nutrition Examination Survey, FP = false positive, FN = false negative, HSL = highly-standardized laboratory, BSL = basically-standardized laboratory, NSL = non-standardized laboratory.
|
As sensitivity analyses, we estimated prevalence of DM and IFG after categorizing individuals who responded to KNHANES into five age groups, namely, 30's, 40's, 50's, 60's, and over 70's. The estimated prevalence showed systematic FP and FN biases across all of the groups. Specifically, when the new diagnostic cutoff values for DM and IFG associated with FN results were used, the prevalence of DM and IFG underestimated reference values, and, further, the amount of underestimation was getting severe as the laboratory standardization level became lower. Similar systematic biases were also observed for the FP (Supplementary Table 1).
DISCUSSION
This study analyzed the KNHANES data assuming a systematic bias of glucose testing. The prevalence of DM was overestimated using the FP cutoff value and underestimated using the FN cutoff value. The prevalence of DM showed a difference of about 2%, from 10.91% to 13.09%, but the prevalence of IFG showed a larger difference of about 27%, from 13.59% to 40.49%. Although this study was based on a virtual scenario, it is a first attempt to present data showing that standardization may influence data on national prevalence.
As society is aging and the prevalence of chronic disease is on the rise, the importance of national physical examination is magnified and an interest in individual health is increasing. This may grow the demands for diagnostic tests and increase the number of laboratories. If a disease is detected early or prevented with the aid of accurate test results, it could not only save on medical costs but also improve the quality of individual and national health. Recent studies estimated that the US health care system paid $66–199 million per year for tests that yielded wrong results due to calibration errors.15 Another study reported that the standardization program for creatinine measurement decreased the average total error from 23.9% to 9.7% and the average analytical bias from 16.5% to 2.7%. This can reduce the FP rate for stage 3 chronic kidney disease by 84%.16 Accurate and reliable test results can be useful in reducing economic cost as well as in the management, prognosis, and monitoring of disease.17 Also, health indicators, such as prevalence and incidence of certain diseases based on test results, create an important basis when establishing national policy.
Based on the results concerning prevalence in this study, the cost-effectiveness of DM screening was analyzed by applying a Markov model.18 The results showed that HSLs were superior not only in terms of cost reduction but also in increased quality-adjusted life years (QALYs), and this effect tended to be greater in older age groups. Compared to NSLs, HSLs showed lifetime cost savings of about 13,000 won per person and an increase in QALY of 0.0012 for those in their 30's, about 54,900 won and 0.005 QALY, respectively, for those in their 40's, about 213,000 won and 0.02 QALY, respectively, for those in their 50's, and about 167,000 won and 0.02 QALY, respectively, for those in their 60's.
This study has some limitations. It included only one diagnostic test for DM screening, however, the standardization of diagnostic tests affects a wide range of areas, including practically all medical practices and clinical diseases, so cannot be limited to a specific disease or test. In addition, the values for NSLs in the virtual scenario could not be validated because the true VIS of NSLs was not obtainable. To make up for uncertainty of the virtual scenario, sensitivity analyses for the values of the first and third quartiles and various age groups were performed in the present study.
Taken together, standardization affects matters of national importance, such as the prevalence of disease, economic costs, and further more health-related policies. It is necessary to manage the standardization of laboratories on the national level, and to introduce a system for quality assurance that will improve the accuracy of tests and the quality of national health.
 XML Download