Journal List > J Korean Med Sci > v.33(10) > 1107742

Park, Ahn, Park, Kim, Jeong, and Kim: Epidemiologic Characteristics of Injured School-age Patients Transported via Emergency Medical Services in Korea

Abstract

Background

The purpose of this study was to identify the characteristics of injuries of school-aged children transported via emergency medical services (EMS) that occurred in schools by comparing with injuries that occurred outside of school.

Methods

Data from the 119 EMS from 2012 to 2014 were analyzed. School and non-school injuries were analyzed in children 6 to 17 years of age. The epidemiologic characteristics were assessed according to school-age groups; low-grade primary (6–8 years), high-grade primary (9–13 years), middle (13–15 years) and high (15–17 years) school. Gender-stratified multivariable logistic regression analysis was conducted to estimate the risks of school injury in each age group.

Results

During the study period, a total of 167,104 children with injury were transported via 119 ambulances. Of these injuries, 13.3% occurred at schools. Boys accounted for 76.9% of school injuries and middle school children accounted for a significantly greater proportion (39.6%) of school injuries (P < 0.001). The most frequent mechanisms of injury at school were falls (43.8%). The peak times for school injury occurrence were lunch time (13:00–13:59) in all age groups. Multivariate regression identified the risky age groups as high-grade primary (odds ratio [OR], 1.14; 95% confidence interval [CI], 1.09–1.20) and middle school-aged boys (OR, 1.82; 95% CI, 1.74–1.90) and middle school-aged girls (OR, 1.30; 95% CI, 1.21–1.40).

Conclusion

Notable epidemiologic differences exist between in- and out-of-school injuries. The age groups at risk for school injuries differ by gender.

Graphical Abstract

jkms-33-e73-abf001

INTRODUCTION

The major cause of death and disability in children is injury in both developing and developed countries worldwide.1 According to the Centers for Disease Control and Prevention (CDC) Childhood Injury Report, on average, 12,175 children 0 to 19 years of age died each year in the United States from an unintentional injury.2 An estimated 9.2 million children annually had an initial emergency department (ED) visit for an unintentional injury.2 Also, over 40% of children aged under 12 years were found to have some form of disability due to unintentional injury from the Global Childhood Unintentional Injury Surveillance conducted in four cities.3 The most common cause of death in adolescence in Korea was also injury.4 Pediatric patients who visited the ED due to unintentional injury were 6,097 and the rate of critical injury was 59.8 per 100,000 population under aged 20 years.5
Schools have been regarded as relatively safe places from injury. Contrary to this belief, a significant number of injuries occur in schools. Previous studies reported that school injuries accounted for 26%–35% of all injuries in children.67 As school-aged children spend a considerable amount of time in school, school areas should be considered a more likely place than home for the occurrence of injury.8 School injury is an important target for injury prevention programs. Evaluation of the epidemiologic characteristics of injuries that occur in the school is the first step in establishing a strategy for school injury prevention programs.
Previous studies on school injury have used survey data from students or retrospective review of medical records. These data were limited in that detailed information about injury circumstances such as the time of injury could not be obtained.910 The present study used data from the emergency medical services (EMS). In Korea, EMS data are collected nationwide and systematically managed and offer relatively detailed information about injuries.
This study compared the demographic and injury characteristics of school-aged children transported by the EMS for injuries that occurred at school with those of same-aged children who were injured outside of school.

METHODS

Study design and setting

This retrospective cohort study used data from the EMS database from January 1, 2012 through December 31, 2014. This population-based database is nation-wide in Korea. The EMS databases is governed by each of 17 provincial EMS headquarters and shares the same structure.11 The data variables included patient demographic characteristics; clinical information; emergency care provided at the scene and during transportation; and time variables such as call, departure to scene, arrival at scene, etc. This database also included injury information, including the place and mechanisms of injury.12

Study subjects

We included data from injured children who were transported by EMS and were 6 to 17 years of age. Injury was defined as resulting physical harm, either intentional or unintentional, as coded by EMS providers at the scene. Cases with missing information regarding the place of injury were excluded.

Variables and statistical analysis

The place of injury was categorized as “school setting” when documented as “school,” whereas injuries that occurred in any location other than school were coded as “non-school.” Age was categorized into four groups with 3-year intervals: 6 to 8, 9 to 11, 12 to 14, and 15 to 17 years, which approximate the low-grade primary, high-grade primary, middle, and high school-age groups, respectively, according to the academic system in Korea.
The demographic findings and epidemiologic characteristics based on school and outside of school were described. The call day and time for EMS were defined as the occurrence day and time of injury. We investigated temporal variability in the time of day and season in the incidence of school injury.
Continuous data are reported as means and standard deviation or medians and interquartile range; categorical variables are reported as counts and percentages. Two-sided tests were conducted, and P < 0.05 was considered statistically significant. Gender-stratified multivariable logistic regression analysis was conducted to estimate the risks of school injury in each age group and adjusted odds ratios (aORs) and 95% confidence intervals (CIs) were calculated after adjusting for potential risk factors such as sex, season, time of day of injury occurrence, and urbanization level.

Ethics statement

The present study protocol was reviewed and approved by the Institutional Review Board of Seoul National University Hospital (No. H-1509-119-705). Informed consent was waived by IRB.

RESULTS

We analyzed a total 167,104 cases of child injuries transported by the EMS between 2012 and 2014 in Korea (Table 1). Of these injuries, 13% (22,285 patients) of injuries occurred while in school. The injury mechanisms differed between those that occurred inside and outside school. The most common injury mechanism was road accidents (48%) among school injuries that occurred outside of school, but the most common injury mechanism was fall (44%) among those that occurred in school.
Table 1

Demographics of injury occurred inside or outside the school and transported via EMS

jkms-33-e73-i001
Demographic parameters Entire subjects Girls Boys
Total, No. Outside, No. (%) Inside, No. (%) Outside, No. (%) Inside, No. (%) Outside, No. (%) Inside, No. (%)
All 167,104 144,819 22,285 41,220 5,141 103,599 17,144
Sex
Boys 120,743 103,599 (71.5) 17,144 (76.9)
Girls 46,361 41,220 (28.5) 5,141 (23.1)
Age group, yr
8–10 23,618 21,935 (15.1) 1,683 (7.6) 7,437 (18.0) 442 (8.6) 14,498 (14.0) 1,241 (7.2)
11–13 28,841 24,133 (16.7) 4,708 (21.1) 7,246 (17.6) 961 (18.7) 16,887 (16.3) 3,747 (21.9)
14–15 43,902 35,074 (24.2) 8,828 (39.6) 10,017 (24.3) 1,842 (35.8) 25,057 (24.2) 6,986 (40.7)
16–19 70,743 63,677 (44.0) 7,066 (31.7) 16,520 (40.1) 1,896 (36.9) 47,157 (45.5) 5,170 (30.2)
Season
Winter 44,464 36,874 (25.5) 7,590 (34.1) 10,447 (25.3) 1,921 (37.4) 26,427 (25.5) 5,669 (33.1)
Spring 50,373 44,892 (31.0) 5,481 (24.6) 12,378 (30.0) 1,104 (21.5) 32,514 (31.4) 4,377 (25.5)
Summer 43,050 36,202 (25.0) 6,848 (30.7) 9,948 (24.1) 1,578 (30.7) 26,254 (25.3) 5,270 (30.7)
Fall 29,217 26,851 (18.5) 2,366 (10.6) 8,447 (20.5) 538 (10.5) 18,404 (17.8) 1,828 (10.7)
Urbanization
Non-metro 97,765 85,260 (58.9) 12,505 (56.1) 24,918 (60.5) 2,886 (56.1) 60,342 (58.2) 9,619 (56.1)
Metro 69,339 59,559 (41.1) 9,780 (43.9) 16,302 (39.5) 2,255 (43.9) 43,257 (41.8) 7,525 (43.9)
Injury mechanism
MVC 69,858 69,354 (47.9) 504 (2.3) 17,573 (42.6) 118 (2.3) 51,781 (50.0) 386 (2.3)
Fall 37,275 27,505 (19.0) 9,770 (43.8) 8,186 (19.9) 2,482 (48.3) 19,319 (18.6) 7,288 (42.5)
Blunt trauma 10,704 8,068 (5.6) 2,636 (11.8) 1,976 (4.8) 398 (7.7) 6,092 (5.9) 2,238 (13.1)
Penetration 13,456 11,635 (8.0) 1,821 (8.2) 3,482 (8.4) 347 (6.7) 81,53 (7.9) 1,474 (8.6)
Others or unknown 35,811 28,257 (19.6) 7,554 (34.0) 10,003 (24.3) 1,796 (35.0) 18,254 (17.6) 5,758 (33.5)
EMS = emergency medical services, Outside = injury occurred outside the school, Inside = injury occurred inside the school, Winter = December to February, Spring = March to May, Summer = June to August, Fall = September to November, MVC = motor vehicle collision.
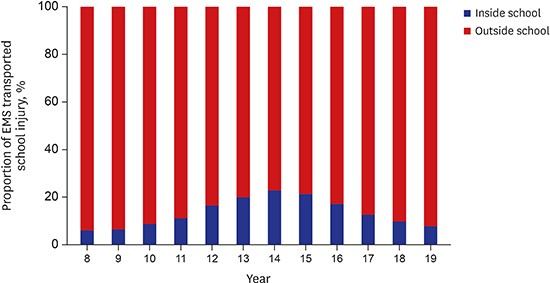
High school grade children were most often injured (70,743, 42%) outside school. Among school injuries, middle school grade children were most often injured (8,828, 39.6%) (Table 1). The proportion of school injuries increased until 12 years and then gradually decreased (Fig. 1). The proportion of fall injuries was highest in the low-grade primary school grade group. As the age increased, the proportion of fall injury gradually decreased (Table 2).
Fig. 1
Proportion of EMS transported injuries in children by age.
EMS = emergency medical services.
jkms-33-e73-g001
Table 2

Baseline characteristics of school injury grouped by level of school

jkms-33-e73-i002
Characteristics Elementary (low-grade), No. (%) Elementary (high-grade), No. (%) Middle school, No. (%) High school, No. (%)
All 1,683 4,708 8,828 7,066
Sex
Boys 1,241 (75.8) 3,747 (79.6) 6,986 (79.1) 5,170 (73.2)
Girls 442 (27.0) 961 (20.4) 1,842 (20.9) 1,896 (26.8)
Season
Winter 570 (34.8) 1,369 (29.1) 2,897 (32.8) 2,754 (39.0)
Spring 421 (25.7) 1,203 (25.6) 2,165 (24.5) 1,692 (23.9)
Summer 508 (31.0) 1,593 (33.8) 2,809 (31.8) 1,938 (27.4)
Fall 184 (11.2) 543 (11.5) 957 (10.8) 682 (9.7)
Urbanization
Non-metro 943 (57.6) 2,575 (54.7) 4,850 (54.9) 4,137 (58.5)
Metro 740 (45.2) 2,133 (45.3) 3,978 (45.1) 2,929 (41.5)
Injury mechanism
MVC 74 (4.5) 87 (1.8) 129 (1.5) 214 (3.0)
Fall 901 (55.0) 2,362 (50.2) 3,848 (43.6) 2,659 (37.6)
Blunt trauma 220 (13.4) 596 (12.7) 1,114 (12.6) 706 (10.0)
Penetration 183 (11.2) 449 (9.5) 658 (7.5) 531 (7.5)
Others or unknown 305 (18.6) 1,214 (25.9) 3,079 (34.8) 2,956 (41.8)
Elementary low-grades indicate age 8–10 years old, age 11–13 years old for elementary high-grades. Middle and high school-ages were 14–16 and 17–19 years old.
Winter = December to February, Spring = March to May, Summer = June to August, Fall = September to November, MVC = motor vehicle collision.
Both inside and outside of school, the proportions of injured boys were higher compared to those of girls. In girls, the proportion of school injuries were highest in high school-aged children (36.9%). In boys, the proportion was highest in middle school-aged children (40.7%).
In multivariate analysis, the odds of school injury were 1.35 times greater in boys than in girls. The results of gender-stratified multivariate regression are shown in Table 3. When reference group was set to the high school-aged group, only middle school-aged girls had higher odds ratios (ORs). In boys, higher ORs were observed in not only middle school but also high-grade primary school-aged children compared to high school-aged children (Table 3).
Table 3

Multivariate logistic regression models for association between sex and school injury, sex stratified models for association between age group and school injury

jkms-33-e73-i003
Variables Entire subjects Girls Boys
aOR 95% CI aOR 95% CI aOR 95% CI
Sex
Boys 1.35 1.31–1.40
Age group, yr
8–10 0.42 0.40–0.45 0.36 0.32–0.40 0.44 0.41–0.47
11–13 1.05 1.01–1.10 0.80 0.73–0.87 1.14 1.09–1.20
14–16 1.68 1.62–1.74 1.30 1.21–1.40 1.82 1.74–1.90
17–19 Reference Reference Reference
Season
Winter 2.43 2.31–2.55 3.14 2.83–3.48 2.21 2.09–2.35
Spring 1.41 1.34–1.49 1.50 1.34–1.67 1.37 1.29–1.46
Summer 2.14 2.03–2.25 2.62 2.36–2.90 1.99 1.88–2.11
Fall Reference Reference Reference
Urbanization
Metro 1.15 1.12–1.19 1.22 1.15–1.30 1.13 1.09–1.17
Adjusted for sex, age group, season, injury time, and urbanization and sex stratified models for season, injury time and urbanization.
aOR = adjusted odds ratio, CI = confidence interval, Winter = December to February, Spring = March to May, Summer = June to August, Fall = September to November.
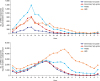
As shown in Fig. 2, the peak time for the occurrence of school injuries was lunch time (13:00–13:59) in all four age groups. However, the peak times for non-school injuries differed by age group. In primary and middle school-aged children, the peak time for non-school injury was around 5 p.m. In high school-aged children, the peak time for non-school injury was around 10 p.m.
Fig. 2
Time series plot of number of injured children transported via EMS grouped by level of school. Primary low-grades indicate age 8–10 years old, age 11–13 years old for primary high-grades. Middle and high school-ages were 14–16 and 17–19 years old.
EMS = emergency medical services.
jkms-33-e73-g002

DISCUSSION

The epidemiologic characteristics of school injuries differed from those of non-school injuries. Among school injuries, the risk of injury varied according to age group and gender. These epidemiologic findings provide insight to establish priorities and develop strategies for the prevention of school injuries.
We used the EMS database to evaluate the epidemiologic characteristics of school injuries. The EMS data in this study were systematically collected using a standardized, structured nationwide registry. Therefore, there was no recall bias, which is a concern when using surveys of injury experiences. Recently, the EMS database has been used for injury surveillance, including monitoring for injuries such as poisoning and drug overdose,13 mass casualty incidents,14 and severe trauma15 and for risk analysis such as regional variations or injury patterns in young adults engaged in alcohol use.16 This study provides a novel use for the EMS database for the surveillance of injuries occurring in a specific location, such as school.
The findings regarding the injury mechanism of school injury in this study were consistent with those of previous studies.171819 We also identified falls as the most common mechanism of school injury. Previous studies reported falls to be the most common mechanism of injury that required hospitalization and visit to the ED.2021 There was a report that slippery floors accounted for about one-third of school injuries. Environmental factors such as old facilities in disrepair, disorderedly stacked items, slippery or hard floors, and poor supervision of teachers are among the known risk factors for injury. To prevent injury in school and reduce serious damage, it is necessary to replace the floor of playgrounds or under hanging equipment with a soft material or to fix slippery staircases or corridors.22
In this study, 19.6% of the injuries occurring in school were classified as “other mechanism of injury.” We re-categorized mechanisms of injury in the EMS database according to International Classification of External Cause of Injury (ICECI) standards.23 However, there were items that did not match the classification criteria of ICECI because the injury mechanisms in the EMS database were classified according to the scope of the specific objectives of EMS prehospital care and transportation. For example, items such as ‘simple drunken person’ or ‘victim of violence’ in the EMS database did not re-categorize to mechanisms of injury according to ICECI. We categorized these items as ‘other mechanism of injury.’ Among injury mechanisms that were matched ICECI, proportions of thermal injury (1.0%) and poisoning (0.2%) were small. These injury mechanisms included in the ‘other mechanism of injury’ category. The items recorded as ‘other mechanism’ in EMS database were reviewed individually and reclassified according to ICECI.
As several previous studies have also reported, there is a need to pay more attention to middle school injury.24252627 During the middle school years, students' activity levels increase as the body grows rapidly, and the impulsive nature of adolescents contribute to the increased occurrence of injuries in this age group.26 A previous study reported that 50% of school injuries classified as violent occurred in children 10 to 14 years of age.28 Unfortunately, there was no information for intent of injury in the 119 EMS database. In this study, high-grade primary school boys were also at risk for school injury. Depending on the age of puberty, faster, earlier interventions may be necessary to prevent injuries.
Boys were injured more often in this study. According to a previous study, the proportion of serious injuries requiring hospital admission was higher in boys.17 This may be because boys have more dangerous behaviors that are likely to cause injury, such as hanging or climbing high.2930 In this study, the age groups at risk for school injury differed by gender. When developing an injury prevention strategy, age group and gender should be considered.
In a previous study of approximately 15,000 children 0–16 years, the peak rate of injury occurred at approximately 17:00 and a noticeable shoulder in the temporal pattern was observed around noon among all injuries. The peak times among 5–15 years old children clustered between 15:56 and 16:24.31 Another study of 70,000 pediatric trauma cases showed a circadian acrophase at 14:30, with no case recorded between midnight and 04:00.32 The authors suggested that physical activities at school should be planned for the morning rather than in the afternoon. In the present study, the peak incidence was lunch time for all age groups. Several explanations are possible. In Korea, boys may try to compensate for insufficient physical activity in class to play soccer at lunch time. There was also loose teacher supervision during lunch time.
The present study had some limitations. First, the characteristics of patients transported by the EMS differed from those of non-EMS patients. Generally, people with low socioeconomic status and those with more severe injuries tend to use the EMS.33 This difference should be considered when interpreting the results of this study. Second, there was no information on the injury outcomes such as severity of injury or disposition. The linkage of EMS data and hospital records was a challenging issue.
In conclusion, a significant proportion of injuries to school-aged children occur at school and notable differences exist between the epidemiology of in- and out-of-school injuries. These epidemiologic findings provide an insight to establish priority and develop strategies for prevention of the school injury.

Notes

Funding This study was financially supported by the Korea Institute for Health and Social Affairs (2015).

Disclosure The authors have no potential conflicts of interest to disclose.

Author Contributions

  • Conceptualization: Park HA.

  • Data curation: Kim M.

  • Formal analysis: Kim J.

  • Investigation: Ahn KO.

  • Supervision: Ahn KO.

  • Writing - original draft: Park HA, Ahn KO.

  • Writing - review & editing: Park J.

References

1. Global Burden of Disease Pediatrics Collaboration. Global and national burden of diseases and injuries among children and adolescents between 1990 and 2013: findings from the global burden of disease 2013 study. JAMA Pediatr. 2016; 170(3):267–287.
2. Borse NN, Gilchrist J, Dellinger AM, Rudd RA, Ballesteros MF, Sleet DA. Unintentional childhood injuries in the United States: key findings from the CDC childhood injury report. J Safety Res. 2009; 40(1):71–74.
crossref
3. Peden M, Oyegbite K, Ozanne-Smith J, Hyder AA, Branche C, Rahman AK, et al. World Report on Child Injury Prevention. Geneva, Switzerland: World Health Organization;2008.
4. Statistics Korea. Annual Report on the Cause of Death Statistics. Daejon, Korea: Statistics Korea;2013.
5. Jung JH, Kim DK, Jang HY, Kwak YH. Epidemiology and regional distribution of pediatric unintentional emergency injury in Korea from 2010 to 2011. J Korean Med Sci. 2015; 30(11):1625–1630.
crossref
6. Rivara FP, Calonge N, Thompson RS. Population-based study of unintentional injury incidence and impact during childhood. Am J Public Health. 1989; 79(8):990–994.
crossref
7. Fang Y, Zhang X, Chen W, Lin F, Yuan M, Geng Z, et al. Epidemiological characteristics and burden of childhood and adolescent injuries: a survey of elementary and secondary students in Xiamen, China. BMC Public Health. 2015; 15(1):357.
crossref
8. Mytton J, Towner E, Brussoni M, Gray S. Unintentional injuries in school-aged children and adolescents: lessons from a systematic review of cohort studies. Inj Prev. 2009; 15(2):111–124.
crossref
9. Amanullah S, Heneghan JA, Steele DW, Mello MJ, Linakis JG. Emergency department visits resulting from intentional injury in and out of school. Pediatrics. 2014; 133(2):254–261.
crossref
10. Wahdan MM, Sayed AM, Abd Elaziz KM, El-Hoseiny MM, Al-Gwaily MM. Prevalence of injuries among high school students in Eastern and Western parts of Cairo, Egypt. Injury. 2016; 47(12):2650–2654.
crossref
11. Shin SD, Ong ME, Tanaka H, Ma MH, Nishiuchi T, Alsakaf O, et al. Comparison of emergency medical services systems across Pan-Asian countries: a Web-based survey. Prehosp Emerg Care. 2012; 16(4):477–496.
crossref
12. Lee SU, Suh D, Kim HB, Jung JH, Hong KJ, Lee JH, et al. Epidemiology of prehospital emergency medical service use in Korean children. Clin Exp Emerg Med. 2017; 4(2):102–108.
crossref
13. Ising A, Proescholdbell S, Harmon KJ, Sachdeva N, Marshall SW, Waller AE. Use of syndromic surveillance data to monitor poisonings and drug overdoses in state and local public health agencies. Inj Prev. 2016; 22:Suppl 1. i43–i49.
crossref
14. Park JO, Shin SD, Song KJ, Hong KJ, Kim J. Epidemiology of emergency medical services-assessed mass casualty incidents according to causes. J Korean Med Sci. 2016; 31(3):449–456.
crossref
15. Minei JP, Schmicker RH, Kerby JD, Stiell IG, Schreiber MA, Bulger E, et al. Severe traumatic injury: regional variation in incidence and outcome. Ann Surg. 2010; 252(1):149–157.
16. Barton DJ, Tift FW, Cournoyer LE, Vieth JT, Hudson KB. Acute alcohol use and injury patterns in young adult prehospital patients. Prehosp Emerg Care. 2016; 20(2):206–211.
crossref
17. Sun YH, Yu IT, Wong TW, Zhang Y, Fan YP, Guo SQ. Unintentional injuries at school in China--patterns and risk factors. Accid Anal Prev. 2006; 38(1):208–214.
crossref
18. Gratz RR. School injuries: what we know, what we need. J Pediatr Health Care. 1992; 6(5 Pt 1):256–262.
crossref
19. Scheidt PC, Harel Y, Trumble AC, Jones DH, Overpeck MD, Bijur PE. The epidemiology of nonfatal injuries among US children and youth. Am J Public Health. 1995; 85(7):932–938.
crossref
20. Di Scala C, Gallagher SS, Schneps SE. Causes and outcomes of pediatric injuries occurring at school. J Sch Health. 1997; 67(9):384–389.
21. Salminen S, Kurenniemi M, Råback M, Markkula J, Lounamaa A. School environment and school injuries. Front Public Health. 2014; 1:76.
crossref
22. Wilson M, Baker S. Structural approach to injury control. J Soc Issues. 1987; 43(2):73–86.
crossref
23. International classification of external causes of injury (ICECI). Updated 2003. Accessed September 6, 2017. http://www.who.int/classifications/icd/adaptations/iceci/en/.
24. Hu GQ, Zhu SL, Wang QQ, Chen TM, Tan AC, He Q, et al. An epidemiological survey on the incidence of non-fatal injury and influencing factors among children under 5 years old in China. Zhonghua Liu Xing Bing Xue Za Zhi. 2011; 32(8):773–776.
25. Taketa S. Student accidents in Hawaii's public schools. J Sch Health. 1984; 54(5):208–209.
crossref
26. Feldman W, Woodward CA, Hodgson C, Harsanyi Z, Milner R, Feldman E. Prospective study of school injuries: incidence, types, related factors and initial management. Can Med Assoc J. 1983; 129(12):1279–1283.
27. Lenaway DD, Ambler AG, Beaudoin DE. The epidemiology of school-related injuries: new perspectives. Am J Prev Med. 1992; 8(3):193–198.
crossref
28. Linakis JG, Amanullah S, Mello MJ. Emergency department visits for injury in school-aged children in the United States: a comparison of nonfatal injuries occurring within and outside of the school environment. Acad Emerg Med. 2006; 13(5):567–570.
crossref
29. Harris CR, Jenkins M, Glaser D. Gender differences in risk assessment: why do women take fewer risks than men? Judgm Decis Mak. 2006; 1(1):48–63.
30. Coppens NM, Gentry LK. Video analysis of playground injury-risk situations. Res Nurs Health. 1991; 14(2):129–136.
crossref
31. Reinberg O, Lutz N, Reinberg A, Mechkouri M. Trauma does not happen at random. Predictable rhythm pattern of injury occurrence in a cohort of 15,110 children. J Pediatr Surg. 2005; 40(5):819–825.
32. Koch HJ, Vogel M, Raschka C. Circadian rhythm of accidents in children: a basic activity periodicity. Chronobiol Int. 2003; 20(1):157–159.
33. Shah MN, Cushman JT, Davis CO, Bazarian JJ, Auinger P, Friedman B. The epidemiology of emergency medical services use by children: an analysis of the National Hospital Ambulatory Medical Care Survey. Prehosp Emerg Care. 2008; 12(3):269–276.
crossref
TOOLS
ORCID iDs

Hang A Park
https://orcid.org/0000-0002-8714-0828

Ki Ok Ahn
https://orcid.org/0000-0002-8446-3269

Ju Ok Park
https://orcid.org/0000-0002-1024-3626

Jungeun Kim
https://orcid.org/0000-0002-5457-745X

Seungmin Jeong
https://orcid.org/0000-0002-5409-3324

Meesook Kim
https://orcid.org/0000-0003-2494-341X

Similar articles