

 PDF
PDF Citation
 Print
Print


INTRODUCTION
Body mass index (BMI) has increased rapidly around the world.1 As a consequence, the burden of disease associated with high BMI has upsurged over the past several decades.2 In Korea, due to the rapid socioeconomic development and lifestyle changes, the mean value of BMI and corresponding overweight prevalence have also increased rapidly, but the pattern differed by gender.34 High BMI was the fourth leading risk factor for disease burden in Korea, following smoking, alcohol use and hypertension.5
Obesity and overweight vary according to gender and socioeconomic position.67 In particular, pro-rich inequalities in obesity and overweight have been observed among women in developed countries. According to prior Korean studies, the relationship between socioeconomic position and overweight, including obesity, was positive in men, but negative in women.48
Achieving equity in overweight has been established as a goal in the Korean national health plan. Especially, the development and implementation of overweight prevention programs for low-income class at the local government level (district authorities) was included as an objective in the third National Health Plan 2020.9 In addition, narrowing the income gap in optimal weight was set as a target in the fourth National Health Plan 2020 in Korea.10 To implement policies to reduce income-related inequality in overweight at the local government level, it is essential to validly and reliably measure overweight prevalence according to income levels within local districts (si, gun, and gu).
The Community Health Survey (CHS) is one of the data sources available for monitoring the magnitude of health inequality at the district level in Korea. CHS can be used to measure various health outcomes, health behaviors and other health indicators such as body weight and height in each si, gun, and gu. In the CHS, however, body weight and height are not directly measured, but self-reported by participants. Moreover, when measuring smoking inequality at the district level using the CHS, several rounds of CHS data should be combined to ensure sufficient sample sizes.11 Even in some districts, pro-poor inequalities in smoking prevalence were observed, which were contrary to the results of previous Korean studies.121314 The authors suggested stochastic variations due to the small sample sizes for each district as the potential cause of such findings.11
The National Health Insurance Service (NHIS) conducts national health screening programs annually, which consist of the general health screening program and the transitional age health screening program.15 As a single insurer, the NHIS provides universal health coverage for the entire Korean population. The National Health Screening Database (NHSD) of the NHIS contains information on anthropometric measurement such as body weight and height, self-reported health behaviors, blood test and urine analysis performed in national health screening programs. In addition, the NHSD is linked to the National Health Information Database (NHID) Eligibility database containing health insurance premium information which can be used as a proxy for income level.15 The number of subjects in the NHSD in 2014 was 17,379,951 with an increasing trend each year.15 However, whether the NHSD could be used for monitoring health inequality at the level of district in Korea has not been explored.
The aim of this study was to investigate the utility of the NHSD in monitoring income-related inequality in overweight prevalence at the district level in comparison with the CHS. First, we compared the age-adjusted mean BMI calculated from the NHSD, the CHS and the Korea National Health and Nutrition Examination Survey (KNHANES) between 2009 and 2014. Second, we divided the entire six years (2009–2014) of the study period into three periods (2009–2010, 2011–2012, and 2013–2014) and compared the magnitudes of the between-period correlation of district-level age-standardized overweight prevalences based on the NHSD and the CHS. Third, we compared the age-standardized overweight prevalences and interquintile income gaps in overweight prevalence at the district level based on the two databases for the years 2009–2014.
METHODS
Data
We utilized data from the NHSD, the CHS and the KNHANES for 2009–2014. The national health insurance beneficiaries in Korea consist of the self-employed insured, insured employees and their dependents. In the case of the self-employed insured, all heads of household and the household members aged 40 or older are eligible for the general health screening program every two years. Employees in non-office work are subject to the general health screening program every year while employees in office-work are subject to the general health screening program every two years. Employees in non-office work or office work are eligible regardless of their age. Dependents of insured employees aged 40 or older are eligible for a biennial health examination. Subjects aged 40 and 66 in the general health screening program are entitled to the transitional age health screening program.15 Considering the eligibility criteria of the Korean national health screening programs, we have reconstructed the NHSD as follows to prevent overrepresentation of certain subpopulations. First, we set two years (2009–2010, 2011–2012, and 2013–2014) as one study period considering different health screening intervals according to the eligibility for the national health insurance. For subjects who participated in national health screening programs in both years of a study period, information on gender, age and residential area was used for the most recent year. The average of the two years regarding body weight, height and health insurance premium was used for analysis. The same method was employed in a recent international collaborative research.16 Second, because all national health insurance beneficiaries aged 40 or older are eligible for national health screening programs at least once every two years, we restricted the analysis to participants over 40 years of age. Thus, the study population consisted of 39,093,653 participants (18,898,725 men and 20,194,928 women) in the NHSD in 2009–2014, after excluding 15,479 (0.04%) participants who had missing values of BMI.
CHS is a nation-wide, community-based, cross-sectional survey that has been conducted annually since 2008, with approximately 900 participants aged 19 years or older in each si, gun, and gu in Korea. More details about the CHS were described elsewhere.11 In this study, we analyzed 926,580 individuals (432,463 men and 494,117 women) aged 40 or older in the CHS in 2009–2014, after excluding 62,958 (6.4%) individuals with missing values of BMI.
We also utilized the KNHANES when comparing the distribution of BMI, body weight, and height with the NHSD and the CHS. KNHANES is a nationally representative survey that has been conducted in Korea since 1998, with about 10,000 participants each year.17 KNHANES consists of three components: health interview, health examination and nutrition survey to investigate various health-related indicators. In particular, anthropometric measurements, including body weight and height, are performed by well-trained medical staff in health examination. In this study, a total of 26,100 participants aged 40 or older (11,199 men and 14,901 women) in the KNHANES in 2009–2014 were analyzed after excluding 1,275 (4.7%) participants who had missing values of BMI.
Reclassification of si, gun, and gu
According to the governmental administrative classification in 2015, the Korean administrative district consists of 252 si, gun, and gu. We reclassified 252 si, gun, and gu into 245 analysis units in consideration of the changes in the administrative districts in 2009–2014. Details of the reclassification of si, gun, and gu were described elsewhere.11
Measurement of body weight, height, BMI, and overweight
In the NHSD, anthropometric measurements, including body weight and height, were performed. The staff of medical institutions participating in the national health screening programs measured the body weight and height of the participants, but some applicants self-reported their body weight and height on request.18 The anthropometric measurements in the NHSD should be measured using certified equipment approved for a calibration test. In the CHS, body weight and height were self-reported by the questionnaires “What is your current height?” and “What is your current weight?” In the KNHANES, body weight and height were measured in a standardized manner.17 Body weight was measured with a digital scale at intervals of 0.1 kg, while the participants wore a disposable gown or underwear. Height was measured closest to 0.1 cm using a stadiometer in the upright position. The BMI of subjects was calculated by dividing the body weight (in kilograms) by the height (in meters) squared. BMI is widely known as a useful tool for measuring the population-level overweight and obesity.19 Subjects with BMI less than 10 or greater than 70 were excluded from the analysis. Overweight was defined as BMI 25 or higher according to the criteria published by World Health Organization.19
Income
By linking with the NHID Eligibility database, we obtained information on national health insurance premiums at the end of the year (December 31) as a proxy for income levels in the NHSD. When the year-end health insurance premium was not available, the most recent national health insurance premiums were used instead. In a prior study conducted by the NHIS,20 the number of population of the NHID Eligibility database was almost the same as that from the Korean Statistical Information Service (KOSIS). In addition, the concordance correlation coefficients of the district-level crude mortality rate and life expectancy between the NHID Eligibility database and the KOSIS ranged between 0.997–0.999 and 0.914–0.990, respectively. NHID, therefore, is considered a useful data source for monitoring the health status of the entire Korean population at the level of district. The usefulness of the national health insurance premium as a proxy for income levels in monitoring the income gap in health outcomes has been demonstrated in previous studies.2122 We calculated the equivalized health insurance premium to take into account the size of the household by using the following equation.

In the 2009–2013 CHS, income data were calculated from self-reported monthly or yearly household income information, which was collected as a continuous variable. In the 2014 CHS, monthly household income was measured as a categorical variable with eight categories (less than 500,000 Korean won [KRW], 500,000 to 1,000,000 KRW, 1,000,000 to 2,000,000 KRW, 2,000,000 to 3,000,000 KRW, 3,000,000 to 4,000,000 KRW, 4,000,000 to 5,000,000 KRW, 5,000,000 to 6,000,000 KRW, and over 6,000,000 KRW). The categorized monthly household income in the 2014 CHS was converted to a continuous variable by taking the median value of each category. Other details of income data for the CHS were described elsewhere.11
Statistical analysis
In this study, we divided the whole study period of six years (2009–2014) into three periods (2009–2010, 2011–2012, and 2013–2014). Thus, we merged the two-year NHSD into single-period data. The district-level income quintiles were calculated from the data for each period according to gender, 245 si, gun, and gu, and 5-year age groups. We determined the district-level income quintiles at the nearest quintile (20%, 40%, 60%, and 80%) of the cumulative equivalized health insurance premium of each group. The district-level age-adjusted mean BMI, using least squares regressions, for each study period was estimated. We also estimated the district-level age-standardized overweight prevalence for each study period. In addition, after combining the NHSD for six years (2009–2014), we calculated the age-adjusted mean BMI, body weight, and height, also using least squares regressions, as well as the overall age-standardized overweight prevalence. We also computed age-standardized overweight prevalence by district-level income quintiles and interquintile income gap in overweight prevalence at the district level in similar methods as calculating the district-level age-standardized smoking prevalence and its interquintile income gap described elsewhere.11
We also combined the CHS data for 2009–2010, 2011–2012, and 2013–2014 into single-period data. The district-level income quintiles were calculated in the same manner as described elsewhere.11 The age-adjusted mean body weight, height and BMI as well as the district-level age-standardized overweight prevalence and its interquintile income gap were computed for the CHS using the same method as the NHSD. Using the 2009–2014 KNHANES, we calculated the age-adjusted mean body weight, height and BMI in the same manner as the NHSD and the CHS. In all analyses, the 2010 mid-year resident population in Korea was used as the standard population.
In this study, we compared the distribution and age-adjusted mean value of body weight, height and BMI from the NHSD, the CHS and the KNHANES for 2009–2014. We also conducted between-period correlation analyses of the age-adjusted mean BMIs and the age-standardized overweight prevalence based on the NHSD and the CHS. In addition, we performed correlation analyses of the age-standardized overweight prevalence and interquintile income gaps in overweight prevalence using the two databases in 2009–2014. All analyses were performed using SAS version 9.4 (SAS Institute, Cary, NC, USA).
RESULTS
Table 1 shows the characteristics of the study subjects. The total number of subjects in the NHSD in 2009–2014 was 39,093,653. Of these, a total of 18,905,202 (48.4%) were men and 20,194,928 (51.7%) were women. The number of subjects increased with years in both men and women. The mean age of men was 54.9 years (standard deviation [SD], 10.3 years) and the mean age of women was 55.9 years (SD, 10.6 years). The crude prevalence of overweight (including obesity) was 38.4%, which was higher than that of women (32.4%). The prevalence of overweight in men increased over time, but decreased in women. The pattern was also true for the age-standardized prevalence of overweight. The total number of study subjects in the CHS for 2009–2014 was 926,580, of which 432,463 (46.7%) were men and 494,117 (53.3%) were women. The mean age for men was 57.8 years (SD, 11.8 years) and 58.5 years for women (SD, 12.2 years). The crude overweight prevalence was 27.6% in men and 22.5% in women, both men and women had lower crude overweight prevalence than the NHSD. The crude overweight prevalence was higher in men than in women and the crude prevalence of overweight in both men and women increased over time. A similar pattern was observed for the age-standardized prevalence of overweight using the CHS.
Table 1
Characteristics of study subjects according to study periods, data from the NHSD and the CHS in Korea, 2009–2014
Age-standardized overweight prevalence was estimated with the 2010 mid-year resident population as the standard population and presented as 95% CI.
NHSD = National Health Screening Database, CHS = Community Health Survey, SD = standard deviation, CI = confidence interval.
![]()
Table 2 shows the BMI distribution and age-adjusted mean value of BMI based on the NHSD (measured data), the CHS (self-reported data) and the KNHANES (measured data). The mean value of BMI estimated from the NHSD and the KNHANES was similar in both men and women, which was lower in the CHS than in the other two databases. This pattern was more evident for the age-adjusted mean values of BMI. Graphical displays of the distribution of BMI among men and women from the NHSD, the CHS and the KNHANES are shown in the Fig. 1. In the CHS, the BMI distribution shifted toward the left rather than the BMI distribution of the NHSD and the KNHANES in both genders. However, in men, the BMI distribution shifted toward the left only among the normal or overweight groups, whereas in women, the BMI distribution shifted toward the left, including the underweight group (BMI < 18.5).
Table 2
Distribution of BMI and age-adjusted mean values for BMI according to gender, findings from the NHSD, the CHS, and the KNHANES in Korea, 2009–2014

All values are presented in kg/m2. Age-adjusted mean values for BMI were estimated with the 2010 mid-year resident population as the standard population.
BMI = body mass index, NHSD = National Health Screening Database, CHS = Community Health Survey, KNHANES = Korea National Health and Nutrition Examination Survey, SD = standard deviation.
![]()
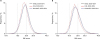 | Fig. 1Distribution of BMI among men and women, findings from the NHSD, the CHS, and the KNHANES in Korea, 2009–2014. (A) Distribution of BMI among men. (B) Distribution of BMI among women.
BMI = body mass index, NHSD = National Health Screening Database, CHS = Community Health Survey, KNHANES = Korea National Health and Nutrition Examination Survey.
|
Supplementary Table 1 shows the distribution and the least square mean values of body weight and height based on the NHSD, the CHS, and the KNHANES. For both men and women, the mean values of body weight and height calculated from the NHSD and the KNHANES were similar. However, the mean value of body weight calculated from the CHS was lower than that calculated from the NHSD and the KNHANES while the mean height from the CHS was higher than from the NHSD and the KNHANES. The same was true for the age-adjusted mean value of body weight and height. Supplementary Fig. 1 graphically illustrates the body weight and height distribution in the NHSD, the CHS, and the KNHANES. The height and weight distribution based on the NHSD and the KNHANES were similar, but different in the CHS in both men and women. Especially, the height distribution from the CHS shifted toward the right compared with the height distribution from the NHSD and the KNHANES. For both genders, the body weight and height distributions in the NHSD and the KNHANES illustrated bell-shaped curves. In the CHS, however, the proportion of body weight and height ending at 0 and 5 was relatively large, illustrating a saw-tooth shaped curve (Supplementary Fig. 1).
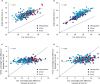
Fig. 2 shows the between-period correlation of age-standardized overweight prevalences at the district level based on the NHSD and the CHS. The between-period correlation coefficients (r) for the district-level age-standardized prevalence of overweight were higher in the NHSD than in the CHS. The between-period correlation coefficients of district-level overweight prevalence for both genders ranged from 0.94 (correlation coefficient for men's overweight prevalence between 2009–2010 and 2013–2014) to 0.98 (correlation coefficient for women's overweight prevalence between 2011–2012 and 2013–2014) in the NHSD, while from 0.59 (correlation coefficient for women's overweight prevalence between 2009–2010 and 2013–2014) to 0.71 (correlation coefficient for women's overweight prevalence between 2011–2012 and 2013–2014) in the CHS. Supplementary Fig. 2 presents the between-period correlation for the district-level age-adjusted BMIs based on the NHSD and the CHS. The magnitudes of the between-period correlation for the district-level age-adjusted mean BMIs were also higher in the NHSD than in the CHS.
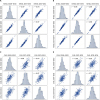 | Fig. 2Scatter plots (and correlation coefficients [r]) for correlations of age-standardized overweight prevalence between biennial time periods of analysis, findings from the NHSD and the CHS in Korea, 2009–2014. (A) Results from the NHSD in men. (B) Results from the NHSD in women. (C) Results from the CHS in men. (D) Results from the CHS in women.
NHSD = National Health Screening Database, CHS = Community Health Survey.
|
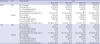
As shown in Table 3, we compared the distribution of district-level overall age-standardized prevalence of overweight and age-standardized overweight prevalence by income quintiles according to gender based on the NHSD and the CHS. For men, the median value of the district-level age-standardized overweight prevalence from the NHSD was 38.5% (95% confidence interval [CI], 38.2%, 38.8%) and the SD was 2.8%p. The minimum value was 31.1% (95% CI, 30.7%, 31.6%) in Dong-gu, Ulsan while the maximum value was 48.8% (95% CI, 48.4%, 49.2%) in Jeju-si, Jeju-do. In the CHS, the median value of the age-standardized overweight prevalence for men was 28.5% (95% CI, 25.9%, 31.2%). The SD was 2.6%p. The minimum value was 22.1% (95% CI, 19.8%, 24.4%) in Boseong-gun, Jeollanam-do, and the maximum value was 37.2% (95% CI, 35.5%, 38.8%) in Seogwipo-si, Jeju-do. For women, the median value of the age-standardized prevalence of overweight based on the NHSD was 34.0% (95% CI, 32.9%, 35.1%), and the SD was 3.9%p. The minimum value was 22.1% (95% CI, 21.9%, 22.4%) in Seocho-gu, Seoul while the maximum value was 44.6% (95% CI, 43.2%, 46.1%) in Yanggu-gun, Gangwon-do. In the CHS, the median value of the age-standardized overweight prevalence for women was 22.2% (95% CI, 20.1%, 24.4%). The SD was 2.9%p. The minimum value was 12.6% (95% CI, 10.9%, 14.2%) in Bundang-gu, Seongnam-si, Gyeonggi-do, and the maximum value was 30.8% (95% CI, 28.3%, 33.3%) in Jeongseon-gun, Gangwon-do. In both databases, the median value of the age-standardized overweight prevalence tended to increase with higher district-level income levels in men, but decreased in women.
Table 3
Distribution of overall age-standardized overweight prevalences, overweight prevalences by income quintiles and interquintile income gaps in overweight prevalence, findings for 245 local districts using the NHSD and the CHS in Korea, 2009–2014
NHSD = National Health Screening Database, CHS = Community Health Survey, SD = standard deviation, IQR = interquartile range.
![]()
Table 3 also shows the distribution of district-level interquintile income gaps in overweight prevalence in both databases. In men, the median value of the district-level interquintile income gaps in overweight prevalence from the NHSD was −3.9%p (95% CI, −6.3%p, −1.5%p) and the SD was 1.5%p. The minimum value was −7.9%p (95% CI, −9.7%p, −6.1%p) in Okcheon-gun, Chungcheongbuk-do while the maximum value was 2.2%p (95% CI, 0.3%p, 4.1%p) in Gwacheon-si, Gyeonggi-do. In the CHS, the median value of the district-level interquintile income gaps in overweight prevalence for men was −5.7%p (95% CI, −12.5%p, 1.1%p), and the SD was 4.3%p. The minimum value was −18.2%p (95% CI, −24.6%p, −11.8%p) in Yeongdeok-gun, Gyeongsangbuk-do. The maximum value was 7.9%p (95% CI, 1.5%p, 14.3%p) in Dong-gu, Ulsan. In women, the median value of the district-level interquintile income gaps in overweight prevalence based on the NHSD was 4.0%p (95% CI, 3.2%p, 4.8%p) and the SD was 1.6%p. The minimum value was 0.4%p (95% CI, −1.5%p, 2.3%p) in Jung-gu, Busan while the maximum value was 8.9%p (95% CI, 7.9%p, 9.9%p) from districts including Yongsan-gu, Seoul. In the CHS, the median value of the district-level interquintile income gaps in overweight prevalence for women was 4.9%p (95% CI, −1.7%p, 11.5%p) and the SD was 3.7%p. The minimum value was −8.3%p (95% CI, −14.6%p, −2.0%p) in Dangjin-si, Chungcheongnam-do. The maximum value was 14.4%p (95% CI, 8.2%p, 20.6%p) in Jung-gu, Seoul. Supplementary Tables 2 and 3 show the district-level age-standardized overweight prevalence and its interquintile income gaps based on the NHSD and the CHS. In men, the districts where the district-level income gap in overweight prevalence was less than 0.0%p are 243 si, gun, and gu in the NHSD while those in the CHS were 223 si, gun, and gu. Considering the 95% CI for the district-level income gap in overweight prevalence, the upper limit of the 95% CI was less than 0.0%p in 232 districts in the NHSD and 97 districts in the CHS. In women, the districts where the district-level income gaps in overweight prevalence was over 0.0%p are all 245 si, gun, and gu in the NHSD while those in the CHS were 224 si, gun, and gu. When we considered the 95% CI, the district-level income gap in overweight prevalence was significantly greater than 0.0%p in 233 districts in the NHSD and 106 districts in the CHS.
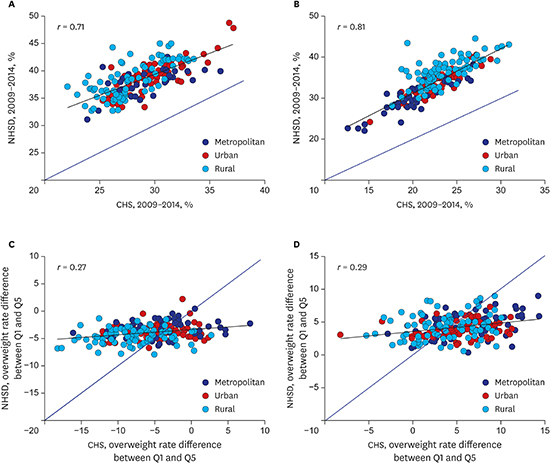
Fig. 3A and B show the age-standardized overweight prevalence in 245 si, gun, and gu based on the NHSD and the CHS for men and women. The correlation in overweight prevalence from the two databases was quite high in both genders: the correlation coefficient (r) was 0.71 in men and 0.81 in women. The age-standardized prevalence of overweight was higher in the NHSD than in the CHS in 245 all si, gun, and gu, regardless of gender. Fig. 3C and D illustrate the income gaps in overweight prevalence in 245 si, gun, and gu based on both databases for both genders. The correlation coefficient was relatively low in both men and women: 0.27 in men and 0.29 in women. The district-level variations in income gaps in overweight prevalence were much smaller in the NHSD compared to the CHS.
 | Fig. 3Scatter plots (and correlation coefficients [r]) for correlations of district-level age-standardized overweight prevalences and their interquintile income differences from the NHSD and the CHS among the 245 local districts in Korea, 2009–2014. (A) Correlations of overweight prevalences in men. (B) Correlations of overweight prevalences in women. (C) Correlations of interquintile income differences in men. (D) Correlations of interquintile income differences in women.
NHSD = National Health Screening Database, CHS = Community Health Survey, Q1 = Lowest income quintile, Q5 = Highest income quintile.
|
DISCUSSION
In this study, we compared the district-level age-standardized overweight prevalence and its interquintile income gap in 245 si, gun, and gu of Korea using the NHSD and the CHS. The age-adjusted mean BMI using the NHSD was not significantly different from the value using the KNHANES, which measures body weight and height of participants with well-trained examiners according to standardized protocols, while the age-adjusted mean BMI based on the CHS was lower than the value based on the NHSD and the KNHANES. The between-period correlations of district-level age-adjusted mean BMI and age-standardized overweight prevalence using the NHSD were greater than that using the CHS. For both men and women, strong correlations of district-level age-standardized overweight prevalence between the NHSD and the CHS were observed. However, the overweight prevalence from the CHS were lower than that from the NHSD in all 245 si, gun, and gu of Korea. The variations in interquintile income gap in overweight prevalence at the district level were much smaller in the NHSD compared to the CHS. Moreover, the district-level income gaps in overweight prevalence in both men and women were clearer when using the NHSD than when using the CHS.
The study results showed that the age-adjusted mean BMI from the NHSD (measured data) and the KNHANES (measured data) was similar while the age-adjusted mean BMI from the CHS (self-reported) was lower than that from the two other databases. The study results are consistent with previous studies comparing self-reported BMI and measured BMI. Hill and Roberts23 reported the value of self-reported BMI was significantly lower than that of measured BMI. McAdams et al.24 reported the difference between self-reported BMI and measured BMI was due to under-reporting body weight and over-reporting height as similarly presented in Supplementary Table 1. Sharples et al.25 investigated the agreement between self-reported and measured BMI in middle-aged New Zealanders, they found that the discrepancy was due to overestimated height, not by misestimated weight. A prior study revealed that the elderly tended to underreport their height because of osteoporosis, poor health status or lack of cognition.26 Our results showed that the difference in age-adjusted mean height between the CHS and the other two databases was greater than the difference in age-adjusted mean weight in both genders. In addition, there was no district where the age-standardized overweight prevalence was lower in the NHSD than in the CHS. According to a prior Korean study comparing the difference in obesity and overweight based on the CHS and the KNHANES, the obesity and overweight prevalence for both gender combined in the CHS were 8.6%p and 7.8%p lower than those from the KNHANES, respectively.27 Nonetheless, our results showed that the correlation coefficients of district-level age-standardized overweight prevalence based on the NHSD and the CHS were relatively high, 0.71 for men and 0.81 for women, indicating that the age-standardized overweight prevalence from the two databases had a similar tendency at the district level.
In this study, the between-period correlation of district-level age-standardized overweight prevalence and age-adjusted BMI were greater in the NHSD than in the CHS. The between-period correlation coefficients of district-level age-standardized overweight prevalence for both genders ranged between 0.94–0.98 in the NHSD, which were higher than 0.59–0.71 in the CHS. The correlation coefficients of age-adjusted mean BMI across periods were also higher in the NHSD compared to the CHS, in both genders. The extent of fluctuation in the prevalence of overweight and age-adjusted mean BMI over time is mostly due to the differences in the sample size of each district between the two databases. In the NHSD in 2013–2014, the median sample size for a district was 46,521 with a range of 3,223–171,619 in the NHSD. By contrast, the median sample size for a district was 1,234 with a range of 974–3,753 in the CHS. Because of the relatively large sample size for a district, stochastic variations in measuring the district-level overweight prevalence were lowered in the NHSD than in the CHS. Thus, the district-level overweight prevalence in the NHSD was calculated relatively reliable over time.
According to our results, the district-level variations in income gap in overweight prevalence were much smaller in the NHSD compared to the CHS. In addition, the district-level income gaps in overweight prevalence between the lowest 20% and highest 20% of income levels were more evident in the NHSD than in the CHS. In men, the upper bounds of the 95% CI for the district-level income gap in overweight prevalence were less than 0%p in 232 si, gun, and gu in the NHSD and in 97 si, gun, and gu in the CHS. In women, the lower bounds of the 95% CI for the district-level income gap in overweight prevalence were over 0%p in 233 si, gun, and gu and 106 si, gun, and gu in the CHS. Prior Korean studies presented that the overweight inequality differed by different socioeconomic position indicators and gender.42829 However, the pro-rich income inequality in overweight for women has been consistently reported.429 According to prior studies, the socioeconomic gap in dietary and physical activity behaviors existed, but no apparent gender differences were found in the association of socioeconomic position with these health behaviors.30313233 In addition, Ball et al.34 reported that current health behaviors only partially explained the differences in BMI according to socioeconomic position. Overweight and obesity are considered to be related to childhood factors, especially in women. The developmental course of the BMI trajectory was reportedly determined between the ages of 1 and 4 years, and that the direction was consistent after 4 years of age.35 Khlat et al.36 found that obesity was associated with early hardship only in women. Chapman et al.37 also reported that socioeconomic position in childhood was associated with adult obesity only in women after controlling socioeconomic position in adulthood. Our results indicate that the large sample size in the NHSD enables the reliable estimation of the district-level interquintile income gap in overweight prevalence. Furthermore, as the previous study also suggested with the same statistical analysis method,11 when using the CHS, several rounds of data need to be combined for calculating the income gap in overweight prevalence at the level of district. On the contrary, when using the NHSD, the district-level interquintile income gap associated with overweight prevalence can be calculated using only two-year data considering the overrepresentation of certain subpopulations. These features of the NHSD revealed through our results would be an important constituent in reliable surveillance of district-level income gap in overweight prevalence.
This study has limitations. First, the method of measuring income level was not exactly the same between the NHSD and the CHS. In the NHSD, national health insurance premium data, which was calculated by using personal income and property information, were utilized to calculate the district-level income quintiles. In the CHS, however, the income quintiles were calculated using the participant's self-reported monthly or yearly household income information. In addition, unlike 2009–2013, monthly household income information of 2014 was collected as a categorical variable in CHS. Second, we treated the NHSD data for two years as a single period of data to prevent overrepresentation of specific subpopulations, such as employees in non-office work. Therefore, the district-level income gap in overweight prevalence in each calendar year could not be estimated. Third, we analyzed data from participants aged 40 or older only due to the different age limit criteria for the participation in national health screening programs in Korea.
Despite these limitations, this study has important implications for the first demonstration of the usefulness of NHSD in monitoring district-level income gap in overweight prevalence in Korea. According to our results, NHSD should be considered a useful data source to validly and reliably measure the district-level overweight inequality. NHSD should therefore be used to provide evidence of policies to achieve health equity associated with overweight at the district level and to monitor the magnitude of district-level overweight prevalence and its inequality. Although CHS is also an important data source that can be used to monitor variable health indicators in Korea, an increase in sample size is needed to more reliably measure magnitude of health inequality at the district level. Further research on health inequality within each si, gun, and gu in Korea using NHSD should be actively conducted.
 XML Download