

 PDF
PDF Citation
 Print
Print


INTRODUCTION
Non-communicable diseases (NCDs) related to mortality and morbidity are increasing, thereby causing a serious economic burden worldwide.12 Therefore, the importance of primary prevention of NCDs is being emphasized.123
Metabolic syndrome, which has a close relationship with NCDs, is associated with various risk factors for coronary heart disease (CHD) and cerebrovascular disease (CVD), such as central obesity, increased serum glucose level, dyslipidemia, and high blood pressure.4 Populations with metabolic syndrome have higher CHD or CVD mortality rates and higher CHD, CVD, and type II diabetes morbidity rates.56789 Furthermore, metabolic syndrome is also associated with many of the comorbidities of obesity, such as CVD, CHD, type II diabetes mellitus, and hypertension.5678910 Therefore, according to the Adult Treatment Panel (ATP), reducing obesity is recommended as the primary goal of intervention for metabolic syndrome.11
The World Health Organization (WHO) defines obesity as follows: body mass index (BMI) ≥ 30.0 kg/m2, waist circumference (WC) ≥ 102 cm for Caucasian men and ≥ 88 cm for Caucasian women,312 and WC ≥ 90 cm for Asian men and ≥ 80 cm for Asian women.13 In Korea, there has been a controversy about cut-points of obesity, however current obesity is defined as BMI ≥ 25.0 kg/m2 and WC ≥ 90 cm for men and ≥ 85 cm for women.1415
These definitions of obesity can be easily applied to the population. However, they do not reflect important factors for evaluating fatness, such as age-related changes in body composition or hormones that affect body weight over time.1617 Therefore, it may be more appropriate to apply the obesity indices differently depending on the age group. However, there is no published study that has evaluated the age group-specific trends and optimal cut-point changes in obesity parameters for primary prevention of NCDs. Therefore, this study aimed to identify the trends and cut-point changes in various obesity parameters according to age groups in the general Korean population considering metabolic syndrome.
METHODS
Data source and subjects
We used data from the National Health Insurance Service National Sample Cohort (NHIS-NSC) of Korea.18 These data were randomly selected from the representative population sample cohort of 1,025,340 participants, which comprised 2.2% of the entire eligible Korean population in 2002 and included the nationwide health examination, which is stratified by gender, age group, income status, and eligibility status. The cohort was followed-up until 2013 unless the eligibility of participants was disqualified because of death or emigration.
From the NHIS-NSC, the cohort from the latest 2 years in 2012 and 2013 was chosen for this study. Only recent data in 2013 were analyzed when the same participants were included in each year of the cohort. We extracted information regarding height, weight, WC, diastolic blood pressure, systolic blood pressure, fasting serum glucose level, serum triglyceride level, serum high-density lipoprotein (HDL) cholesterol level, and medical history of hypertension, diabetes, and dyslipidemia for each participant older than 19 years. Participants with none of these data available were excluded.
The total numbers of participants in 2012 and 2013 were 241,397 and 234,478, respectively. However, 88,192 subjects in the 2012 cohort who underwent consecutive health screenings during 2012 and 2013 were excluded. In addition, 1,628 participants who had no data available regarding anthropometry, blood pressure, blood test results, and medical history to evaluate metabolic syndrome were excluded. Furthermore, we excluded 6,650 subjects aged 80 years or older.
Definition of metabolic syndrome
The metabolic risk factors defined based on the modified National Cholesterol Education Program ATP III criteria,11 except WC, were as follows: triglyceride level ≥ 150 mg/dL (1.7 mM/L) or antidyslipidemic medication; HDL cholesterol level < 40 mg/dL (1.0 mM/L) for men and < 50 mg/dL (1.3 mM/L) for women or antidyslipidemic medication; blood pressure ≥ 130/85 mmHg or antihypertensive medication; and fasting glucose level ≥ 100 mg/dL (6.1 mM/L) or medication (oral agents or insulin).
Statistical analysis
The mean BMI, WC, and waist-to-height ratio (WtHR) values were calculated according to each age group with 10-year intervals and separated by sex. Optimal cut-points for obesity parameters were defined as values that predict two or more components of metabolic syndrome (except WC). We used the Youden index to estimate the optimal cut-points for each obesity parameter.19 The accuracy of the derived optimal cut-point was assessed by receiver-operating characteristic (ROC) curve analysis. Statistical analyses were performed using STATA software version 14.0 (Stata Corp., College Station, TX, USA).
RESULTS
Basic population characteristics
A total of 379,405 participants (193,653 men and 185,752 women) were included. As shown in Table 1, the mean values of anthropometric indices and the metabolic profiles including blood test results, systolic blood pressure, diastolic blood pressure, fasting blood glucose, and triglycerides for men were higher than those for women.
Table 1
Baseline characteristics of study population
All data are presented as number (%) or mean ± standard deviation.
BMI = body mass index, WC = waist circumference, WtHR = waist-to-height ratio, HDL = high-density lipoprotein.
![]()
A total of 128,430 subjects (33.9%) were obese according to the Korean BMI standard (Supplementary Table 1). Moreover, 80,619 subjects (21.2%) had central obesity according to the Korean WC standard (Supplementary Table 2).
Optimal cut-points of obesity indices considering metabolic syndrome
Estimated overall optimal cut-points for BMI, WC, and WtHR are shown in Table 2. These were 24.4 kg/m2, 85.0 cm, and 0.50 for men and 23.3 kg/m2, 76.0 cm, and 0.49 for women, respectively. The value of the area under the curve (AUC) was higher for women than for men, and the highest AUC value was 0.7653 for the WtHR value in women. Optimal cut-points and the AUC for BMI, WC, and WtHR to predict two or more components of metabolic syndrome according to age group are shown in Supplementary Table 3.
Table 2
Optimal cut-points of obesity indices to predict 2 or more components of metabolic syndrome

BMI = body mass index, WC = waist circumference, WtHR = waist-to-height ratio, AUC = area under the curve, CI = confidence interval.
![]()
Trends and cut-point changes for BMI according to age groups considering metabolic syndrome
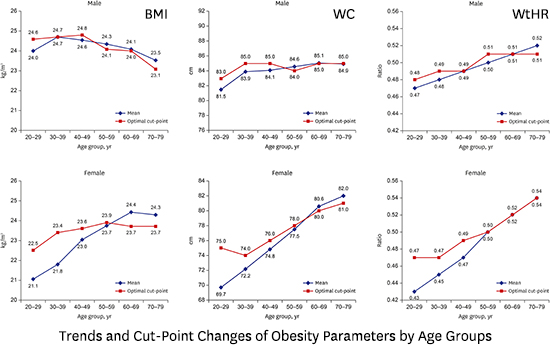
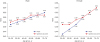
The changes in BMI are shown in Fig. 1. The mean values for men were between 23.5 and 24.7 kg/m2, and the values of the corresponding optimal cut-point were between 23.1 and 24.8 kg/m2. Each value showed a tendency to decrease as age increased.
For women, the mean values were distributed between 21.1 and 24.4 kg/m2 and the optimal cut-points were between 22.5 and 23.9 kg/m2. The mean value tended to increase with age; however, the optimal cut-point did not show a large difference across the ages.
Trends and cut-point changes for WC according to age groups considering metabolic syndrome
As shown in Fig. 2, the mean WC values for the men were between 81.5 and 85.1 cm. For those aged 20 to 69 years, the values increased with age but decreased after age 69 years. The optimal cut-point was found to be between 83.0 and 85.0 cm. For those in the 30–39, 40–49, 50–59, and 70–79 age groups, the optimal cut-point was 85.0 cm.
The mean WC values for women were between 69.7 and 82.0 cm, and they increased remarkably with an increase in age. The optimal cut-points were 74.0 to 81.0 cm, and they also increased with age, except for those in the 20–29 age bracket.
Trend and cut-point changes for WtHR according to age groups considering metabolic syndrome
Variations in WtHR are shown in Fig. 3. The mean WtHR values for men increased with age and ranged from 0.47 for those aged 20–29 to 0.52 for those aged 70–79 years. The optimal cut-points were 0.48 for those aged 20–29, 0.49 for those aged 30–39 and 40–49, and 0.51 for those aged 50–59, 60–69, and 70–79 years.
The mean WtHR values for women were 0.43 for those aged 20–29 years and 0.54 for those aged 70–79, and the value increased as age increased. The optimal cut-point was 0.47 for those aged 20–29 and 30–39, but the value increased from 0.47 for those aged 40–49 to 0.54 for those aged 70–79 years.
DISCUSSION
To our knowledge, this study is the first to assess the trends and related optimal cut-point changes for the various anthropometric parameters simultaneously according to age groups considering metabolic syndrome. The large sample size and the use of representative population cohort data support the generalizability of the results. Because we estimated the optimal cut-points for predicting two or more components of metabolic syndrome, the cut-points can be considered in relation to primary prevention of NCDs.
In the present study, the obesity indices showed that the optimal cut-point also changed with the change in the mean value. In Korea, the obese population is continuously increasing.20 Considering changes in mean values of the obesity parameters for the population, optimal cut-points also need to be revised according to the anthropometric changes. It may be more useful to evaluate obesity by using different age-specific cut-points for the primary prevention of metabolic syndrome.
Considering the AUC of each obesity parameter, WtHR was the most sensitive marker for predicting metabolic syndrome and BMI was the least sensitive marker. This finding is consistent with previous studies.21222324 WtHR can be a good surrogate marker for evaluating central obesity.2125
The overall obesity measurement was lower in Korea than in the West because of ethnicity differences.1314 Overweight status was defined as BMI 23 kg/m2 to < 25 kg/m2 according to the current obesity index in Korea.26 The ranges of calculated optimal cut-points of BMI for both men and women were nearly the range for overweight status. This result supports the current BMI cut-points to define obesity for NCD prevention in Korea. However, there are controversies regarding the optimal BMI cut-point.26
The trend of decreasing BMI with increasing age in men is due to the decrease in body weight as age increases. Comparing this with the WC results, it can be inferred that as age increases, body weight decreases due to the decrease in muscle mass; however, body fat increases.1416 This would have resulted in a reduction in the optimal cut-point of BMI according to aging, as shown in Fig. 1. This suggests that applying age-specific cut-points may be more effective than applying the same criteria for all ages when considering only BMI as a measurement of obesity for the primary prevention of metabolic syndrome in men.
Changes in the mean WC value for men increased from ages 20 to 69 years but decreased after age 69 years. However, the optimal cut-point was the same except for those aged 20–29 and 50–59 years. This result indicated lower values than the optimal cut-point for WC currently used in Korea.
For women, there was little change in the optimal cut-point relative to the change in the mean BMI value. Considering AUC and the remarkably increasing trend for WC in women, BMI is less sensitive than WC for reflecting central obesity. The average value and optimal cut-point for WC had the same trend: they increased as age increased, except for those aged 20–29 years. For women, the effects of hormones caused by birth and menopause should be considered; in addition, WC, which reflects central obesity, showed a tendency to increase significantly with age compared to that of men due to the effects of hormone changes in women.1727 In addition, similar trends in WtHR can be explained by hormonal changes in women. Therefore, it may be necessary to use WC (age-specific) as the central obesity standard for women.
There were some limitations to this study. First, participants in this cohort may be relatively healthy because data collection through national health screening may not be included if subjects are hospitalized and treated. This may have caused the optimal cut-point of BMI or WC to be lower than that currently applied. However, because the proportion of the population of inpatients is not large, these limitations did not seem to have a significant effect on the results of this study in regard to the primary prevention of metabolic syndrome. Second, diseases that could affect central obesity, including cancers, were not considered in the model. Therefore, our results may be interpreted to represent the overall population regardless of concurrent diseases. Third, because we used metabolic syndrome as a key for cut-point estimation, the findings may be different from estimations using other markers, such as cardiovascular mortality.28 Therefore, various clinical outcomes should be considered to estimate optimal cut-point. However, the results are similar to those of previous studies performed in Korea.212629 Fourth, as mentioned earlier, this study focused on the age- and sex-specific obesity cut-points for primary prevention. Thus, calculated cut-points of various obesity parameters do not reflect the obesity paradox,3031 or mortality due to obesity itself.32 Therefore, further study is required. Finally, because we used the cross-sectional data of each age group, the anthropometric changes of each subject were not directly assessed. The trend of obesity parameters according to each subject's age could be different from our results. Therefore, a population-based cohort study is necessary to elucidate the age-specific optimal cut-points of anthropometric indices throughout one's life.
In conclusion, we estimated the trends and cut-point changes in various obesity parameters according to age groups for primary prevention of NCDs. The trends of optimal cut-points according to age groups were similar to those of the mean values of anthropometric indices. Considering the continuous increase of obesity in the population, sex-specific and age group-specific cut-points for obesity should be considered, especially for the more sensitive markers WC and WtHR.
 XML Download