Journal List > J Korean Med Sci > v.33(8) > 1107712

Shin, Lee, Jeon, and Kim: Diabetes, Frequency of Exercise, and Mortality Over 12 Years: Analysis of the National Health Insurance Service-Health Screening (NHIS-HEALS) Database

Abstract

Background

The goal of this study was to analyze the relationship between exercise frequency and all-cause mortality for individuals diagnosed with and without diabetes mellitus (DM).

Methods

We analyzed data for 505,677 participants (53.9% men) in the National Health Insurance Service-National Health Screening (NHIS-HEALS) cohort. The study endpoint variable was all-cause mortality.

Results

Frequency of exercise and covariates including age, sex, smoking status, household income, blood pressure, fasting glucose, body mass index, total cholesterol, and Charlson comorbidity index were determined at baseline. Cox proportional hazard regression models were developed to assess the effects of exercise frequency (0, 1–2, 3–4, 5–6, and 7 days per week) on mortality, separately in individuals with and without DM. We found a U-shaped association between exercise frequency and mortality in individuals with and without DM. However, the frequency of exercise associated with the lowest risk of all-cause mortality was 3–4 times per week (hazard ratio [HR], 0.69; 95% confidence interval [CI], 0.65–0.73) in individuals without DM, and 5–6 times per week in those with DM (HR, 0.93; 95% CI, 0.78–1.10).

Conclusion

A moderate frequency of exercise may reduce mortality regardless of the presence or absence of DM; however, when compared to those without the condition, people with DM may need to exercise more often.

Graphical Abstract

jkms-33-e60-abf001

INTRODUCTION

Diabetes mellitus (DM) is one of the most common chronic diseases worldwide.1 In the UK, the number of people who had DM was found to be 3.1 million in 20111; and in Scotland, 9.6% of people were diagnosed with DM in 2008.2 The prevalence of diagnosed and undiagnosed DM was 8.6% and 0.9%, respectively.3 In the Japanese population in 1991, 1996, 2001, 2006, and 2011, the prevalence of DM increased among men (6.0%, 8.9%, 10.0%, 10.8%, and 12.0%) and women (3.3%, 4.5%, 4.2%, 4.1%, and 5.1%).4 In Korea, between 2002 and 2004, 29,787 of 1,025,340 people (15,625 men and 14,162 women) were diagnosed with DM. In Korea, the prevalence of DM increased from 8.6% in 2001 to 11.0% in 2013.56 People with DM showed significantly higher risk of mortality than those without DM.78 An inverse association of total mortality was identified for the overall physical activity level.91011 In a retrospective cohort study of Korean men, both regular physical activity and fitness were reported to be associated with lower mortality, but fitness was not associated with mortality among men who regularly engaged in physical activity.12
However, there are a few studies which examine the association between physical activity and mortality by comparing groups with and without DM. Therefore, we investigated the association between physical activity and mortality among people with and without DM by analyzing a large cohort data in Korea.

METHODS

Study participants

In this study, we analyzed data from the National Health Insurance Service-Health Screening (NHIS-HEALS) cohort from 2002 to 2013, which were released by the National Health Insurance Service (NHIS).13 The NHIS-HEALS cohort comprised a nationally representative random sample of 514,795 individuals, which accounted for 10% of the entire population who were aged between 40–79 years in 2002 and 2003. The NHIS-HEALS data were built by using probabilistic sampling to represent an individual defined by age, sex, eligibility status (employed or self-employed), and household income levels from Korean residents in 2002 and 2003. This database has eligibility and demographic information regarding health services as well as data on medical aid beneficiaries, medical bill details, medical treatment, medical history, and prescriptions. The participants were followed up for 12 years from 2002 to 2013. For this research, we excluded participants with missing data on DM status (yes/no) and body mass index (BMI, kg/m2) and those who died during the first 3 years of the follow-up period, leaving 505,677 participants for analysis.

Measurements

Frequency of exercise was determined at study entry with a questionnaire. Participants were requested to estimate the exercise frequency per week at baseline, and were classified as exercising on 0, 1–2, 3–4, 5–6, and 7 days per week. Within this study, DM was defined as either receiving diabetes treatment or having a fasting blood glucose greater than or equal to 126 mg/dL. Smoking, drinking, and medical history were assessed using a self-administered questionnaire at baseline. Based on the responses, the individuals were categorized as non-smoker, past smoker, and current smoker. Household income levels were divided into five groups as 0–2 (lowest level), 3–4, 5–6, 7–8, and 9–10 (highest level). We calculated BMI as weight in kilograms per square meter of height (kg/m2). Hypercholesterolemia was defined as total cholesterol > 240 mg/dL. Hypertension was identified by systolic blood pressure ≥ 140 mmHg, diastolic blood pressure ≥ 90 mmHg, or those taking antihypertensive medication. To control the effects of concomitant disorders, we used Charlson comorbidity index (CCI) which was originally developed to predict 1-year mortality using comorbidity data obtained from hospital chart review. We calculated CCI score using International Classification of Diseases, 10th revision (ICD-10) codes represent 17 conditions for each participant, under which scores 1, 2, 3, or 6 are determined according to severity of the condition.14 Information on death (date and cause of death) from Statistics Korea was individually linked using unique personal identification numbers.

Statistical analysis

Cox proportional hazard regression was used to compare the calculated hazard ratio (HR) of the group identified as having DM versus the group without DM. Continuous variables were age, BMI, total cholesterol, fasting glucose, systolic blood pressure, and diastolic blood pressure. Categorical variables were sex, frequency of exercise, household income, smoking, hypercholesterolemia, hypertension, and CCI. We studied three sequentially adjusted models for each result. Model 1 was used to estimate single effects of DM status and exercise frequency per week at baseline on the risk of mortality. For total mortality, model 2 was additionally adjusted for age and sex. In addition to age and sex, model 3 also adjusted for smoking, BMI, and CCI at baseline. We performed all statistical analyses using SAS software, version 9.4 (SAS Institute Inc., Cary, NC, USA) and, the results were considered significant if their P value was < 0.05.

Ethics statement

The study protocol was approved by the Yonsei University Health System, Severance Hospital, Institutional Review Board (IRB No. 4-2016-0496). Informed consent was waived by the board.

RESULTS

Among the 505,677 participants, 10.8% (n = 55,439) had DM at baseline and 89.2% (n = 50,238) did not have DM at baseline (Table 1). DM group tended to have lower household income, higher blood cholesterol, higher blood pressure, and more comorbidities than non-DM group. Baseline characteristics are also presented by sex in Supplementary Table 1. Men had higher fasting blood glucose and higher blood pressure, but lower blood cholesterol compared to women. Household income, exercise frequency, and smoking rate were also higher in men than in women.
Table 1

Baseline characteristics of the total study participants and by the presence of diabetes

jkms-33-e60-i001
Variables Total (n = 505,677) With diabetes (n = 55,439) Without diabetes (n = 450,238)
Age, yr 52.93 ± 9.64 56.52 ± 9.74 52.49 ± 9.53
BMI, kg/m2 24.01 ± 2.98 24.75 ± 3.12 23.92 ± 2.95
Total cholesterol, mg/dL 200.54 ± 38.66 205.66 ± 46.34 199.91 ± 37.56
FBS, mg/dL 98.70 ± 35.30 160.35 ± 76.16 91.11 ± 12.65
SBP, mmHg 127.12 ± 18.22 133.48 ± 18.85 126.34 ± 17.98
DBP, mmHg 79.64 ± 11.75 82.34 ± 11.75 79.31 ± 11.71
Sex
Male 273,040 (53.99) 34,403 (62.06) 238,637 (53.00)
Female 232,637 (46.01) 21,036 (37.94) 211,601 (47.00)
Household income
0–2 (lowest) 80,014 (15.82) 9,952 (17.95) 70,062 (15.56)
3–4 72,295 (14.30) 8,348 (15.06) 63,947 (14.20)
5–6 80,181 (15.86) 9,183 (16.56) 70,998 (15.77)
7–8 104,041 (20.57) 11,371 (20.51) 92,670 (20.58)
9–10 (highest) 169,146 (33.45) 16,585 (29.92) 152,561 (33.88)
Frequency of exercise, days per week
0 281,970 (57.49) 30,020 (55.62) 251,950 (57.72)
1–2 116,314 (23.72) 12,467 (23.10) 103,847 (23.79)
3–4 45,418 (9.26) 4,932 (9.14) 40,486 (9.28)
5–6 12,874 (2.62) 1,508 (2.79) 11,366 (2.60)
7 33,888 (6.91) 5,044 (9.35) 28,844 (6.61)
Smoking status
Non-smoker 325,610 (64.39) 33,264 (60.00) 292,346 (64.93)
Past smoker 64,215 (12.70) 7,347 (13.25) 56,868 (12.63)
Current smoker 115,852 (22.91) 14,828 (26.75) 101,024 (22.44)
Hypercholesterolemia
Total cholesterol ≥ 240 mg/dL 73,226 (14.48) 10,425 (18.80) 62,801 (13.95)
Hypertension
SBP/DBP ≥ 140/90 mmHg or medication 230,319 (45.55) 35,789 (64.56) 194,271 (43.15)
CCI
0 227,542 (46.82) 15,515 (27.99) 212,027 (47.09)
1 134,152 (27.60) 11,339 (20.45) 122,813 (27.28)
2 74,097 (15.25) 8,942 (16.13) 65,155 (14.47)
3 or more 50,243 (10.34) 19,643 (35.43) 69,886 (11.16)
Data presented as mean ± standard deviation or number (%).
BMI = body mass index, FBS = fasting blood sugar, SBP = systolic blood pressure, DBP = diastolic blood pressure, CCI = Charlson comorbidity index.
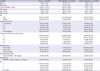
Table 2 describes the baseline characteristics of the participants according to frequency of exercise. Of these, 232,315 (57.50%) did not exercise at all. Number of people who did exercise, 1–2, 3–4, 5–6, and 7 days per week was 116,389 (23.71%), 45,447 (9.26%), 12,881 (2.62%), and 33,927 (6.91%), respectively. People with higher exercise frequency tended to be male, be older, and have higher household income.
Table 2

Baseline characteristics of study participants by the frequency of exercise

jkms-33-e60-i002
Variables Exercise frequency (days per week)
0 (n = 232,315) 1–2 (n = 116,389) 3–4 (n = 45,447) 5–6 (n = 12,881) 7 (n = 33,927)
Age, yr 53.84 ± 10.03 50.55 ± 8.38 51.07 ± 8.48 52.18 ± 8.94 56.36 ± 9.74
BMI, kg/m2 23.88 ± 3.07 24.15 ± 2.85 24.23 ± 2.77 24.24 ± 2.82 24.24 ± 2.89
Total cholesterol, mg/dL 200.21 ± 39.12 200.89 ± 37.80 201.06 ± 38.49 201.16 ± 38.09 200.63 ± 38.49
FBS, mg/dL 98.54 ± 35.83 98.87 ± 34.08 98.17 ± 34.27 98.87 ± 36.66 100.98 ± 37.97
SBP, mmHg 127.10 ± 18.57 126.80 ± 17.47 126.40 ± 17.51 126.88 ± 17.79 129.19 ± 18.69
DBP, mmHg 79.33 ± 11.80 80.14 ± 11.63 79.61 ± 11.58 79.56 ± 11.55 80.17 ± 11.82
Sex
Male 130,944 (46.38) 78,987 (67.86) 28,855 (63.49) 7,627 (59.21) 18,457 (54.40)
Female 151,371 (53.62) 37,402 (32.14) 16,592 (36.51) 5,254 (40.79) 15,470 (45.60)
Household income
0–2 (lowest) 50,847 (18.01) 15,237 (13.09) 5,210 (11.46) 1,415 (10.99) 4,992 (14.71)
3–4 46,955 (16.63) 13,022 (11.19) 4,430 (9.75) 1,305 (10.13) 4,713 (13.89)
5–6 48,779 (17.28) 16,527 (14.20) 5,713 (12.57) 1,693 (13.14) 5,332 (15.72)
7–8 58,237 (20.63) 23,973 (20.60) 8,986 (19.77) 2,610 (20.26) 7,081 (20.87)
9–10 (highest) 77,497 (27.45) 47,630 (40.92) 21,108 (46.45) 5,858 (45.48) 11,809 (34.81)
Smoking status
Non-smoker 195,835 (69.37) 64,691 (55.58) 27,844 (61.27) 8,070 (62.65) 23,606 (69.58)
Past smoker 24,298 (8.61) 17,522 (15.05) 7,246 (15.94) 2,377 (18.45) 3,901 (11.50)
Current smoker 62,182 (22.03) 34,176 (29.36) 10,357 (22.79) 2,434 (18.90) 6,420 (18.92)
Hypercholesterolemia
Total cholesterol ≥ 240 mg/dL 41,040 (14.54) 16,438 (14.12) 6,488 (14.28) 1,915 (14.87) 5,045 (14.87)
Hypertension
SBP/DBP ≥ 140/90 mmHg or medication 129,482 (14.54) 50,438 (14.12) 19,784 (14.28) 5,782 (14.87) 17,625 (14.87)
CCI
0 122,490 (43.39) 57,240 (49.18) 21,386 (47.06) 5,878 (45.63) 13,511 (39.82)
1 75,517 (26.75) 30,390 (26.11) 12,035 (26.48) 3,389 (26.31) 8,954 (26.39)
2 43,193 (15.30) 15,529 (13.34) 6,180 (13.60) 1,862 (14.46) 5,356 (15.79)
3 or more 41,115 (14.56) 13,230 (11.37) 5,846 (12.86) 1,752 (13.60) 6,106 (18.00)
Data presented as mean ± standard deviation or number (%).
BMI = body mass index, FBS = fasting blood sugar, SBP = systolic blood pressure, DBP = diastolic blood pressure, CCI = Charlson comorbidity index.
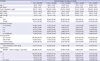
During the 12 years of follow-up, 31,264 deaths were observed. People with DM had significantly higher risk of mortality than those without DM. In addition, the HR for total mortality among participants according to frequency of exercise showed a U-shaped relationship. However, people who perform exercise at any frequency had significantly lower mortality, compared to those who did not exercise at all. The lowest HR for mortality was observed among people who exercise 3–4 times per week (Table 3). However, when we limited our analysis to people with DM, the lowest HR for mortality was observed at exercise frequency of 5–6 times per week (Table 4).
Table 3

Risk of total mortality according to diabetes and frequency of exercise

jkms-33-e60-i003
Risk factors No. of people No. of death HR (95% CI) for mortality
Model 1 Model 2 Model 3
Diabetes
No 450,238 24,341 1.00 (Reference) 1.00 (Reference) 1.00 (Reference)
Yes 55,439 6,923 2.38 (2.32–2.45) 1.62 (1.58–1.67) 1.49 (1.45–1.54)
Exercise frequency, days per week
0 282,315 20,407 1.00 (Reference) 1.00 (Reference) 1.00 (Reference)
1–2 116,389 4,735 0.55 (0.53–0.57) 0.75 (0.73–0.77) 0.79 (0.76–0.81)
3–4 45,447 1,771 0.53 (0.50–0.55) 0.68 (0.65–0.71) 0.72 (0.69–0.76)
5–6 12,881 641 0.68 (0.63–0.73) 0.77 (0.71–0.83) 0.82 (0.76–0.89)
7 33,927 2,838 1.17 (1.12–1.21) 0.86 (0.82–0.89) 0.90 (0.87–0.94)
Model 1 unadjusted; model 2 adjusted for age and sex; model 3 adjusted for age, sex, body mass index, smoking, and Charlson comorbidity index.
HR = hazard ratio, CI = confidence interval.
Table 4

Risk of total mortality according to frequency of exercise in people with known diabetes

jkms-33-e60-i004
Exercise frequency, days per week No. of people No. of death HR (95% CI) for mortality
Model 1 Model 2 Model 3
0 25,709 4,311 (14.36) 1.00 (Reference) 1.00 (Reference) 1.00 (Reference)
1–2 11,374 1,093 (8.77) 0.58 (0.55–0.63) 0.77 (0.72–0.82) 0.79 (0.74–0.85)
3–4 4,506 426 (8.64) 0.58 (0.53–0.64) 0.72 (0.65–0.79) 0.74 (0.67–0.81)
5–6 1,374 134 (8.89) 0.60 (0.50–0.71) 0.63 (0.52–0.75) 0.67 (0.56–0.79)
7 4,276 768 (15.23) 1.07 (0.99–1.15) 0.84 (0.78–0.91) 0.87 (0.80–0.94)
Model 1 unadjusted; model 2 adjusted for age and sex; model 3 adjusted for age, sex, body mass index, smoking, and Charlson comorbidity index.
HR = hazard ratio, CI = confidence interval.
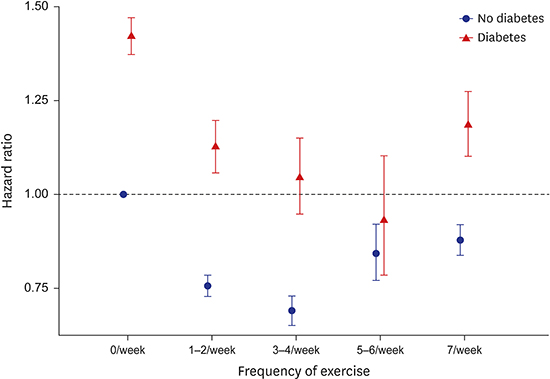
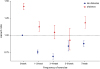
Fig. 1 shows mortality risk for 10 combined categories based on DM diagnosis and exercise frequency. The highest mortality was observed in people with DM and no exercise, and the lowest mortality was observed in people without DM and 3–4 exercises per week. The relationship between exercise frequency and mortality was found to be U-shaped in both diabetic and non-diabetic participants. However, the frequency of exercise with the lowest mortality rate varied depending on whether or not diabetes was present. The lowest relative mortality was observed among people who exercise 5–6 times per week (HR, 0.93) in the DM group, but among those who exercise 3–4 times per week (HR, 0.69) in the non-DM group.
Fig. 1
Combined effects of diabetes and frequency of exercise on total mortality. Hazard ratios were calculated using Cox proportional hazard regression models that adjusted for sex, age, hypertension, total cholesterol, smoking, and Charlson comorbidity index.
jkms-33-e60-g001

DISCUSSION

In this large and representative cohort study of the Korean population, we observed a joint association between frequency of exercise for all-cause mortality in adults with and without DM. When compared to participants without DM, those with DM had a higher risk of all-cause mortality.
It has been reported that regular exercise can decrease the risk of mortality in people without DM as well as in people with DM.815 The unique finding of this study is that the most beneficial frequency of exercise may differ for people with and without DM. In our study, the lowest mortality was observed for people exercising 5–6 days per week in DM group, but for people exercising 3–4 days per week in non-DM group. It is also notable that the people with DM who exercised 5–6 times per week showed lower mortality than those without DM who did not exercise. It implies that even if people have DM, they can enjoy a long lifespan through maintaining a proper lifestyle and medical treatment.
Our study is in line with previous studies which have reported a U-shaped relationship between physical activity and mortality.161718192021 Our study also showed U-shaped curves not only in the DM group but also in the non-DM group; these associations of exercise frequency with all-cause mortality compared to the reference group, who did not exercise, suggest that moderate frequency of exercise is indeed beneficial. The moderate physical activity for at least 150 minutes per week was related with significant decreased in all-cause mortality.22
Physically inactive adults are strongly recommended to increase their activity and to begin regular exercise. However, people who are already at high-activity levels do not need to reduce exercise frequency because of the risk of death.23 It is unclear why the mortality rate is higher for those who exercise seven days a week than those who exercise three to six days a week. Too much exercise can have a negative impact on health, although it is unlikely to be a major reason for the U-shaped effect of exercise frequency. Studies reported that activation of ref1/nrf2/antioxidant defense pathway may effect on preventing oxidative stress resistance during vigorous physical activity,24 and long-term strenuous exercise may lead to adverse impact on cardiovascular health.2526 Unmeasured or uncontrolled cofounders can be another explanation. In our study, 9.35% of people with DM and 6.61% of people without DM answered that they exercise 7 days a week. Only a small part of people did exercise every day, and they might be more worried about their health. A previous Korean study reported that people with DM had more regularly exercise than people without.27 In our study population, people who exercise every day were more likely to have poor baseline conditions such as lower household income and larger number of comorbidities. We attempted to control the effect of other mortality risk factors, but there is a possibility of residual confounding factors.
Several limitations of the present study warrant consideration. A major limitation of this study was the relatively crude assessment of our explanatory variable, which was solely based on self-reporting by the participants. The measure was further limited by relying on subjects' response on physical activity and not assessing type, duration, and intensity of physical activities. A more precise assessment of these factors may have resulted in a different contribution of these factors to the reduction in mortality. Second, the NHIS-HEALS cohort was a random sample of individuals who participated in the general health-screening program; thus, it represents screened individuals, but not unscreened ones. Third, when we analyzed the association frequency of exercise with total mortality, we could not control for disease severity because we did not have information about glycemic control. Lastly, the participants' exercise frequency can change during the study period, but we did not evaluate the effect of changes in exercise habit on mortality. Despite these limitations, this study has important advantages because it prospectively analyzed a large sample of Korean adults and observed mortality events over a long-term period.
In conclusion, we observed that moderate frequency of exercise may reduce mortality, but the optimal frequency of exercise may vary depending on the diagnosis of DM. Our results support the encouragement of more frequent exercise in people with DM than those without DM.

ACKNOWLEDGMENTS

This study used National Health Insurance Service-Health Screening (NHIS-HEALS) data (NHIS-2017-2-319) made by the National Health Insurance Service (NHIS) for which we acknowledged.

Notes

Funding This work was supported by a grant of the Korea Health Technology R & D Project through the Korea Health Industry Development Institute (KHIDI), funded by the Ministry of Health and Welfare, Republic of Korea (grant number: HI13C0715).

Disclosure The authors have no potential conflicts of interest to disclose.

Author Contributions

  • Conceptualization: Shin WY, Kim HC.

  • Data curation: Kim HC.

  • Formal analysis: Shin WY, Lee T.

  • Funding acquisition: Kim HC.

  • Investigation: Shin WY, Lee T, Jeon DH.

  • Writing - original draft: Shin WY.

  • Writing - review & editing: Shin WY, Lee T, Jeon DH, Kim HC.

References

1. Shaw JE, Sicree RA, Zimmet PZ. Global estimates of the prevalence of diabetes for 2010 and 2030. Diabetes Res Clin Pract. 2010; 87(1):4–14.
crossref
2. Hamer M, Kengne AP, Batty GD, Cooke D, Stamatakis E. Temporal trends in diabetes prevalence and key diabetes risk factors in Scotland, 2003–2008. Diabet Med. 2011; 28(5):595–598.
crossref
3. Leahy S, O'Halloran AM, O'Leary N, Healy M, McCormack M, Kenny RA, et al. Prevalence and correlates of diagnosed and undiagnosed type 2 diabetes mellitus and pre-diabetes in older adults: findings from the Irish Longitudinal Study on Ageing (TILDA). Diabetes Res Clin Pract. 2015; 110(3):241–249.
4. Imamura Y, Uto H, Hiramine Y, Hosoyamada K, Ijuin S, Yoshifuku S, et al. Increasing prevalence of diabetes mellitus in association with fatty liver in a Japanese population. J Gastroenterol. 2014; 49(10):1406–1413.
crossref
5. Kang YM, Kim YJ, Park JY, Lee WJ, Jung CH. Mortality and causes of death in a national sample of type 2 diabetic patients in Korea from 2002 to 2013. Cardiovasc Diabetol. 2016; 15(1):131.
crossref
6. Ha KH, Kim DJ. Trends in the diabetes epidemic in Korea. Endocrinol Metab (Seoul). 2015; 30(2):142–146.
crossref
7. Schofield CJ, Libby G, Brennan GM, MacAlpine RR, Morris AD, Leese GP, et al. Mortality and hospitalization in patients after amputation: a comparison between patients with and without diabetes. Diabetes Care. 2006; 29(10):2252–2256.
crossref
8. Sluik D, Boeing H, Li K, Kaaks R, Johnsen NF, Tjønneland A, et al. Lifestyle factors and mortality risk in individuals with diabetes mellitus: are the associations different from those in individuals without diabetes? Diabetologia. 2014; 57(1):63–72.
crossref
9. Sadarangani KP, Hamer M, Mindell JS, Coombs NA, Stamatakis E. Physical activity and risk of all-cause and cardiovascular disease mortality in diabetic adults from Great Britain: pooled analysis of 10 population-based cohorts. Diabetes Care. 2014; 37(4):1016–1023.
crossref
10. Trichopoulou A, Psaltopoulou T, Orfanos P, Trichopoulos D. Diet and physical activity in relation to overall mortality amongst adult diabetics in a general population cohort. J Intern Med. 2006; 259(6):583–591.
crossref
11. Blomster JI, Chow CK, Zoungas S, Woodward M, Patel A, Poulter NR, et al. The influence of physical activity on vascular complications and mortality in patients with type 2 diabetes mellitus. Diabetes Obes Metab. 2013; 15(11):1008–1012.
crossref
12. Park MS, Chung SY, Chang Y, Kim K. Physical activity and physical fitness as predictors of all-cause mortality in Korean men. J Korean Med Sci. 2009; 24(1):13–19.
crossref
13. Seong SC, Kim YY, Park SK, Khang YH, Kim HC, Park JH, et al. Cohort profile: the National Health Insurance Service-National Health Screening Cohort (NHIS-HEALS) in Korea. BMJ Open. 2017; 7(9):e016640.
crossref
14. Quan H, Li B, Couris CM, Fushimi K, Graham P, Hider P, et al. Updating and validating the Charlson comorbidity index and score for risk adjustment in hospital discharge abstracts using data from 6 countries. Am J Epidemiol. 2011; 173(6):676–682.
15. Jonker JT, De Laet C, Franco OH, Peeters A, Mackenbach J, Nusselder WJ. Physical activity and life expectancy with and without diabetes: life table analysis of the Framingham Heart Study. Diabetes Care. 2006; 29(1):38–43.
crossref
16. Hayasaka S, Shibata Y, Ishikawa S, Kayaba K, Gotoh T, Noda T, et al. Physical activity and all-cause mortality in Japan: the Jichi Medical School (JMS) Cohort Study. J Epidemiol. 2009; 19(1):24–27.
crossref
17. Andersen LB, Schnohr P, Schroll M, Hein HO. All-cause mortality associated with physical activity during leisure time, work, sports, and cycling to work. Arch Intern Med. 2000; 160(11):1621–1628.
crossref
18. Sherman SE, D'Agostino RB, Cobb JL, Kannel WB. Physical activity and mortality in women in the Framingham Heart Study. Am Heart J. 1994; 128(5):879–884.
crossref
19. Blair SN, Kohl HW 3rd, Paffenbarger RS Jr, Clark DG, Cooper KH, Gibbons LW. Physical fitness and all-cause mortality. A prospective study of healthy men and women. JAMA. 1989; 262(17):2395–2401.
crossref
20. Lee IM, Paffenbarger RS Jr. Associations of light, moderate, and vigorous intensity physical activity with longevity. The Harvard Alumni Health Study. Am J Epidemiol. 2000; 151(3):293–299.
crossref
21. Paffenbarger RS Jr, Hyde RT, Wing AL, Hsieh CC. Physical activity, all-cause mortality, and longevity of college alumni. N Engl J Med. 1986; 314(10):605–613.
crossref
22. Joseph C, Conradsson D, Hagströmer M, Lawal I, Rhoda A. Objectively assessed physical activity and associated factors of sedentary behavior among survivors of stroke living in Cape Town, South Africa. Disabil Rehabil. Forthcoming. 2017.
crossref
23. Arem H, Moore SC, Patel A, Hartge P, Berrington de Gonzalez A, Visvanathan K, et al. Leisure time physical activity and mortality: a detailed pooled analysis of the dose-response relationship. JAMA Intern Med. 2015; 175(6):959–967.
24. Wang P, Li CG, Qi Z, Cui D, Ding S. Acute exercise stress promotes Ref1/Nrf2 signalling and increases mitochondrial antioxidant activity in skeletal muscle. Exp Physiol. 2016; 101(3):410–420.
crossref
25. Schnohr P, O'Keefe JH, Marott JL, Lange P, Jensen GB. Dose of jogging and long-term mortality: the Copenhagen City Heart Study. J Am Coll Cardiol. 2015; 65(5):411–419.
26. Thompson PD, Franklin BA, Balady GJ, Blair SN, Corrado D, Estes NA 3rd, et al. Exercise and acute cardiovascular events placing the risks into perspective: a scientific statement from the American Heart Association Council on Nutrition, Physical Activity, and Metabolism and the Council on Clinical Cardiology. Circulation. 2007; 115(17):2358–2368.
27. Min KW, An KH, Sohn TS, Park YM, Hong YS, Kim YS, et al. The study of physical activity in the Korean with type 2 diabetes. J Korean Diabetes Assoc. 2005; 29:517–525.

SUPPLEMENTARY MATERIAL

Supplementary Table 1

Baseline characteristics of participants by sex
TOOLS
ORCID iDs

Woo Young Shin
https://orcid.org/0000-0002-3598-5925

Taehee Lee
https://orcid.org/0000-0001-9577-6159

Da-Hye Jeon
https://orcid.org/0000-0002-7913-8357

Hyeon Chang Kim
https://orcid.org/0000-0001-7867-1240

Similar articles