

 PDF
PDF Citation
 Print
Print


INTRODUCTION
Cigarette smoking is known as a crucial risk factor that causes inequalities in health outcomes. A prior UK study showed that smoking was the most important risk factor that contributes to socioeconomic inequality in mortality from coronary heart disease.1 A Korean study also have reported that the eradication of cigarette smoking would reduce absolute income gaps in all-cause mortality by 30%–40%.2 In addition, behavioral factors including cigarette smoking, alcohol consumption and physical activity explained 16.4% of relative inequality and 84.0% of absolute inequality in all-cause mortality.3 Smoking prevalence is higher in lower socioeconomic groups. Prior studies in Korea have shown that in both men and women, the inequalities in smoking prevalence exist according to education, occupation, and income.45678 The extent of this inequality was found to be even greater in younger age groups.9
Achieving equity in smoking prevalence is one of the most important goals of Korean national public health policy. Reducing inequality in smoking prevalence across different income levels was first established as a goal in the Health Plan 2010 established in 2005.10 The subsequently released Third National Health Plan 2020 (2011–2020) and the recent Fourth National Health Plan 2020 (2016–2020) also included the reduction of gaps in smoking prevalence by geographical area and income as a goal.1112 Policies and intervention programs to reduce inequality in smoking prevalence need to be carried out not only by the central government, but also by local governments at the district-level. To that end, data on the income gap in smoking prevalence in local districts (si, gun, and gu) are needed.13
Since 2008, the Korea Centers for Disease Control and Prevention have implemented the Community Health Survey (CHS) to measure health status and health behaviors in si, gun, and gu. This survey has enabled various health indicators and health behaviors to be measured at the district-level. However, to measure health gaps associated with socioeconomic position in a district, the sample sizes must be sufficiently large. This necessitates combining several rounds of CHS data.13 According to a prior study examining income gap in smoking prevalence at the district-level by combining CHS data for 7 years (2008–2014), there were some districts where the smoking prevalence for lowest 20% of income levels were lower than the smoking prevalence for highest 20% of income levels.13 Considering that previous studies on the income gap in smoking prevalence in Korea have consistently reported pro-rich inequalities in smoking prevalence,24569 the relatively low smoking prevalence found in low-income level in some districts is likely due to small sample sizes in the CHS.
Besides the CHS, another Korean database that could be used to demonstrate income gaps in smoking prevalence at the si, gun, and gu level is the National Health Screening Database (NHSD) formed by the National Health Insurance Service (NHIS).14 This database is based on general health screening data and transitional age health screening data obtained from the self-employed insured, insured employees, and their dependents. The NHSD includes self-reported health behaviors such as cigarette smoking and alcohol consumption assessed via a questionnaire, information from anthropometric examination such as height and body weight, and blood test and urine analysis. The sample of the 2014 NHSD was 17,379,951 individuals.14 Health insurance premium levels, which can be used as a proxy for income, can be computed based on the National Health Information Database (NHID) eligibility database.14 However, it has not yet been established whether it is possible to monitor smoking prevalence and the magnitude of inequality in smoking in si, gun, and gu using the NHSD.
A good health-related indicator should have high validity and reliability. In monitoring of specific indicators over time, good reliability (or reproducibility) is of the highest importance. In this study, to monitor smoking prevalence and income-related inequality in smoking prevalence in si, gun, and gu, we aimed to identify whether the NHSD could be used, and therefore conducted the following analyses. First, we divided the study period between 2009 and 2014 into three periods and compared the magnitudes of between-period correlations of district-level smoking prevalence based on the NHSD and CHS. Second, we compared the smoking prevalence and the extents of income gap in smoking prevalence in si, gun, and gu, using the NHSD and CHS.
METHODS
Data
Data were obtained from the NHSD, which consists of general health screening data and transitional age health screening data, and the CHS from 2009–2014. The NHIS annually conducts general health screening program and transitional age health screening program for the self-employed insured, insured employees and their dependents. In the case of general health screening program, the heads of household and the household members aged 40 years or older are eligible for a biennial health examination. For insured employees, employees in non-office work are eligible for general health screening once a year while employees in office work are eligible for general health screening every two years, regardless of age. Dependents of insured employees aged 40 years or older are eligible for a biennial health examination. Among subjects for general health screening program, those aged 40 and 66 are entitled to transitional age health screening program.14
As a result, when using annual data from the NHSD, particular subpopulations such as employees in non-office work or subjects for transitional age health screening program are overrepresented. Dependents of insured employees aged less than 40 years and household members who are not household heads under 40 years of age are not eligible for health screening programs. All health insurance subscribers aged 40 years or older are eligible for health screening programs at least once every two years. Considering these eligibility criteria for health screening in Korea, we have reconstructed the two-year NHSD into one study period to secure the representativeness of data as follows. First, we have limited the study subjects to those aged 40 years or older because certain subpopulations are not eligible for health screening programs. Second, for the subjects who participated in the health screening programs twice during the two-year period, we used information on the smoking status, districts, and age from the most recent year while national health insurance premium level was calculated as the average of the two years. In this study, we analyzed 39,049,485 individuals (18,882,425 men and 20,167,060 women) aged 40 years or older in the NHSD for 2009–2014.
CHS is a nationwide, community-based survey conducted annually on approximately 900 residents aged 19 years or older, who have been sampled using stratified cluster sampling methods. Other details about CHS have been described elsewhere.13 This study utilized 989,292 participants (443,570 men and 545,722 women) aged 40 years or older in the CHS from 2009 to 2014.
Reclassification of si, gun, and gu
In this study, we reclassified the 252 si, gun, and gu according to the 2015 governmental administrative classification into 245 units of analysis in the same manner as described elsewhere,13 taking into account changes in local administrative district over the study period.
Cigarette smoking
Information on cigarette smoking was obtained in response to a question about current smoking status. In the NHSD, current smokers were defined as respondents who answered “yes, currently smoking” to the question “have you ever smoked 5 packs or more of cigarettes in the course of your lifetime?” In the CHS, respondents who smoked five or more packs (100 or more cigarettes) in their lifetime and answered “yes” in 2008 or “smokes daily,” “occasionally smokes” in 2009 and beyond for the question “do you smoke currently?” were defined as the current smokers.
Income
In the NHSD, income data was calculated from national health insurance premiums level at the end of the year (December 31) by linking with the NHID eligibility database. In case year-end health insurance premium information was not available, we used health insurance premium levels in the most recent month. The number of population from NHID was very close to the number of population from Korean Statistical Information Service (KOSIS). In addition, because the concordance correlation coefficient of mortality rate between NHID and KOSIS was over 0.995, NHID is supposed to be sufficient to measure the health status at the district-level.15 In spite of different methods of calculating national health insurance premium levels between the self-employed insured and insured employees, prior studies have shown that national health insurance premium level can be used as an appropriate proxy for income level when measuring health gap.1617 In this study, we used the equivalized health insurance premium levels of the NHID eligibility database when calculating the income quintiles. The equation is shown below.

In the CHS, equivalized household income, self-reported annual or monthly household income adjusted by numbers of household members, was used to calculate the income quintiles. Details of income data for CHS have been described elsewhere.13
Statistical analysis
In this study, we have treated two-year NHSD data into data for a single period, combining data for 2009–2010, 2011–2012, and 2013–2014. In a recent international collaborative study, two years of NHSD were combined into a single period of data as well.18 After merging two years of data into a single period, we calculated the income quintiles at the nearest quintile points in equivalized health insurance premiums according to gender, 245 si, gun, and gu, and 5-year age groups.
We estimated the age-standardized smoking prevalence and its interquintile income gap for each study period with similar method as described elsewhere.13 In addition, after combining the NHSD for six years (2009–2014), we calculated overall age-standardized smoking prevalence, age-standardized smoking prevalence by income quintiles and interquintile income gap in smoking prevalence according to gender and district.
The age-standardized smoking prevalence and its interquintile income gap based on three periods (2009–2010, 2011–2012, and 2013–2014) and six years of data for 2009–2014 were also calculated for CHS. The methods for calculating income quintiles in CHS have been described in detail elsewhere.13 Age-standardized smoking prevalence and its interquintile income gap were estimated in the same manner as the NHSD. When calculating age-standardized prevalence of the two databases, 2010 mid-year resident population in Korea was used as the standard population.
We conducted correlation analyses of the age-standardized smoking prevalence for three periods based on the two databases. We also performed correlation analyses and linear regressions of age-standardized smoking prevalence and interquintile income gaps using two databases in 2009–2014 and estimated Pearson's correlation coefficients, concordance correlation coefficients, and regression coefficients. Analyses were performed in SAS 9.4 (SAS Institute, Cary, NC, USA).
RESULTS
Table 1 shows the characteristics of the study subjects. Among the total 39,049,485 subjects of NHSD from 2009 to 2014, 18,882,425 were men (48.4%) and 20,167,060 were women (51.6%). The number of subjects by study period increased over time. The mean age for men was 54.9 years (standard deviation [SD], 10.3 years) and 55.9 years for women (SD, 10.6 years). The crude smoking prevalence for men was 36.3% and 2.9% for women. The crude smoking prevalence in men decreased over time, while that of women did not vary. The age-standardized smoking prevalence for men was 35.3% (95% confidence interval [CI], 35.3%, 35.3%) and 3.0% for women (95% CI, 3.0%, 3.1%). In the 2009–2014 CHS, 443,570 were men (44.8%) and 545,722 were women (55.2%). The mean age of men was 58.2 years (SD, 12.0 years) and that of women was 59.9 years (SD, 12.7 years). The crude smoking prevalence in men was 40.0%, and 3.3% in women. The CHS data showed that the crude smoking prevalence in both genders gradually decreased over time. The age-standardized smoking prevalence of men was 42.5% (95% CI, 42.3%, 42.7%), and that of women was 3.2% (95% CI, 3.2%, 3.3%).
Table 1
Characteristics of study subjects according to study periods, data from the NHSD and the CHS in Korea, 2009–2014
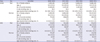
Values are presented as mean (SD) or percent (95% CI). Age-standardized smoking prevalence was estimated with the 2010 mid-year resident population as the standard population.
NHSD = National Health Screening Database, CHS = Community Health Survey, SD = standard deviation, CI = confidence interval.
![]()
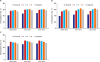
Fig. 1 presents the between-period correlations for district-level age-standardized smoking prevalence based on both databases. Overall, the correlation was higher for the smoking prevalence based on the NHSD rather than the CHS. This was true for both genders. In the NHSD, the correlation coefficient (r) ranged from 0.92 (correlation coefficient for women's smoking prevalence between 2009–2010 and 2013–2014) to 0.97 (correlation coefficient for men's smoking prevalence between 2011–2012 and 2013–2014). In contrast, in the CHS, the correlation coefficient (r) was between 0.58 (correlation coefficient for women's smoking prevalence between 2009–2010 and 2013–2014) and 0.69 (correlation coefficient for women's smoking prevalence between 2009–2010 and 2011–2012).
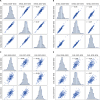 | Fig. 1Scatter plots and correlation coefficients (r) for correlations of age-standardized smoking prevalence between biennial time periods of analysis, findings from the NHSD and the CHS in Korea, 2009–2014. (A) Results from the NHSD in men. (B) Results from the NHSD in women. (C) Results from the CHS in men. (D) Results from the CHS in women.
NHSD = National Health Screening Database, CHS = Community Health Survey.
|
Table 2 shows the distribution of overall age-standardized smoking prevalence and age-standardized smoking prevalence by income quintiles in 245 si, gun, and gu in Korea based on the NHSD and the CHS. For men, the median age-standardized smoking prevalence from the NHSD was 36.9% (95% CI, 36.7%, 37.2%). The SD was 3.1 percentage points (%p). The minimum value was 26.0% in Gwangyang-si, Jeollanam-do (95% CI, 25.6%, 26.4%). The maximum value was 44.1% (95% CI, 43.7%, 44.6%) in Seo-gu, Daegu. In the CHS, the median smoking prevalence was 42.9% (95% CI, 39.8%, 46.1%) and the SD was 3.8%p. The minimum value was 28.1% (95% CI, 25.5%, 30.7%) in Gwacheon-si, Gyeonggi-do while the maximum value was 51.5% (95% CI, 48.2%, 54.8%) from Taebaek-si, Gangwon-do. In women, the median age-standardized smoking prevalence from the NHSD was 2.8% (95% CI, 2.7%, 2.9%). The SD was 1.0%p. The minimum value was 0.8% (95% CI, 0.6%, 0.9%) in Goheung-gun, Jeollanam-do. The maximum value was 7.4% (95% CI, 7.1%, 7.7%) in Dongducheon-si, Gyeonggi-do. In the CHS, the median age-standardized smoking prevalence was 3.2% (95% CI, 2.5%, 4.0%). The SD was 1.1%p. The minimum value was 0.7% (95% CI, 0.4%, 1.1%) from districts including Jangheung-gun, Jeollanam-do. The maximum value was 7.7% (95% CI, 6.4%, 8.9%) in Dongducheon-si, Gyeonggi-do. In both the NHSD and CHS, the median age-standardized smoking prevalence decreased with higher income levels and this was true for both genders.
Table 2
Distribution of overall age-standardized smoking prevalence, smoking prevalence by income quintiles and interquintile income gaps in smoking prevalence, findings for 245 local districts using the NHSD and the CHS in Korea, 2009–2014
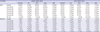
NHSD = National Health Screening Database, CHS = Community Health Survey, SD = standard deviation, IQR = interquartile range.
![]()
Table 2 also shows the distribution of interquintile income gaps in smoking prevalence in si, gun, and gu of Korea. In men, the median income gap in smoking prevalence based on the NHSD was 9.4%p (95% CI, 7.6%p, 11.2%p) and the SD was 2.1%p. The minimum value was 4.0%p (95% CI, 2.1%p, 5.9%p), in Gapyeong-gun, Gyeonggi-do while the maximum value was 19.0%p (95% CI, 18.1%p, 19.9%p) from Nam-gu, Pohang-si, Gyeongsangbuk-do. In the CHS, the median income gap in smoking prevalence for men was 9.4%p (95% CI, 2.4%p, 16.4%p). The SD was 4.6%p. The minimum value was −1.8%p (95% CI, −8.6%p, 5.0%p) in Goheung-gun, Jeollanam-do. The maximum value was 23.9%p (95% CI, 16.9%p, 30.9%p) in Nam-gu, Pohang-si, Gyeongsangbuk-do. In women, the median income gap in smoking prevalence based on the NHSD was 2.3%p (95% CI, 2.0%p, 2.6%p), and the SD was 0.9%p. The minimum value was 0.0%p (95% CI, −0.6%p, 0.6%p) in Gurye-gun, Jeollanam-do, while the maximum value was 5.6%p (95% CI, 4.5%p, 6.7%p) in Jung-gu, Busan. In the CHS, the median income gap in smoking prevalence for women was 3.1%p (95% CI, 0.1%p, 6.1%p). The SD was 1.9%p. The minimum value was −1.1%p (95% CI, −2.5%p, 0.3%p) in Gurye-gun, Jeollanam-do. The maximum value was 9.9%p (95% CI, 6.0%p, 13.8%p) in Dongducheon-si, Gyeonggi-do.
Supplementary Tables 1 and 2 show the age-standardized smoking prevalence and its interquintile income gaps based on the NHSD and CHS. According to the NHSD, the income gaps in smoking prevalence was over 0.0%p in all 245 si, gun, and gu for both men and women. Based on the CHS, the income gaps in smoking prevalence was over 0.0%p in 240 si, gun, and gu for men and 242 si, gun, and gu for women. Considering the 95% CI of the income gaps in smoking prevalence, the number of districts where the lower limit of the 95% CI was higher than 0.0%p was 245 for men and 244 for women based on the NHSD, and 167 for men and 173 for women based on the CHS. In both databases, there was no district where the upper limit of the 95% CI was lower than 0.0%p. This was true for both genders.
Fig. 2A and B show the age-standardized smoking prevalence in 245 si, gun, and gu based on the 2009–2014 NHSD and CHS. The correlation in smoking prevalence from the two databases was quite high: the correlation coefficient (r) was 0.87 in men and 0.85 in women. In men, the smoking prevalence estimated from the CHS tended to be lower than those calculated from the NHSD. With higher smoking prevalence, the difference in smoking prevalence between the two databases tended to increase: the regression coefficient (β) was 0.71 for men and 0.75 for women. For women, the agreement between the two databases was high: the concordance correlation coefficient (rc) was 0.80. Fig. 2C and D show the income gaps in smoking prevalence in 245 si, gun, and gu. The CHS showed greater variation in the income gaps in smoking prevalence rather than the NHSD. Based on the CHS, there were a few districts with an income gap in smoking prevalence lower than 0.0%p, but no such districts were found in the NHSD.
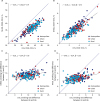 | Fig. 2Scatter plots and correlation coefficients (r, rc) as well as regression coefficients (β) for correlations of district-level age-standardized smoking prevalence and their interquintile income differences from the NHSD and the CHS among the 245 local districts in Korea, 2009–2014. (A) Correlations of smoking prevalences in men. (B) Correlations of smoking prevalences in women.
(C) Correlations of interquintile income differences in men. (D) Correlations of interquintile income differences in women.
NHSD = National Health Screening Database, CHS = Community Health Survey.
|
DISCUSSION
In this study, we compared the age-standardized smoking prevalence and the magnitude of the income gaps in smoking prevalence in 245 si, gun, and gu in Korea, using the NHSD and CHS, which enabled us to examine the extent of health inequalities at the district-level. The study results showed a higher between-period correlation for district-level smoking prevalence in the NHSD compared to the CHS, in both genders. The correlation coefficient of the age-standardized smoking prevalence across periods ranged between 0.92 and 0.97 in the NHSD and between 0.58 and 0.69 in the CHS. This finding indicates that the CHS exhibited a higher fluctuation in smoking prevalence over time. The key factor that explains this difference is different sample sizes in each district. In the CHS in 2013–2014, the median sample size for a district was 1,312, with a range of 1,001 to 4,204. In contrast, in the NHSD in the same period, the median sample size for a district was 46,535, with a range of 3,223 to 171,658. The larger sample size of the NHSD than the CHS is likely to have lowered the stochastic variation in measurements of age-standardized smoking prevalence, leading to the higher correlation coefficients across different periods.
The analysis also showed that the SD of the income gaps in smoking prevalence based on the NHSD from 2009 to 2014 was 2.1%p and 0.9%p for men and women, respectively. In the CHS, the SD was 4.6%p and 1.9%p for men and women, respectively. The variation in the income gaps in smoking prevalence based on the NHSD was lower than was observed based on the CHS. Moreover, based on the CHS, there were a few districts in which the smoking prevalence for the highest 20% of income levels was higher than the smoking prevalence for the lowest 20% of income levels. However, there was no such tendency in the NHSD. Based on the NHSD, the number of districts with a lower limit of the 95% CI for the income gap in smoking prevalence being higher than 0.0%p was 245 in men and 244 in women. For the CHS, the corresponding numbers of districts were 167 for men and 173 for women. These findings show clearer pro-rich inequality in smoking prevalence in using the NHSD than using the CHS. Such findings suggest that when calculating income gaps in smoking prevalence in si, gun, and gu, the CHS, due to its limited sample size, might yield high stochastic variations. Thus, it is necessary to use the NHSD (in addition to the CHS) as one source for monitoring income gaps in smoking prevalence in si, gun, and gu. Furthermore, the NHSD is useful in time-series monitoring of smoking inequality, as the income gap in smoking prevalence in si, gun, and gu can be estimated from the combined NHSD for just two years, and as the correlation coefficients for smoking prevalence across different periods were higher in the NHSD. It should be noted that income gaps in smoking prevalence are hardly be presented using two-year CHS data.
This study showed that the correlation of smoking prevalence in men and women between the two databases (Fig. 2A and B) was high: the correlation coefficients were 0.87 and 0.85 for men and women, respectively. The results of comparisons of smoking prevalence suggests that NHSD can be valuable for policy use. Nonetheless, although the prevalence of smoking in men tended to be higher in the CHS than in the NHSD, smoking prevalence in women did not show a clear difference between the two databases. Such findings may be partly attributed to participation rates in national health screening programs (both general health screening programs and transitional age health screening program) by income level. As Fig. 3 shows, age-standardized participation rates for men in national health screening programs among the fourth fifth and highest fifth of the income quintiles were higher than their counterparts in the lowest fifth and second fifth. In contrast, in women, the participation rates in national health screening programs by those in the second fifth and third fifth of the income quintiles were relatively higher than the rates among those who belonged to other income quintile groups. In the lowest fifth group of income quintiles, women also showed higher participation rates in national health screening programs than men. Considering that the age-standardized smoking prevalence in low-income groups is high in both genders in Korea, the income gap in national health screening programs participation rates may partially explain the relatively low smoking prevalence in the NHSD. Moreover, the different survey methods and questionnaires for obtaining information on current smoking status may help explain the discrepancy in the smoking prevalence between the two databases. A study has reported that face-to-face interviews may yield lower prevalence of socially undesirable behaviors such as cigarette smoking than the prevalence obtained using a self-administered questionnaire.19 The CHS was conducted using face-to-face interviews in the subjects' homes. Thus, it is possible that the CHS might have yielded lower smoking prevalence among respondents, particularly women, than the NHSD. However, the results of this study showed that the prevalence of smoking in women was relatively similar across the two databases, whereas the prevalence in men was not so. Therefore, it is hard to explain the difference in the smoking prevalence between these databases based on the different survey mode alone. Considering that the survey questions about current smoking are not identical between the NHSD and the CHS, the differences in the smoking prevalence between the two databases might have resulted from differences in use of survey questions and response categories.
 | Fig. 3Age-standardized participation rate in the national health screening programs by interquintile income level in Korea, 2009–2014. (A) Participation rate in total. (B) Participation rate in men. (C) Participation rate in women.
|
The results of this study show that income inequality in smoking clearly exists in almost all si, gun, and gu in Korea. Based on the NHSD, in all 245 districts, there was a 0.0%p or higher income gap in smoking prevalence. When limiting subjects to those in their 40s, the CHS also showed that there were 240 districts and 242 districts for men and women, respectively, where a 0.0%p or higher income gap in smoking prevalence existed. Such a tendency is similar to the results of a prior study that reported an income gap in smoking prevalence (among individuals aged ≥ 19 years) in most si, gun, and gu in Korea, based on seven years of CHS data in 2008–2014.13
This study has the following limitations. First, the income data of the two databases are not identical. In the NHSD, health insurance premium levels were used as a proxy for income. In comparison, the CHS used self-reported annual or monthly household income data. Moreover, while the monthly household income data of the 2014 CHS were categorical, in the present study, we used the median in each category. Second, the questions on current smoking status were not identical in the two databases. Third, this study did not provide data on the annual smoking prevalence, as data from two years were combined for analysis to resolve the overrepresentation of subpopulations in the NHSD.
Despite such limitations, this study has meaningful implications. It has demonstrated that, in addition to the CHS, the NHSD can be used as a data source for monitoring smoking inequality at the district-level. It is also worth noting that the smoking prevalence by si, gun, and gu in Korea as calculated from the NHSD demonstrated higher reproducibility over time than the smoking prevalence estimated based on the CHS. The CHS is an important and valuable source of data that provides information on a wide range of health indicators, including smoking. However, its sample sizes are too small to produce reliable health inequality indicators at the district-level. Therefore, the CHS needs to be improved in the future in terms of sample size, and health inequality studies at the district-level using the NHSD should be more actively conducted.
 XML Download