

 PDF
PDF Citation
 Print
Print


INTRODUCTION
Glaucomatous visual field defects develop due to optic nerve damage without showing specific symptoms until the end of their clinical course and ultimately can lead to blindness.12 No treatment which can reverse the damaged optic nerve is available at present; thus, early diagnosis and management of glaucoma symptoms are of great importance.34
High price and special requirements for the standard automated perimetry Humphrey Field Analyzer II 750i (HFA; Carl Zeiss Meditec, Dublin, CA, USA) result in accessibility limited to relatively large ophthalmic hospitals. HFA (600 × 580 × 510 mm; 40 kg) requires a relatively large space (1.5 × 2.0 m) and an ambient light control and is not easy to move to another location once installed. Therefore, a visual field testing system affordable for small hospitals is needed for better accessibility to the general public for early detection of glaucoma.
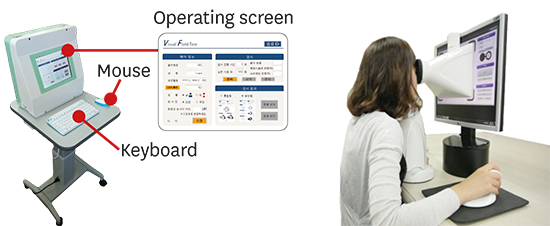
An LCD-based visual field testing system (LVF) as shown in Fig. 1 has been developed for better comfort, accuracy, and accessibility compared with HFA. First, LVF is designed to help an examinee maintain a comfortable posture, while HFA requires the neck bent, during visual field testing which lasts about five minutes per eye. Second, LVF employs a novel eye fixation method which helps an examinee easily fix the eye to the central target using a meaningful stimulus such as an alphanumeric character, a blinking stimulus, and/or a special-shape symbol, while HFA uses a static, simple dot as the central target in the testing. Lastly, LVF incorporates various design features for low cost including a visor with an eye shied and a LCD tablet PC so that it can be installed without special requirements of space and ambient light control and thus easily accessible to the general public.
The present study examined the effectiveness of LVF in comparison with the standard automated perimetry HFA. A randomized controlled crossover study was performed with a reference group of 202 normal eyes and a case group of 128 glaucomatous eyes using both LVF and HFA. The effectiveness of LVF was compared with HFA by analyzing the correlations of mean deviation (MD) and pattern standard deviation (PSD) measurements collected from LVF and HFA, respectively, and comparing area under the receiver operating characteristics curve (AUC) values differentiating the normal and glaucomatous eyes based on MD and PSD measurements from LVF and HFA.
METHODS
Comprehensive ophthalmic examinations including medical and family history, visual acuity testing, slit-lamp biomicroscopy, Goldmann applanation tonometry, and visual field testing using both LVF and HFA were performed. The orders of perimetry (LVF and HFA) and eye (left and right eyes) were randomized and balanced in the experiment. All the participants were examined and diagnosed at Kyung Hee University Hospital at Gangdong from March 2015 to January 2017.
Inclusion criteria
A total of 202 normal eyes and 128 glaucomatous eyes which met the following inclusion criteria were enrolled in the present study:
Baseline intraocular pressure (IOP) ≤ 21 mmHg
Best corrected visual acuity ≥ 20/30
Spherical equivalent < ± 6D
Astigmatism < ± 3D
Normal findings on anterior segment examination and gonioscopy
Fixation loss ≤ 20%, false positive error ≤ 33%, and false negative error ≤ 33%
Glaucomatous patients and healthy participants of which IOP ≤ 21 mmHg were recruited to minimize the possibility of inclusion of incorrect visual field testing results because IOP > 21 mmHg may lead to corneal edema which can interfere with accurate visual field measurement by diminishing visual function.56
Study groups
The eyes tested in the present study were classified into a normal eye group and a glaucomatous eye group based on the presence of structural damage in the optic nerve (confirmed by slit lamp biomicroscopy) and existence of a retinal nerve fiber layer (RNFL) defect (confirmed by red-free RNFL photography and optical coherence tomography [OCT]). Visual field test results were not used for eye classification for the purpose of the study-comparison of the visual field testing systems using visual field test measurements. Table 1 shows the demographic data of the eye groups in the present study.
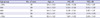
Table 1
Demographic information of normal eyes and glaucomatous eyes

![]()
Normal eye group
The normal eye group consisted of eyes with healthy optic nerves confirmed by slit lamp biomicroscopy with no RNFL defect verified by RNFL photography and OCT. In addition, their IOP was greater than 21 mmHg without having a history of glaucoma treatment.
Glaucomatous eye group
The glaucomatous eye group consisted of eyes showing glaucomatous optic nerve head damages confirmed by slit lamp biomicroscopy and RNFL defects on RNFL photography and OCT. A glaucomatous optic nerve change was defined by satisfying one or more of the following criteria: 1) optic disc cupping > 0.6; 2) difference of greater than 0.2 in cup-to-disc (C/D) ratio between the left and right eyes; 3) focal defect of the optic disc; 4) optic disc hemorrhage; and 5) RNFL defect.
Visual field tests
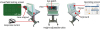
The visual field tests of both LVF and HFA were conducted and their test results were compared in the present study as illustrated in Fig. 2. In HFA visual field testing, participants were examined using the HFA 24-2 Swedish Interactive Thresholding Algorithm (SITA) program, a target of Goldmann size III white light, stimuli presented for 0.2 seconds, and 31.5 apostilbs of luminous intensity of the background. On the other hand, in LVF visual field testing, participants were examined using an LCD-based visual field system at 24 degrees using the i-Modified Binary Search (MOBS) algorithm (described in detail in the subsequent paragraph), a target of Goldmann size IV white light, and stimuli presented for 0.2 sec on the green background of LCD panel. Note that a target of size IV, instead of size III, was used in the LVF visual field testing because participants over 40 years of age preferred size IV to size III and no statistical difference between size III and size IV in visual field testing was found at α = 0.05 in terms of threshold sensitivity values (TSVs) at 52 test locations, MD, and PSD in the preliminary experiment of the present study.
 | Fig. 2Comparison of visual field test results of LVF and HFA for a participant with normal tension glaucoma (illustrated). The diagrams on the top and the bottom show TSVs (dB) and corresponding gray scales of the left and right eyes for LVF and HFA, respectively.
LVF = LCD-based visual field testing system, HFA = Humphrey Field Analyzer II-750i, TSV = threshold sensitivity value.
|
MOBS algorithm
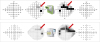
The MOBS algorithm (Fig. 3) is a binary search method used to estimate the minimum brightness level of a target at a particular test location that a subject can recognize by halving the range of target brightness and checking a mistake of the subject's response.7 MOBS uses the midpoint of a range as target brightness at each stage and adjusts the upper and lower limits of the range according to the response of the subject by replacing the lower limit for a yes response and the upper limit for a no response with the target brightness level presented. In addition, MOBS checks the upper and lower limits of the range for a mistake of the subject if two consecutive yes and no responses occur, respectively, and the limit of the range is widened to the corresponding previous limit if a mistake is confirmed. The iterative binary search process is continued until the width of the range reaches a minimum width (e.g., 3 dB) and a designated number of reversals (e.g., 2) have occurred. At the termination of the binary search process, the midpoint of the range is used as the estimate of TSV. Fig. 3 illustrates the MOBS process for a subject with a threshold of 8 dB and making a mistake using the initial threshold range of 0 and 20 dB and the termination criteria of 3 dB as the minimum width of range and 2 as the number of reversals.
 | Fig. 3Example of a MOBS process for a subject with a threshold of 8 dB and making a mistake using the initial threshold range of 0 and 20 dB and the termination criteria of 3 dB as the minimum width of range and 2 as the number of reversals. After two consecutive no responses, the corresponding lower limit (10 dB) is checked and then widened to 0 dB as the mistake of the subject is confirmed. An estimate of threshold is determined as 7.8 dB as the termination criteria are satisfied (adapted from Turpin et al.23).
MOBS = Modified Binary Search.
|
LVF normative database
The normative database of LVF was established by the following four steps: 1) data compilation; 2) calculation of difference in TSV between LVF and HFA; 3) data screening; and 4) summarizing normative data by age group. At the data compilation step, the visual field testing results of LVF and HFA were compiled. Then, at the TSV difference analysis step, the difference in TSV between LVF and HFA was calculated for each of the 52 test locations. Next, at the data screening step, the TSV measurement of a particular visual field location was excluded from establishment of a LVF normative database if the corresponding TSV difference between LVF and HFA was greater than 20 dB and a set of TSV measurements of a particular participant were excluded if the corresponding MD or PSD of the participant exceeded the range of mean ± 2 standard deviation (SD) of MD or that of PSD, respectively. Lastly, at the normative data summarizing step, a normative database of MD and PSD for LVF was established as shown in Table 2 for five age groups by identifying their mean and SD. The LVF normative database was used to determine the initial target brightness level at each visual field location and calculate total deviation, pattern deviation, MD, and PSD.
Table 2
Normative data of MD and PSD of LVF by age group
Data are shown as mean ± SD.
MD = mean deviation, PSD = pattern standard deviation, LVF = LCD-based visual field testing system, SD = standard deviation.
![]()
Statistical analysis
The relationships of MD and PSD measurements from LVF and HFA were examined by Pearson's correlation analysis. In addition, AUCs of MD and PSD of LVF and those of HFA differentiating normal eyes and glaucomatous eyes were analyzed by following the method of DeLong et al.,8 equivalent to the jack-knife method commonly employed in cross-validation for a small-size sample.910 SPSS version 18.0 (SPSS Inc., Chicago, IL, USA) was used for statistical testing on means and correlations of MD and PSD and the DeLong et al.8 option of “Comparison of ROC curves” in MedCalc version 9.6 (MedCalc, Mariakerke, Belgium) for AUC analysis.
RESULTS
Comparison of MD and PSD for normal and glaucomatous eye groups
Table 3 shows means ± SDs of MD and PSD of LVF and HFA for the normal eye group and the glaucomatous eye group, respectively, and corresponding statistical testing results on means in MD and PSD between the normal and glaucomatous eye groups. As shown in Table 3, all the mean differences in MD and PSD between the normal and glaucomatous eye groups were found significantly different at α = 0.05. For example, the means ± SDs of MD for LVF were 0.60 ± 3.20 in the normal eye group and −5.26 ± 6.47 for the glaucomatous eye group and their mean difference in MD were statistically different (t166 = −9.54; P < 0.001).
Table 3
MD and PSD values of LVF and HFA for normal eyes and glaucomatous eyes

Data are shown as mean ± SD.
MD = mean deviation, PSD = pattern standard deviation, LVF = LCD-based visual field testing system, HFA = Humphrey Field Analyzer II-750i, SD = standard deviation.
![]()
Relationship between LVF and HFA in terms of MD and PSD
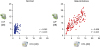
As shown in Fig. 4, the MD measurements of LVF and HFA showed positive correlations in both the normal and glaucomatous eye groups and the correlation of MD between LVF and HFA was higher in the glaucomatous eye group (r = 0.342 for normal eyes and r = 0.796 for glaucomatous eyes; P < 0.01). Furthermore, as shown in Fig. 5, the PSD measurements of LVF and HFA showed positive correlations in both the eye groups and the correlation of PSD between LVF and HFA was also higher in the glaucomatous eye group (r = 0.363 for normal eyes and r = 0.828 for glaucomatous eyes; P < 0.01).

Comparison of MD and PSD AUCs of LVF and HFA
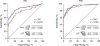
As shown in Fig. 6, MD AUCs were 0.786 (standard error [SE], 0.027; 95% confidence interval [CI], 0.738–0.829) for LVF and 0.868 (SE, 0.023; 95% CI, 0.825–0.902) for HFA, while PSD AUCs were 0.913 (SE, 0.017; 95% CI, 0.878–0.941) for LVF and 0.932 (SE, 0.016; 95% CI, 0.899–0.957) for HFA. HFA showed overall slightly higher MD and PSD AUCs than LVF. Lastly, the MD AUCs of LVF and HFA were statistically different (z = 2.992; P = 0.003), while the PSD AUCs of LVF and HFA were not (z = 1.605; P = 0.109).
DISCUSSION
Several studies have compared MD, PSD, and AUC of a new visual field perimetry with those of the standard perimetry to examine the diagnostic performance and accuracy of the new visual field perimetry.111213141516 The present study compared HFA and LVF to examine if a good concordance exists between the two test systems in both normal and glaucomatous eyes. The results of the present study show that the PSD AUC of LVF was not significantly different from that of HFA (difference in PSD AUC between LVF and HFA = 0.019), while the MD AUC of HFA was a slightly higher than that of LVF (difference in MD AUC between LVF and HFA = 0.082). MD can be affected by not only progression of glaucoma but also reference TSVs as shown in Equation 1,17 and opacity of cornea and media resulting from a cataract.1819 As shown in Equation 2, PSD is a measure of the roughness of the hill of vision calculated by the deviation between TSVs on the retina and less affected by reference TSVs and various extraneous factors including glaucoma.17 For this robustness reason, PSD is considered a more reliable measure than MD in glaucoma diagnosis.20 Since the PSD AUCs of LVF and HFA were not statistically different, LVF can be considered competent to HFA in distinguishing glaucomatous eyes from normal eyes. Since LVF has demonstrated a good concordance in terms of its diagnostic capability in glaucoma, LVF can be used as a tool to examine patients with possible glaucoma.
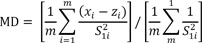
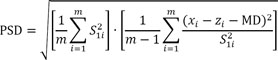
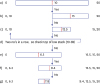
where, S21i = variance of the normal field measurement at location i, zi = reference TSV at location i, xi = measured TSV of test location i, m = number of test locations (excluding the blind spot).
= variance of the normal field measurement at location i, zi = reference TSV at location i, xi = measured TSV of test location i, m = number of test locations (excluding the blind spot).The results of the present study identified positive correlations between the two systems in terms MD and PSD. LVF was found to be a more sensitive apparatus than HFA with a larger range of MD and PSD measurements for the normal and glaucomatous eye groups compared to HFA as shown in Fig. 7.
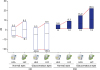 | Fig. 7Comparison of ranges of MD and PSD of normal and glaucomatous eyes for LVF and HFA.
MD = mean deviation, PSD = pattern standard deviation, LVF = LCD-based visual field testing system, HFA = Humphrey Field Analyzer II-750i.
|
The difference in AUC can be caused due to the difference in glaucoma diagnosis method. Clement et al.21 reported 0.910 of MD AUC and 0.948 of PSD AUC for the standard automated perimetry. On the other hand, Burgansky-Eliash et al.22 reported 0.669–0.904 of MD and PSD AUCs based on glaucoma diagnosis by optic nerve photography and OCT. Racette et al.14 also reported 0.680 of MD AUC and 0.641 of PSD AUC lower than those of Clement et al.'s study21 because glaucoma was diagnosed only by structural examination based on optic disc view and OCT. Since glaucoma was diagnosed only by structural examination in the present study, the MD and PSD AUCs ranging 0.786 to 0.936 might be resulted for LVF and HFA by increased possibility of inclusion of those with pre-perimetric glaucoma in the glaucomatous eye group.
The MOBS algorithm, which does not use a statistical method, was employed in the present study for LVF due to unavailability of a visual field normative database for LVF under development. Existing perimetry systems such as full-threshold algorithm, SITA, or zippy estimation by sequential testing (ZEST) algorithm to measure thresholds in visual field testing use algorithms requiring statistical databases.23 On the other hand, the MOBS algorithm allows visual field measurement with no statistical database. The MOBS algorithm is a binary search method that measures the minimum brightness level of the target that a subject can recognize by halving the range of target brightness with checking a mistake of the subject's response.7 The MOBS algorithm is a proper method for a new visual field testing system in the early stage of development, although it takes more time than the other algorithms to measure the threshold of each test location as it uses a binary method to reduce the scope of examination. Therefore, the MOBS algorithm would be used in LVF for a while until sufficient data is collected to construct a statistical database for a statistics-based algorithm such as SITA and ZEST to be applied to LVF to reduce the time of visual field testing.
Furthermore, use of a normative database of HFA to calculate the MD and PSD of LVF could affect the slightly lower AUC performance of LVF than HFA. Also, Fredette et al.24 reported that repeated measurements for baseline and follow-up evaluations would increase the reliability of visual field test. Single measurements of visual field testing were collected in the present study. If repeated measurements had been collected, the performance testing results might have shown a higher level of agreement.
Lastly, further research is needed to better understand the differences between LVF and HFA and to establish an extensive normative database for LVF for better performance in testing and diagnosis of visual field. Future studies can examine if novel features of LVF such as affordable price, portability, active eye fixation control, and on-line reporting are advantageous in various contexts of use compared with HFA in terms of performance, accessibility, and usability. Lastly, the visual field test data of 202 normal eyes consisting of 30 to 52 eyes for each age stratum were used for a normative database for LVF, and thus more studies are needed in the future to establish an extensive normative database for LVF for better performance in testing and diagnosis in visual field.
 XML Download