

 PDF
PDF Citation
 Print
Print


INTRODUCTION
Uterine leiomyoma is the most common benign type of gynecologic tumor, affecting 20%–50% of women of childbearing age.123 Menorrhagia, anemia, abnormal uterine bleeding, and dysmenorrhea are the main symptoms.123 Large uterine myomas cause distortion of the uterine cavity and can negatively affect fertility and pregnancy outcomes.456 Total hysterectomy and myomectomy are the main surgical options. During myomectomy in women with multiple myomas who want to preserve fertility, it is advisable to find and remove as many myomas as possible without injuring the endometrium or fallopian tubes to decrease the risk of additional operations for the growth of the remaining myomas.567 However, gynecologic surgeons can face difficulty in finding myomas embedded in the deep myometrium of the uterus that do not protrude into the uterine serosa during myomectomy, especially in laparoscopic or robotic assisted laparoscopic myomectomy which are lacking the tactile sense.8 A recent article involved augmented reality to improve surgery of intramural myomas that are difficult to localize during laparoscopy, by fusing the laparoscopic images with preoperative magnetic resonance imaging (MRI).9 In addition, finding the shortest distance between the myoma and the uterine serosa can be important to reduce unnecessary damage to the myometrium when making an incision into the uterus.9 However, suitable preoperative imaging fulfilling a surgeon's requirements is generally not available. Therefore, good quality imaging for myomectomy is needed.
Ultrasonography (US) is the most commonly used imaging modality for uterine myomas. However, its use is sometimes limited in cases with large myomas, multiple myomas, or myomas in obese patients.10 MRI is the most accurate imaging type for the localization of myomas, even in the abovementioned situations, and displays excellent contrast between myomas and the surrounding soft tissues without interobserver variability. However, MRI is expensive and provides only 2-dimensional (2D) imaging, which is limited to showing the relative locations of myomas in the uterus in 2 dimensions. Therefore, it is necessary to find a better imaging technique for the surgical planning of a myomectomy that can offer both the exact and relative localization of myomas and the endometrium in the three-dimensional (3D) space of the uterus. The surgeon's complete understanding of the 3D space within the patient's uterus can be helpful for successful myomectomy. This enables surgeons to decrease the time spent finding myomas during operation and determine the best uterine incision site to decrease the risk of damaging both the normal myometrium and the endometrium during a myomectomy. Moreover, it may reduce the need for intraoperative imaging, such as US, to find deeply embedded myomas, especially during laparoscopic surgery, which can result in a shorter overall operation time by saving time spent for US. With increasing interest in 3D technologies, techniques for visualizing targets in 3D for procedural or surgical planning are being developed continually.111213 We previously suggested 3D MRI for uterine myomectomy and confirmed the clinical needs of gynecologic laparoscopic surgeons by performing a web-based survey; 77.8% surgeons stated that using the 3D technique allows easier and more accurate detection of the location of myomas and the endometrium.14 However, the technology is still limited in clinical use because of the long time required to reconstruct the 3D image. Therefore, this study was carried out to determine a faster method for locating myomas in 3D using the uterine template with the selecting region of interest (ROI) method.
Go to : 
METHODS
Conventional 2D MRI of 5 patients who underwent myomectomy at our hospital were included in this study. All the patients' identification information was deleted, and they were reclassified using serial numbers. A 2D turbo spin echo (TSE) and T1-weighted high-resolution isotropic volume examination (THRIVE) images were obtained. The THRIVE imaging had a 640 × 640 resolution, 0.4845 mm pixel spacing, and 2.0 mm slice thickness, while the 2D-TSE imaging had a 1,056 × 1,056 resolution, 0.2283 mm pixel spacing, and 2.0 mm slice thickness. Microsoft Visual Studio (version 2005; Microsoft, Redmond, WA, USA) was used for the development of algorithms and software, and ITK (version 3.14.0; Kitware, Clifton Park, NY, USA) and VTK (version 5.10.0; Kitware) were used as libraries. The SPSS package (version 13; SPSS Inc., Chicago, IL, USA) was used for statistical analysis. Fig. 1 shows the implementation process.
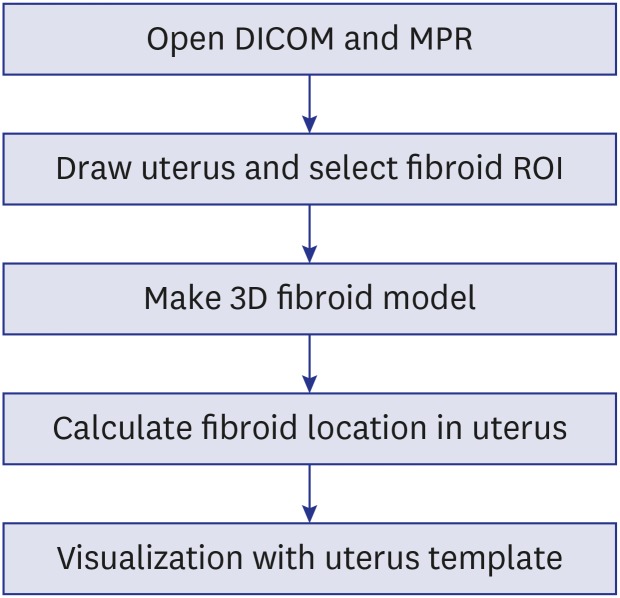
The 3D visualization method proposed in this study provides a way to position the uterine myomas on a virtual uterine template. After setting the uterine region from the MRI composed of multiplanar reconstruction (MPR), 3D myomas were generated by selecting the slide of the existing uterine myomas in the set region.
Open Digital Imaging and Communications in Medicine (DICOM) and MPR
Because the input MRI had 2D information, MPR imaging was generated as the first step toward 3D visualization. Because MPR allows for the visualization of a plane that cannot be observed in 2D space, other types of medical procedures utilize this method to segment the ROI or to investigate the surgical anatomy of the internal organs. The MPR was given volume by stacking MRI to reconstruct different planes.1516 Images captured in the direction of the axial plane were mainly used to reconstruct the coronal and sagittal planes.
Draw uterus and select myoma ROI
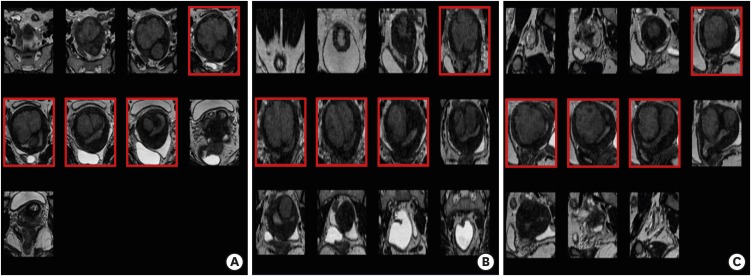
Since the conventional manual segmentation method requires the separation of individual regions of the uterus and myomas, there is a drawback of taking too much time to acquire an ROI in each case. Therefore, in this study, a square-shaped maximum area of the uterus was drawn on the axial, coronal, and sagittal planes and were compared to each other (Fig. 2). The greater width of axial and sagittal planes was used as the width of the uterus model, while the longer one between the length of axial plane and the width of coronal plane was used as the length of the uterus. Finally, the greater length of sagittal and coronal planes was used as the height of the uterine template. The calculated size was applied to the previously prepared uterine template (Fig. 2). Unlike the existing manual segmentation method that specifies the ROI for all slides, as we described in a previous report,14 our new method required a relatively short processing time to obtain the size of the uterus. After experts set the maximum area of the uterus, they selected the uterine fibroids slides in each plane (Fig. 3). During the process, a 3D grid was formed based on intervals calculated by uterus size and slide spacing. The unit of slide spacing was millimeter (mm) and while the spacing was set at 10 mm, users could manually change this spacing (Fig. 4).
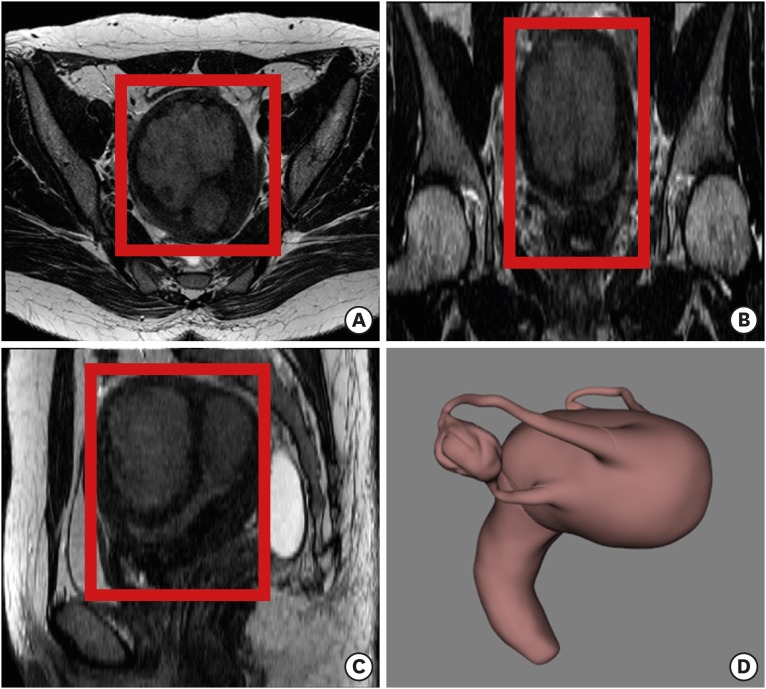 | Fig. 2Maximum area of a uterus on each plane of 2D MRI. (A) Axial plane. (B) Sagittal plane. (C) Coronal plane. (D) The uterine template model constructed according to the size of the uterus.
2D = two-dimensional, MRI = magnetic resonance imaging.
|
Creating a 3D myoma model
The selected slides of the uterine myomas were stored in a 3D grid that was created in advance (Fig. 3). Since the size of the grid constructed was identical to that of the uterus model, each slide of the grid was synchronized with a slide of the MPR having the same spacing. Therefore, the selection for the presence of fibroids in the image consisting of the MPR indicated a region where the slide showed the presence of a fibroid in the 3D grid. The predicted location of the fibroids was understood to be the intersection of the three planes and that specific intersection was saved as the fibroid object. After the intersection of the selected fibroids was separately modeled on each object, nearby objects were combined into one blob. The blobbing was processed on the basis of a modeled object, confirming 3D objects in 26 directions. The blob was expanded when a neighboring object was detected, and this expansion was iterated based on the neighboring object. The processing continued until all objects were blobbed. Because the blobbed objects had a cubic shape due to the processing in a 3D grid, an oval-shaped approximation was obtained at the end of the process (Fig. 4).
Calculate fibroid locations in the uterus
A fibroid was not located in the uterus model, although it was visualized in a 3D grid. However, medical experts set the grid size based on the maximum size of a uterus; the size was the same as that of a uterus model. Therefore, fibroids were located on the registration model with the grid and uterus model. Center points of the uterus model and 3D grid were calculated based on each boundary. Further, the points of the uterus model were moved to the points of the 3D grid to coordinate them (Fig. 4).
Comparison of the speed of 3D reconstruction
To evaluate the clinical applicability of our proposed method in terms of speed, we compared the time for 3D visualization of a uterus and myomas between the conventional manual-segmentation method12 and our proposed method.
Ethics statement
The Institutional Review Board (IRB) of Ewha Womans University College of Medicine waived the IRB approval for this study according to the enforcement regulations No. 13. And written informed consent were obtained for the use of the imaging of the five patients.
Go to :
RESULTS
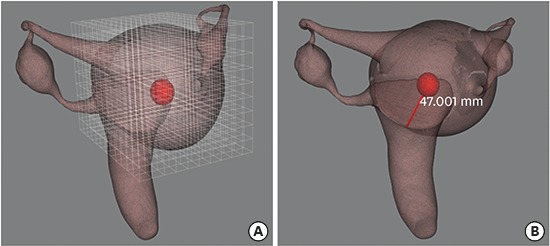
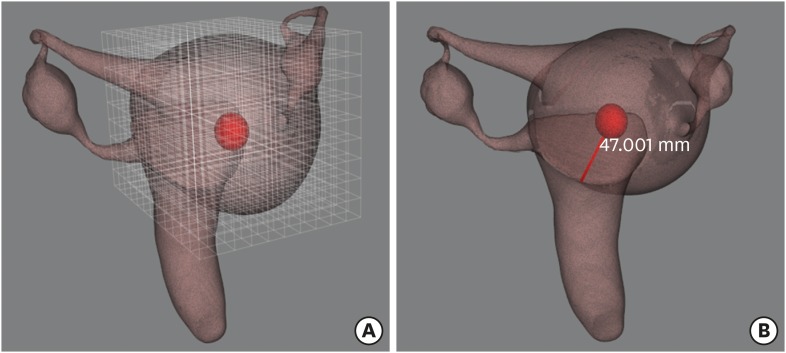
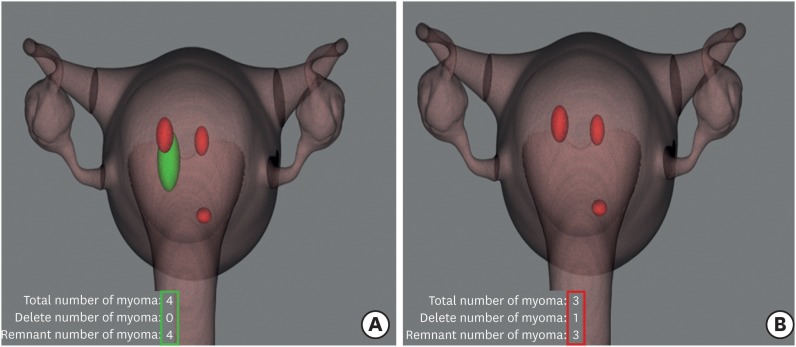
On the 3D uterine template with the grid, the location and size of myomas are on the screen (Fig. 4). The size and volume of the myomas are computable based on the slide thickness and pixel spacing using DICOM header information. Displaying the shortest distance and direction between the surface of a uterine template and a myoma was also possible; this can suggest the optimal site and depth of the uterine incision during myomectomy. Our program also can count the total number of myomas, the number of removed myomas, and the number of remaining myomas; these numbers appear on the lower left side of the screen (Fig. 5). When a surgeon removes a myoma from the uterus during surgery, ‘clicking and dragging’ removes the myoma from the 3D uterus on the screen. For example, the myoma, which is colored green in Fig. 5A, was removed and disappeared in Fig. 5B and counted as a removed myoma. This function can facilitate counting the removed and remaining myomas during operation. It can prevent surgical errors, such as leaving a removed myoma in the abdominal cavity at the end of the operation.
In terms of the comparison of the time of 3D visualization between the manual segmentation method and our proposed method, our proposed method was over 95% faster than the manual method. In the manual method, it took 1,244.8 ± 83.9 seconds to visualize the uterus and myoma, and the time required to obtain the number of myomas increased. With our proposed method, the time required to visualize the uterus and myomas was 68.8 ± 12.8 seconds (P < 0.05). The imaging of our proposed method (Fig. 6B) provided clear imaging with a smooth outline, which was better than the method of our previous report (Fig. 6).14 This proposed method is simpler than the conventional manual-segmentation method that draws the ROI on every DICOM slice, consuming much more time (Table 1).

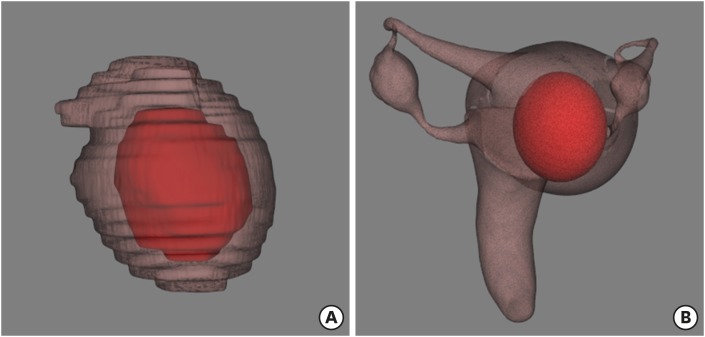 | Fig. 6Comparison of image of a uterus and a fibroid obtained by two different methods. (A) Manual segmentation method. (B) Our proposed method.
|
Table 1
3D visualization time of one uterine myoma for the manual segmentation method and our proposed method
3D = three-dimensional, SD = standard deviation.
aManual segmentation method described in Guo et al.12
![]()
Go to :
DISCUSSION
Three-dimensional imaging is often used in medical imaging.1718192021 Recently, there have been attempts to use 3D visualization as an imaging adjunctive tool for successful surgery especially in orthopedic, plastic, and dental surgery mostly in computed tomography imaging.1718192021 However, it requires a significant amount of time and effort to acquire the ROIs necessary for 3D visualization in MRI. We investigated a faster method of positioning myomas with a 3D uterine template, where we are able to intuitively recognize the position and size of myomas in a single 3D image obtained from the conventional 2D MRI. We required less time to reconstruct a 3D image with our proposed method than with the previously described method.1314 The previous method can be summarized as the following steps: 1) registration of MRI images that have different sequences using an image processing technique, 2) detection of myoma, endometrium, and blood vessels, and 3) their 3D reconstruction.14 However, the process of 3D visualization was not fully automatic and required partial manual operation such as seeding for the detection of uterine myoma and endometrium.14
Although the clinical study concerning the efficacy of our proposed technique did not reflect real operational circumstances, a surgeon was able to instantly identify the location of myomas prior to and during the operation. Additionally, the total operating time of the myomectomy may decrease because this technique can help to determine the most suitable uterine incision site to identify deeply located uterine myomas, thereby avoiding unnecessary injury to the uterine myometrium and endometrium in the process of digging the myometrium to identify the myoma. In other words, this proposed method is expected to be helpful in decision-making during myomectomy as well as provide good preoperative imaging that enables instant recognition of the precise location of uterine myomas.
However, some limitations exist in our 3D reconstruction method. First, the uterine template is confined to an anteverted uterus. Although it is the most common type (75%) of uterine direction, it cannot be applied to all types of uteri, such as a retroverted (25%) or upright uterus with pelvic adhesion. Therefore, the calculated shortest distance between the myoma and the uterine surface may be corrected only in the anteverted uterus in a real operation field. Second, the uterine template in the current state is not realistic; thus, greater improvement in graphic techniques are required for surgeons to perceive the template as more realistic. Nevertheless, the use of a uterine template allows for faster and more intuitive recognition than the manual segmentation method, which requires checking each 2D imaging slide to identify the shortest distance between the myoma and the uterine serosa to decide on the uterine incision site.
Third, there is a small difference in shape between a virtual myoma and a replica, which was approximated to an elliptical shape. The location of the myoma was approximated to an ellipse using the set grid intervals. There can be a minimal gap between the replica and the actual myoma depending on the setting of the grid slide spacing. Most myomas are round or elliptical, but a few can be irregularly shaped, which cannot be covered by this proposed method. We tried to decrease the size of the grid to reduce the gap between the real myoma and the replica. However, this resulted in an increased number of slides to review. Therefore, the determination of an optimal number of grids is needed, along with balancing the accuracy and the time and effort spent reviewing the slides.
We are planning to develop a more improved reconstruction method to solve the above-mentioned limitations. In addition, we will also visualize the relative location of the myomas in important uterine structures such as the uterine endometrium and the fallopian tubes, including tubal ostia, which can affect a future pregnancy. This will also contribute to the accurate recognition of the 3D position and distance between the uterine structures and myomas, as well as improve the realism of the visualization.
In conclusion, we demonstrated a faster method of reconstructing a 3D image using a uterine template. The reference template can be made in the same way as our proposed method for all types of human organs, such as the lungs, prostate, liver, kidneys, and thyroid. Thus, our proposed 3D reconstruction method can shorten the time for preoperative planning and the total operation time for the same reasons described earlier. During operation, especially in myomectomy for patients who want to preserve fertility, the proposed technique can serve as an excellent auxiliary tool for a successful and accurate operation, although large randomized controlled trials should be implemented to make a conclusion about the efficacy of our 3D method. We also expect the proposed method to be useful for understanding the 3D position of ROIs in a surgical object, teaching medical students, and explaining medical issues to patients.
Go to :
 XML Download