

 PDF
PDF Citation
 Print
Print


INTRODUCTION
Malnutrition is associated with many adverse clinical outcomes, including longer length of stay, increased morbidity and mortality, and increased hospital costs.12345 Although measurement of malnutrition varied depending on the hospital setting and method of nutritional assessment, its prevalence in hospitals was reported to range from 20% to 50%.145678 Therefore, the recognition of malnutrition and early nutritional therapy in hospitalized patients is important along with the treatment of underlying diseases. However, although malnutrition among hospitalized patients is not rare, it is occasionally overlooked1489 either because medical resources, such as the availability of nutritional specialists or hospital systematic and financial support, are insufficient, or because clinicians do not consider malnutrition to be a vital issue.
The nationwide prevalence of malnutrition in hospitalized patients is not well studied in Korea, and nutritional therapy planning for patients with malnutrition is difficult without information regarding the present situation. This nationwide multicenter cross-sectional study was conducted to determine the prevalence of malnutrition and associated clinical factors, and to evaluate the association with clinical outcomes in Korea.
METHODS
Participants
Clinical research groups of the Korean Society for Parenteral and Enteral Nutrition (KSPEN) recruited a total of 25 hospitals (19 tertiary hospitals and 6 secondary hospitals). The size of the participating hospitals ranged from 400 to 2,700 beds. All hospitals had their own nutritional support team. The study participants were recruited from among the patients hospitalized on January 6, 2014, regardless of the departments of admission. The exclusion criteria were as follows: patients who were pregnant, aged < 18 years, and planned to be discharged within 72 hours. The number of recruiting participants from each hospital was determined by considering the average number of admitting patients for 1 day. Based on the sample size calculation, we planned to enroll 337 patients. The included participants were investigated for the following characteristics: age, sex, height, weight, department of admission, major diagnosis at the time of admission, and underlying diseases. All the participating hospitals acquired approval from the Institutional Review Board, and informed consent was obtained from all the patients.
Nutritional status and clinical outcome assessment
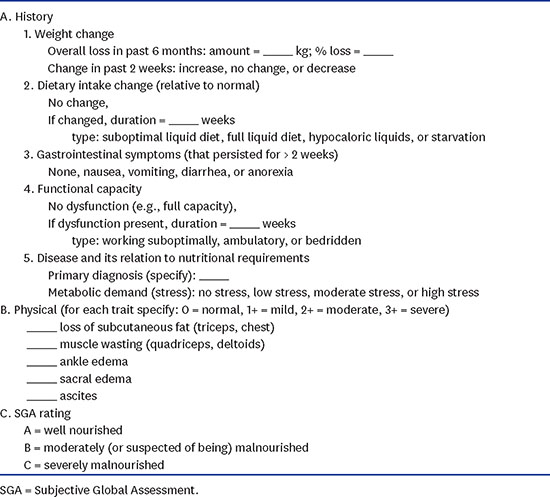
The nutritional support team of each hospital investigated the demographic characteristics and evaluated the nutritional status of the study subjects using the Subjective Global Assessment (SGA) on the day of admission and categorized them into SGA A, B, or C (Appendix 1).1011 The worst two groups in terms of nutrition, SGA B and C, were defined as patients with malnutrition. Subsequently, clinical outcomes, such as length of stay, intensive care unit admission rate, survival rate, and type of discharge were evaluated after 90 days.
Statistical analysis
In the preliminary study conducted with 99 patients from six hospitals in Korea 2013,12 the malnutrition rate in the hospitalized patients was 20.2% (20/99). By using this rate, we initially calculated the sample size to be 218 patients, with an α of 0.05 and a statistical power of 0.8. The refusal rate of the enrolled study subjects from our preliminary study was 0%–35%; therefore, we applied the highest rate in a conservative manner. Thus, the total number of participants was calculated to be 335 (218 ×  ).
).
).In addition, we classified the 25 participating hospitals into five groups according to rank for the number of admitting patients a day (range: 20–350). The hospitals in the same group were allocated with the same number of study subjects. We allotted the required number of study participants to each group in proportion to the average number of admitted patients. As a result, each hospital in the five groups was allotted 6, 11, 12, 15, and 25 patients, respectively. Finally, the total number of participants was determined to be 337.
Categorical variables were compared by using the χ2 or Fisher exact test; and continuous variables, by using the Student t-test or one-way analysis of variance (ANOVA). To determine the risk factors of malnutrition in hospitalized patients, we used logistic regression models in the univariate and multivariate analyses with the backward method. A two-sided significance level of 0.05 was used for all statistical analyses. Statistical analyses were performed by using the Statistical Package for Social Sciences version 22.0 software (SPSS Inc., Chicago, IL, USA).
RESULTS
Among the 337 planned participants, 300 (79.0%) were finally recruited. No significant differences in enrollment rate were found between the five groups of hospitals (P = 0.701). The most common reason for admission was medical treatment (50.7%), followed by elective surgery (38.7%) and diagnostic work-up (10.6%).
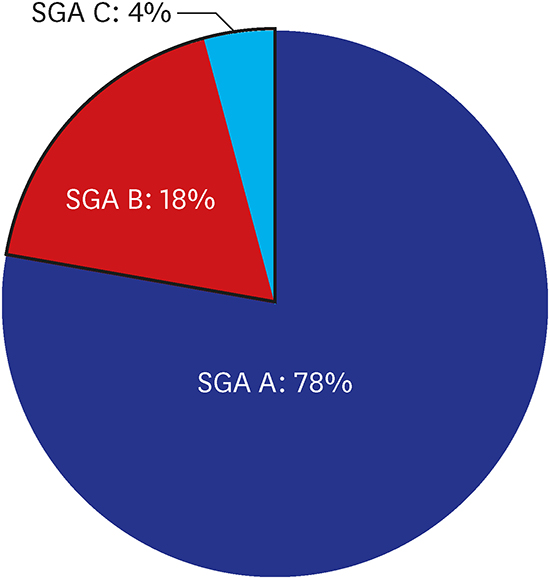
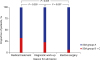
The malnutrition rate in the hospitalized patients was found to be 22.0% (66/300). Among the patients with malnutrition (SGA B + C), 81.8% (n = 54) had moderate malnutrition (SGA B) and 18.2% (n = 12) had severe malnutrition (SGA C). The malnutrition rate was not different according to the size (number of admitting patients a day, divided into five groups) or the referral level (secondary or tertiary) of the participating hospital (P = 0.851 and P = 0.769). A difference in malnutrition rate was found between the different age groups, and the elderly (aged ≥ 70 years) had a significantly higher malnutrition rate than the younger age group (38.2% vs. 17.2%, P < 0.001; Fig. 1). A significant difference in malnutrition rate was observed among the reasons for admission. The malnutrition rate was highest in the patients admitted for medical treatment (32.5%), followed by those admitted for diagnostic work-up (23.3%) and elective surgery (7.0%; Fig. 2).
Fig. 1
Patients aged ≥ 70 years exhibited higher malnutrition rates than the younger patients.
SGA = Subjective Global Assessment.
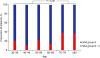
Fig. 2
Malnutrition rates according to the reason for admission.
SGA = Subjective Global Assessment.
The demographic characteristics of the enrolled patients according to nutritional status are presented in Table 1. The patients with malnutrition had significantly lower body mass index (24.2 ± 3.3 kg/m2 vs. 21.9 ± 3.9 kg/m2, P < 0.001), and more patients were admitted for medical treatment in the malnourished group (41.6% vs. 69.7%, P < 0.001). In terms of underlying disease, more patients had underlying pulmonary and oncological diseases in the malnourished group, with a statistically significant difference (4.3% vs. 12.1%, P = 0.034; 15.0% vs. 25.8%, P = 0.041). The prevalence rates of renal, gastrointestinal, and psychological diseases were also elevated in this group (6.8% vs. 13.6%, 5.6% vs. 12.1%, and 1.7% vs. 6.1%), but these were not statistically significant (Table 1).
Table 1
Demographic characteristics of the hospitalized patients (n = 300) according to SGA rank

In the univariate analysis, malnourishment was the dependent variable, and age ≥ 70 years (odds ratio [OR], 2.97; 95% confidence interval [CI], 1.64–5.39), underlying pulmonary and oncological diseases (OR, 3.09; 95% CI, 1.17–8.18 and OR, 1.97; 95% CI, 1.02–3.81, respectively), and admission for medical treatment or diagnostic work-up (OR, 6.11; 95% CI, 2.79–13.36) were associated with a significantly higher rate of malnutrition (Table 2). Factors that were statistically significant in the univariate analysis (P < 0.100) and sex were included in the multivariate analysis. The patients aged ≥ 70 years were found to have 2.4 times higher risk of malnutrition (95% CI, 1.01–4.56; P = 0.005). The patients admitted for medical treatment or diagnostic work-up had an increased risk of malnutrition (OR, 5.48; 95% CI, 2.47–12.14, P < 0.001; Table 2).
Table 2
Logistic binary regression with malnutrition (SGA B + C) as a dependent variable

Malnutrition was closely related to the clinical outcomes (Table 3). As malnutrition worsen, the length of hospital stay was increased and the survival rate decreased, with statistically significant differences across the three SGA groups (7.63 ± 6.03 vs. 9.02 ± 9.96 vs. 12.18 ± 7.24 days, P = 0.018 and 97.9% vs. 90.7% vs. 58.3%, P < 0.001). In the post hoc study, length of hospital stay was significantly different between groups A and C only (P = 0.024 with Bonferroni correction), and survival rate was significantly different among all the groups (SGA A and B, P = 0.030; B and C, P = 0.015; A and C, P < 0.001, with Bonferroni correction).
Table 3
Clinical outcomes of the hospitalized patients according to SGA rank

Data are shown as number (%) or mean ± standard deviation.
SGA = Subjective Global Assessment, ICU = intensive care unit, ANOVA = analysis of variance.
aStatistically significant only between SGA A and C by ANOVA with Bonferroni correction (P = 0.024); bSGA A and B, P = 0.030; B and C, P = 0.015; A and C, P < 0.001, using the χ2 test with Bonferroni correction.
DISCUSSION
In this nationwide multicenter cross-sectional study in Korea, 22% of the hospitalized patients had malnutrition at the point of admission according to SGA rank. This rate corresponds with those in other studies that evaluated the hospital malnutrition rate according to SGA rank. An Australian study performed in 2008 by Gout et al.4 reported a 23% malnutrition rate in tertiary hospitals using the SGA rank, and a German study performed by Pirlich et al.7 reported a malnutrition rate of 27.4% in 13 hospitals. Like our study, these studies only evaluated nutritional status at the point of admission. If our study included already hospitalized patients, the malnutrition rate may have been higher. For instance, in the Brazilian National Survey on Hospital Nutritional Assessment survey conducted in Brazil, the malnutrition rate was determined to be 48.1% by using the SGA rank.8 This relatively high rate may have resulted from including both newly admitted and already hospitalized patients.
Age was a major risk factor of malnutrition. Of the patients aged ≥ 70 years, 38.2% had a significantly higher malnutrition rate than the younger patients (17.2% vs. 38.2%, P < 0.001). The aforementioned German study7 also reported a high prevalence of malnutrition in elderly patients (43%). Many physiological, social, and psychological changes ensue as patients get older, which makes the elderly particularly vulnerable to malnutrition.1314 Considering the high prevalence of malnutrition in this group, routine and periodic nutritional assessment of hospitalized elderly patients is mandatory as an initiating step of appropriate nutritional therapy. The Mini Nutrition Assessment, which is encouraged for use in the elderly, can be applied for a more detailed evaluation.151617
Having specific underlying comorbidities was associated with malnutrition, and this was especially apparent in the patients with pulmonary and oncological diseases in this study. Resting energy expenditure increased to as high as 15%–20% of the expected value among chronic obstructive pulmonary disease patients, which could have resulted from the increased energy of the respiratory muscles.1819 In addition, inflammation, hypoxia, hypercapnia, and various medications are known to cause malnutrition in patients with pulmonary disease. Weight loss is a common symptom in patients with oncological diseases, due to the tumor itself, the physiological reaction to the tumor, and treatment complications from treatment, all of which can promote malnutrition.202122 Oncological disease was also identified as an independent risk factor of malnutrition in other studies.723
The patients admitted for medical treatment or diagnostic work-up exhibited a higher malnutrition rate than those admitted for elective surgery. This may be explained by the fact that the latter group of patients were unlikely to have acute medical diseases at the time of admission. A relatively low malnutrition rate in patients admitted for elective surgical treatment was also observed in other studies.78 The analysis was done only for the type of care, not departments such as general surgery or cardiovascular department, because each hospital has a unique structure of departments, even patients with the same condition can be admitted to different departments. In addition, since the purpose of hospitalization differs for each patient even within a single department, it is difficult to correlate the general health condition of a patient with the departments where the patient was hospitalized.
Malnutrition is known to worsen many clinical outcomes.12345 In the present study, a poor nutritional status was associated with longer length of hospital stay and lower 90-day survival rate. Fortunately, several studies demonstrated that adequate nutritional therapy for patients with malnutrition reduces length of hospital stay, infectious or non-infectious complications, and mortality.2425262728 Considering 22% of malnutrition rate and its adverse effect on clinical outcomes, clinician should make effort to identify and manage malnutrition in hospitalized patients. Therefore, all hospitals should implement a nutritional screening program to identify patients with or at risk of malnutrition.2930 In addition, having a multidisciplinary nutritional support team that can assess high-risk patients and provide appropriate nutritional therapy is important.28 Foremost, clinicians should recognize that malnutrition is not an inevitable result of the aging process or underlying diseases but should be considered as a specific disease entity that requires active management.
The present study has some limitations. First, nutritional status was only evaluated on the day of admission and patients who were already hospitalized were not included in this study; therefore, this study may have underestimated the malnutrition rate of all the hospitalized patients. Second, clinical outcomes according to the nutritional status were not adjusted for the severity of underlying diseases, which may have biased the results. Third, previous admission history within some period was not considered in the analysis of the comparison between SGA A or SGA B or the association with the likelihood of malnutrition (SGA B + C), which could have been an important factor. However, the sample size for each hospital was calculated from the number of admitted patients at each hospital to reduce the selection bias. To the best of our knowledge, this study is the first nationwide prospective study to identify the malnutrition rate of hospital inpatients in Korea, and our findings will help promote the hospital nutritional support programs in Korea.
In conclusion, malnutrition was common in hospitalized patients, and the rate of malnutrition tended to be high when the patient was older than 70 years old or hospitalized for medical treatment or diagnostic work-up. Malnourished patients needed longer hospitalization and showed lower survival rate in the present study.
 XML Download