

 PDF
PDF ePub
ePub Citation
 Print
Print


INTRODUCTION
Recent cardiopulmonary resuscitation (CPR) guidelines recommend two methods of ventilation: no ventilation (chest compression-only CPR, CC) or two ventilations (30:2 chest compression-to-ventilation ratio, CV2).123 No ventilation is recommended for inexperienced bystanders unable to perform proper ventilation or unwilling to perform mouth-to-mouth ventilation during basic life support (BLS).45 Meanwhile, however, several reports have emphasized the need for ventilation during CPR in order to promote resuscitation outcomes.678 Various compression-to-ventilation (CV) ratios including no ventilation have been investigated, depending on the need for artificial ventilation during CPR; however, no CV ratio has been shown to be superior to others.91011 Therefore, by expert consensus, the current CPR guidelines recommend a 30:2 CV ratio for skilled rescuers.112 However, two consecutive ventilations can deteriorate hemodynamic parameters during CPR followed by an increase in intracranial output and decreases in coronary perfusion pressure (CPP), mean arterial pressure, and cerebral perfusion (CP) pressure, compared to single ventilation.13 Furthermore, two consecutive ventilations can adversely affect CPR quality by interrupting chest compressions for 4 or more seconds.141516
Recently our group reported that a single ventilation (30:1 CV ratio, CV1) can have similar oxygenation and better chest compression fraction (CCF) than those of a two ventilations (30:2 CV ratio) and could be an alternative CPR method to minimize interruption of chest compression and maintain oxygenation.17 However, this study did not verify the effect of 30:1 CV ratio on neurologic outcomes, which are more meaningful to clinical practice. The aim of this study was to compare short-term resuscitation outcomes among CPR using the 30:1 and 30:2 CV ratio and chest compression-only CPR, and we hypothesized that 30:1 CV ratio would show better neurologic outcomes.
MATERIALS AND METHODS
Study design
This laboratory study was designed to compare resuscitation outcomes following CPR with various ventilation methods, including no-ventilation, single ventilation, and two ventilations between chest compressions in a swine model of cardiac arrest. This study was approved by the Institutional Animal Care and Use Committee of Yonsei University Wonju College of Medicine, Wonju, Republic of Korea (YWC-170605).
Animal preparation
Forty-two male Yorkshire pigs (weight 40–50 kg) were used in this study. The pigs were allowed full access to water and food until the day before the experiment and were fasted from midnight. The pigs were initially sedated with an intramuscular ketamine (15 mg/kg) and xylazine (2 mg/kg), followed by inhaled 3% isoflurane. After sedation, the pigs were placed in a prone position, and endotracheal intubation was performed with a cuffed endotracheal tube. Animals were then placed in a supine position and ventilated with room air via a volume-controlled ventilator (MDS Matrix 3000, Matrix, Orchard Park, NY, USA). The tidal volume was set at 10 mL/kg with a ventilation rate of 18 breaths per minute. Electrocardiography (ECG) with lead II and end-tidal CO2 (ETCO2) were monitored continuously. Under aseptic conditions, the right femoral artery was cannulated with a 5.5-Fr introducer sheath using the Seldinger method, and the aortic blood pressures were recorded continuously with a 5-Fr micromanometer-tipped catheter introduced into the femoral artery. An introducer sheath was placed in the right external jugular vein, and the right atrial pressure (RAP) was recorded via a 5-Fr micromanometer-tipped catheter. The right internal carotid artery was exposed, and a vascular flowmeter (Transonic, Ithaca, NY, USA) was applied to monitor the carotid blood flow (CBF). An introducer sheath placed via the right internal jugular vein was used as insertion route for a 5-Fr pacing catheter for inducing ventricular fibrillation (VF) and infusion of saline and epinephrine. Left femoral artery cannulation was also performed for arterial blood sampling. A 9-mm burr hole (Martell® and Trepan®, Aesculap, Tuttlingen, Germany) was placed at the upper part of the os frontale 1 cm from the sagittal suture at an angle of 90°, and a laser Doppler probe was introduced via the burr hole to monitor CP (BLF22 Tissue Perfusion Monitor®, Transonic). Once the catheters were in place, a 100-unit/kg intravenous (IV) heparin bolus was administered to prevent thrombosis.
Study protocol
The pigs were randomized into three groups according to results indicated in a sealed, opaque envelope opened by an investigator (YWK) before the induction of cardiac arrest. The randomization envelopes, which contained different ventilation methods (no ventilation, single ventilation, or two ventilations), were randomized by shaking the box and drawing an envelope from the top of the resulting pile. During the first 8 minutes of the simulated BLS period, the CC group received only chest compressions; the 30:1 CV ratio group received single ventilation followed by 30 chest compressions; and the 30:2 CV ratio group received two consecutive ventilations followed by 30 chest compressions. All chest compressions were performed by mechanical CPR (LUCAS2® Chest Compression System, Physio-Control, Redmond, WA, USA). Because this device lacked a pre-programmed mode for the 30:1 CV ratio, the investigators repeatedly performed 30 compressions using the continuous chest compression mode, paused the CPR device, performed single ventilation, and then continued chest compression in the 30:1 group as soon as possible. In the CV2 group, the ventilations was performed within times of pause in the pre-programmed mode of 30:2 CV ratio.
After baseline data were collected, a pacing catheter was positioned in the right ventricle. VF was induced by delivering an alternating electrical current at 60 Hz to the endocardium, which was confirmed by the ECG waveform and a decline in aortic pressure (AoP). Once VF was induced, the endotracheal tube was disconnected from the ventilator, and the pigs were observed for 2 minutes without any procedure or treatment. After 2 minutes of untreated VF, mimicking the BLS situation in which a bystander recognizes cardiac arrest and calls for help, 8 minutes of BLS was performed. The chest compression depth was set at 5 cm at a rate of 100 per minute. Positive pressure ventilation at about 300 mL of tidal volume was delivered with a resuscitator bag (Silicone resuscitator 87005133, Laerdal Medical, Stavanger, Norway).
Defibrillation (2 J/kg) was performed after 8 minutes of BLS if the ECG rhythm was shockable, and consecutive defibrillation (4 J/kg) was performed as indicated. During the next 14 minutes after BLS, the chest compression was changed to a continuous mode, and ventilation with 15 L/min oxygen was delivered every 10 chest compressions, mimicking advanced cardiac life support (ACLS). One milligram of epinephrine with 20 mL of saline was delivered every 4 minutes until the return of spontaneous circulation (ROSC) or the end of the experiment.
If a pig did not achieve ROSC at 22 minutes after VF induction, the experiment was terminated, and the animal was considered dead. When a pig achieved ROSC, we observed it for two hours under mechanical ventilation with inhalation anesthesia. After two hours, the animal was transferred to the breeding room, and then, we checked respiratory rate, arterial oxygen saturation (SaO2), rectal temperature, spontaneous movement, and feeding status every 2 hours. Modified postcardiac arrest care was performed for 24 hours and comprised injection of intramuscular ketoprofen of 1 mg/kg for pain control, IV infusion of normal saline of 80 mL/hr for preventing dehydration, applying 100% oxygen via a face mask when SaO2 dropped under 90%, and controlling body temperature at about 36.0℃ by applying an ice bag and fanning. If a pig could move spontaneously, feed well, and breathe comfortably within 24 hours of observation after ROSC, we stopped modified post-cardiac arrest care and checking status, including respiratory rate, SaO2, rectal temperature, spontaneous movement, and feeding, and then, the swine cerebral performance category (CPC) was recorded as 1. The swine CPC was determined by another researcher who was blinded to our study after 24 hours from ROSC, and pigs were euthanized after determining the swine CPC.18 In summary, a score of 1 is normal, 2 indicates mild neurological deficit (e.g., eating or drinking abnormally, unsteady gait, or slight resistance to restraint), 3 reflects severe neurological deficit (the animal is recumbent, unable to stand, and only partially responsive to stimuli), 4 is comatose, and 5 is dead. After the neurologic examination, the animals were euthanized by IV injection of potassium chloride of 60 mEq under anesthesia with intramuscular ketamine and isoflurane inhalation (Fig. 1).
Measurements
The data were digitized using a digital recording system (PowerLab, AD Instruments, Colorado Springs, CO, USA). AoP, RAP, CBF, and CP were continuously recorded and analyzed at baseline, at 2 minutes, and every 4 minutes until 22 minutes had elapsed. The CPP during CPR was calculated as the difference between the AoP and RAP in the mid-diastolic phase using an electrical subtraction unit. CP values are presented as percentage change compared to values averaged over the last minute before each measurement. The CP drop was defined as the difference between the CP value immediately before stopping the chest compression and just before re-starting the chest compression during ventilation. The cumulative time of CP drop during BLS was defined as the total duration of low CP. Arterial blood gas analyses, including pH, PaCO2, PaO2, and HCO3−, SaO2, and lactate were performed with a blood gas analyzer (i-STAT1, Abbott Laboratories, Abbott Park, IL, USA) at baseline, at 2 minutes, and every 4 minutes until 22 minutes had elapsed. Once a pig achieved ROSC, the measurement of hemodynamic parameters and arterial blood gas profiles was stopped due to the possibility of bias from spontaneous circulation.
ROSC was defined as the maintenance of perfusing AoP over 20 minutes. The 24-hour survival rate and swine CPC at 24 hours were evaluated for outcome variables.18 A favorable neurologic outcome was defined as CPC scores 1 or 2.
Sample size
The sample size was selected by referring to a preliminary study based on the results from nine pigs per group, because neurologic outcomes after CPR with a 30:1 CV ratio have not previously been evaluated. In the preliminary study, a favorable neurologic outcome was observed in two of nine (22%) pigs in the CC group, seven of nine (78%) in the CV1 group, and two of nine (22%) pigs in the CV2 group. Because the main purpose of this study was to compare favorable neurologic outcomes between the CV1 and other groups, the sample size was calculated as 12 pigs per group using tests for two proportions with a two-sided alpha value of 0.05, a statistical power of 80%, and proportions of 0.22. Finally, 14 animals from each group were chosen, considering a 10% drop-off rate.
Data analysis
Continuous variables are presented as means±standard deviations and were compared by analysis of variance (ANOVA) or Kruskal-Wallis tests as appropriate. Student's t-tests were used to compare the CCF and CP drops between the CV1 and CV2 groups. Nominal data are presented as frequencies with proportions and were compared using chi-square or Fisher's exact tests as appropriate. Repeated-measure ANOVA was used to compare arterial blood gas analysis (ABGA) profiles during BLS. A linear mixed model analysis was used to compare hemodynamic parameters and ABGA profiles during BLS and ACLS. A two-sided p value less than 0.05 was considered statistically significant. In post-hoc analysis of Kruskal-Wallis tests, we performed Bonferroni correction because the family-wise type I error would be increased at a 5% significance level for multiple comparisons. The formula for compensating is as below:
and p values less than 0.142 were considered significant in this analysis. Statistical analysis was performed using R version 3.4.0 (The R Foundation for Statistical Computing, Vienna, Austria).
RESULTS
Baseline characteristics
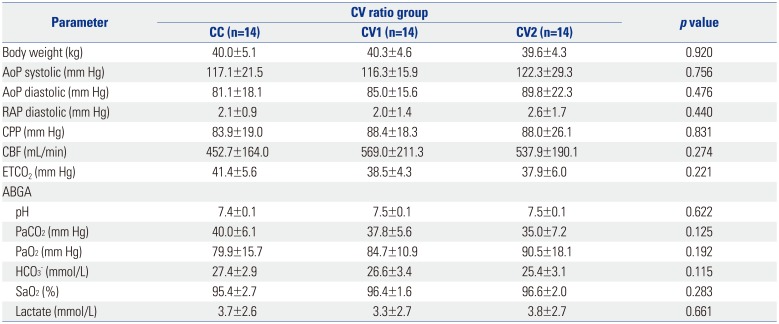
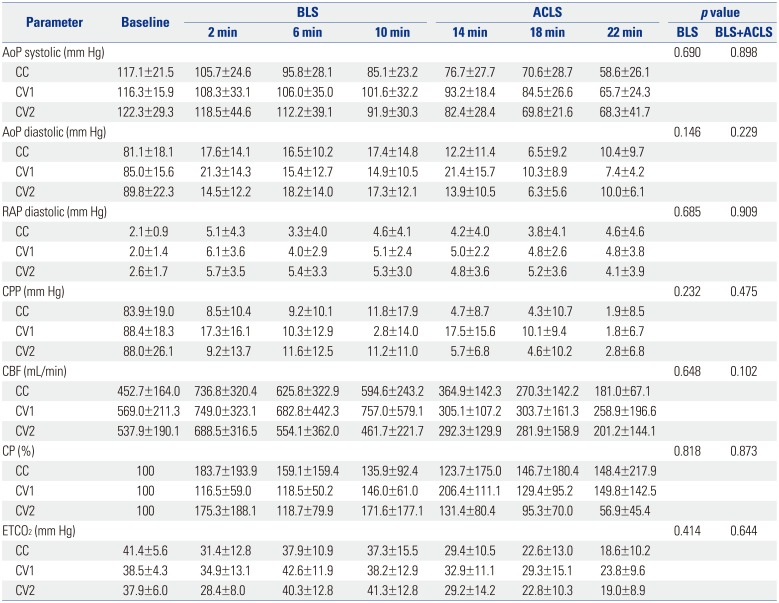
Fourteen male pigs from each group were included in the analysis. There was no significant difference in baseline characteristics, including body weight, aortic systolic and diastolic pressures, right atrial diastolic pressure, CPP, CBF, ETCO2, or arterial blood gas profiles, between groups (Table 1).
Comparison of arterial oxygen parameters during BLS
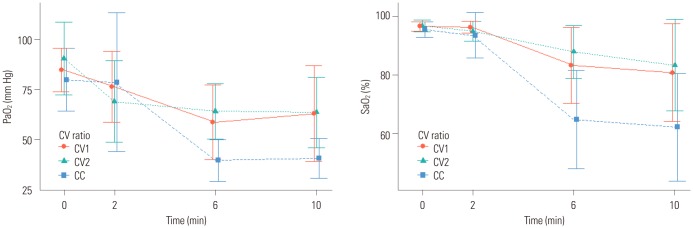
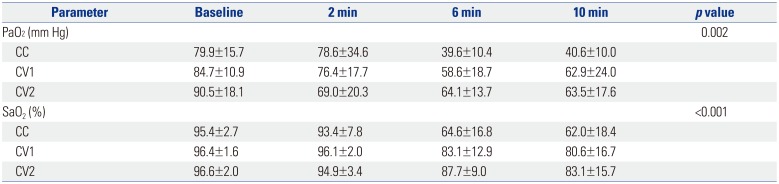
We analyzed the differences in PaO2 and SaO2 between baseline, 2 minutes, 6 minutes, and 10 minutes to compare oxygen parameters during BLS. The oxygen parameters were similar in the CV1 and CV2 groups, but were significantly lower in the CC group than those of the CV1 and CV2 groups (p=0.002 and p<0.001, respectively) (Table 2, Fig. 2).
Comparison of the quality of chest compressions and ventilation during BLS between the CV1 and CV2 groups
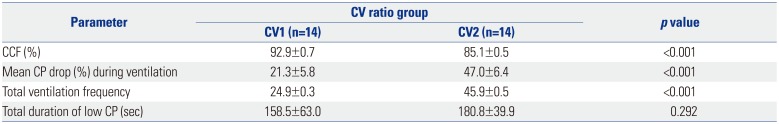
The CCF was highest in the CC group (1.0), followed by the CV1 (0.93) and CV2 (0.85) groups (p<0.001). The mean CP drop during ventilation was higher in the CV2 group than that in the CV1 group during BLS (47±6% vs. 21±6%). The total duration of low CP was longer in the CV2 group than that in the CV1 group, although the difference was not statistically significant (p=0.292) (Table 3).
Hemodynamic parameters during BLS and ACLS
There were no significant differences between groups in group-time interaction analyses in hemodynamic parameters, including aortic systolic and diastolic pressure, right atrial diastolic pressure, CPP, CBF, CP, and ETCO2, during BLS and ACLS (Table 4, Supplementary Table 1, only online).
Arterial blood gas profiles during BLS and ACLS
There was no significant difference in group-time interaction analyses in arterial blood gas profiles, including pH, PaO2, HCO3−, and lactate, during BLS and ACLS (Supplementary Table 2, only online). There was a significant difference in group-time interaction in PCO2 and SaO2 (p=0.044 and p<0.001, respectively), although the statistical difference mainly originated from time (p<0.001 in both variables) rather than from group differences (p=0.981 and 0.648, respectively) (Supplementary Tables 3, 4, 5, only online).
Outcomes
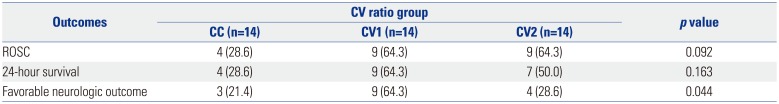
Four pigs (29%) in the CC group, nine (64%) in the CV1 group, and nine (64%) in the CV2 group achieved ROSC (p=0.092). All pigs that achieved ROSC survived for 24 hours, except for two pigs in the CV2 group (p=0.163). A favorable neurologic outcome was most frequently observed in the CV1 group (n=9, 64%), followed by the CV2 (n=4, 29%) and CC (n=3, 21%) groups (p=0.044) (Table 5).
DISCUSSION
In our study, CPR with a 30:1 CV ratio showed minimal interruption of chest compression and proper oxygenation during CPR and it would be a reason that favorable neurologic outcomes frequently observed in this group. A poor neurologic outcome in post-cardiac arrest patients can be a socioeconomic burden to their family and community.19 Postresuscitation care has been investigated to improve neurologic outcomes in post-cardiac arrest patients; however, there is no established treatment modality other than targeted temperature management.20 Poor neurologic outcomes are likely caused by inflammatory and ischemia-reperfusion injury from insufficient oxygenation and perfusion before and during resuscitation, even though multiple host and environmental factors may also play a role.21 Therefore, effective resuscitation including high-quality chest compressions and optimal oxygenation during and after cardiac arrest are considered to play the most significant role in achieving good neurologic outcomes in cardiac arrest patients.22 Recent CPR guidelines recommend chest compression-only CPR for inexperienced rescuers because of the risk for inadequate ventilation.12 However, chest compression-only CPR might be another risk for poor outcome due to insufficient oxygen supply even though it can promote high-quality chest compression by minimizing compression interruption.7 As a result, improper oxygenation during resuscitation can decrease the rates of survival and achieving good neurologic outcomes.23 On the other hand, standard CPR with a 30:2 CV ratio poses a risk of inadequate perfusion due to the unavoidable interruption of chest compression.10 Furthermore, two consecutive ventilations can induce hyperventilation, which decreases venous return by increasing intrathoracic pressure and consequently decreasing preload and cardiac output or causing gastric distension leading to pulmonary aspiration.24 Even though various CV ratios have been investigated to identify the optimal CV ratio during BLS, there is no superior recommendation of one over the others. Nevertheless, an expert consensus has recommended a CV ratio of 30:2 or CC in recent CPR guidelines.122526 This study was designed based on a previous study in which the CV1 group showed similar oxygenation and better CCF, compared to those of the CV2 group. Meanwhile, in other studies, an increased CV ratio from 15:2 or 30:2 to 15:1 showed better hemodynamics and lower oxygen uptake and energy expenditure during CPR.131727 In our study, the CV1 group showed a higher CCF than that in the CV2 group and higher oxygenation than that of the CC group during BLS. Minimal interruption of chest compression for ventilation resulted in higher CCF and a lesser CP drop in the CV1 group, compared to the CV2 group. In addition, the CV1 group maintained proper SaO2, compared with the CV2 group, during BLS. Harmonious CPR performance simultaneously maintained better perfusion and oxygenation in the CV1 group than in the other groups, which may explain why favorable outcomes were most frequently observed in the CV1 group.
During BLS and ACLS, there was a statistically significant difference between groups in group-time interaction in PaCO2 and SaO2. Because we enrolled data obtained during resuscitation, the hemodynamic parameters and arterial blood gas profiles in the survivors were excluded from the final analysis. As a result, the higher the rate of ROSC, the fewer data included in the study. Therefore, the results during ACLS might be confused even though we performed a linear mixed model analysis to minimize the effect of missing values.
There are several limitations to our study. First, the cardiac arrest situation differed from that of human cases because the animals were intubated before inducing VF. Airway management and artificial ventilation via a bag-mask ventilator, not mouth-to-mouth ventilation, during BLS facilitates gas exchange and hands-off time would be shorter, compared to those of human cardiac arrest situations. Second, the quality of chest compression also differs from that of bystanders in human cases because we used a mechanical CPR device for BLS. Third, agonal respiration after VF induction could affect results of ABGA, even though it is a form of brainstem reflex activity that does not cause enough ventilation.28 Fourth, neurologic outcomes might be improved if we performed strict targeted temperature management as with human victims, even though we controlled the fever conventionally. Fifth, this study did not include histopathologic injury determination, which would show different cerebral injury patterns.
In conclusion, CPR with a 30:1 CV ratio appeared to promote better short-term neurological outcomes than CPR with no ventilation or two ventilations in a porcine VF arrest model.

 XML Download