

 PDF
PDF ePub
ePub Citation
 Print
Print


The utility of hemoglobin A1c (HbA1c) as a reliable reflection of the long-term glycemic index in clinical practice is premised upon a normal hemoglobin (Hb) glycation rate [12]. This requires a relatively stable glycemic environment in vivo and erythrocyte turnover. However, several biological factors that significantly alter the glycation rate, such as a rapidly changing glycemic status or altered erythrocyte life span, may limit the validity of this assumption and the reliability of HbA1c as a biomarker [3]. Hb variants result from a mutated globin chain of the Hb molecule, which can alter the structure, behavior, stability, or quantity of the globin chain produced [45]. Some Hb variants (e.g., sickle cell) shorten the erythrocyte life span due to structural instability [45], resulting in a physiologically lower HbA1c level for a given glycemic status [6].
The hemoglobin E (HbE) phenotype results from a single-nucleotide polymorphism that reduces synthesis of β-globin chain [67]. However, the impact of HbE phenotype on the life span of erythrocytes is currently unknown. HbE is one of the most common Hb variants globally, particularly in South and Southeast Asia [8]. HbE can interfere with HbA1c measurement in some laboratory methods [9101112]. Paisooksantivatana et al. [13] showed that HbA1c levels are lower in HbE subjects than those with normal Hb (HbAA), but they did not control for age and glycemic status, both of which can significantly affect HbA1c levels. Therefore, we compared the HbA1c levels of normoglycemic HbAA and HbE subjects, controlling for age, and examined potential hematological and biochemical factors contributing to the differences in HbA1c levels.
In this cross-sectional case-control study, subjects were prospectively recruited among those visiting the clinics at Siriraj Hospital, Mahidol University, Bangkok, Thailand, for regular health screening between December 2014 and March 2016. All subjects were otherwise asymptomatic. This study was approved by the Siriraj Hospital Institutional Review Board (Ref: Si718/2014), which waived the requirement for informed consent.
Subjects fasted for 10–12 hours before standard phlebotomy. Plasma samples were collected in lithium heparinized and sodium fluoride (for glucose) tubes, transported to the laboratory, centrifuged at 2,136×g for seven minutes, and analyzed. Whole blood samples were collected in EDTA vacutainers. We used anonymized, residual blood samples of subjects with normal fasting plasma glucose (FPG, <5.6 mmol/L), AST, ALT, and creatinine levels (i.e., results falling within the laboratory reference intervals: AST 0–0.67 µkat/L in males, 0–0.53 µkat/L in females; ALT 0–0.68 µkat/L in males, 0–0.55 µkat/L in females; creatinine 59–103 µmol/L in males, 45–84 µmol/L in females). Tests for FPG, AST, ALT, creatinine, total cholesterol, HDL-cholesterol, and triglycerides were performed using the Roche cobas 8000 analyzer (Roche Diagnostics, Mannheim, Germany). LDL-cholesterol was calculated using the Friedewald formula [14]. Complete blood count was obtained using the XN-10 (Sysmex Corporation, Kobe, Japan) or Beckman Coulter LH 780 (Beckman Coulter, Miami, FL, USA) analyzer. HbA1c level was measured in K2EDTA whole blood samples using both an immunoassay (Integra 800 CTS, Roche Diagnostics; between-run CV: 1.8%) and cation-exchange HPLC (D-10 Dual Extended Program, Bio-Rad Laboratories, Hercules, CA, USA; between-run CV: 2.4%). Samples were analyzed by two HbA1c methods within eight hrs of each other and stored at 4℃ in the meantime as the HbA1c level is generally stable for up to one week at 2–8℃ [15]. These HbA1c laboratory methods have been validated to not be influenced by the HbE phenotype (http://www.ngsp.org/interf.asp).
HbAA status was determined on the basis of a mean corpuscle volume (MCV) of >80 fL and a normal Hb chromatogram with a Hb alpha 2 (HbA2)/E area <3.5% on the D-10 analyzer. HbE subjects were identified by the presence of an A2/E window with an area of 25–35% according to the local clinical practice guidelines for diagnosis and management of thalassemia syndromes [16]. Subjects with HbE disease (homozygous for the HbE allele) were excluded due to the absence of an HbA0 peak on the chromatogram.
An unpaired t-test was used to compare HbA1c levels between HbAA and HbE subjects since HbA1c was normally distributed in each group according to the histogram. The difference in HbA1c levels between two analyses was normally distributed; therefore, a paired t-test was employed for its analysis. A chi-square test was used to compare the sex ratio. To identify factors contributing to differences in HbA1c levels between groups, a univariate binary logistic regression was first performed, followed by a multiple logistic regression using variables with P<0.2 in the univariate analysis. Multicollinearity was tested using a variance inflation factor (VIF) of <10. Results from binary logistic regression were presented as odds ratios (ORs) and 95% confidence intervals (CIs). A Bland-Altman plot was constructed to assess whether the difference in HbA1c levels obtained by the two methods depended on the “true” (i.e., average) value. Statistical analyses were performed using PASW version 18.0 (SPSS Inc., Chicago, IL, USA) and MedCalc version 16 (MedCalc, Mariakerke, Belgium). P value of <0.05 was considered statistically significant. To determine clinical significance, we used the allowable total analytic error for HbA1c by the College of American Pathologist proficiency testing program, which is currently±6% of an accurately assigned value [17].
In total, 131 HbAA subjects and 148 HbE subjects were included; age (43.3±9.6 years for HbAA and 41.5±9.7 years for HbE, P=0.12) and sex (male 16.0% for HbAA and 16.9% for HbE; P=0.85) did not differ between groups. Subjects' hematological and biochemical data are summarized in Table 1. Among the HbE subjects, 131/148 (88.5%) had a low MCV (62.5–79.9 fL), and the remaining had low to normal MCV (80.1–83.2 fL).
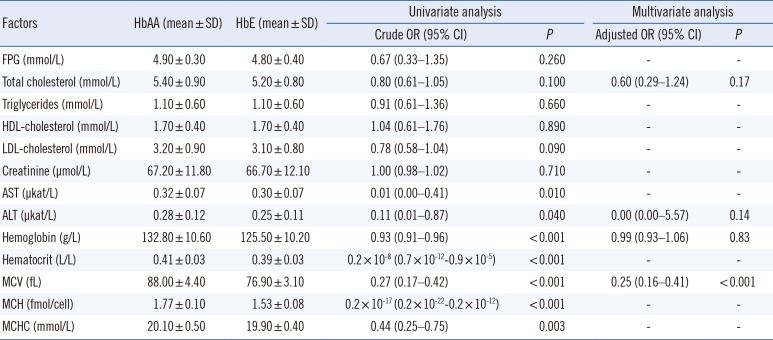
Table 1
Factors associated with differences in HbA1c levels between HbAA (N=131) and HbE (N=148) subjects
![]()
The mean±SD (range) HbA1c levels of HbAA and HbE subjects were 5.5±0.3% (4.5–6.3%) and 5.3±0.3% (4.4–6.6%), respectively, according to the immunoassay, and were 5.5±0.3% (4.4–6.4%) and 5.3±0.3% (4.5–6.1%), respectively, according to HPLC (Figs. 1 and 2; P<0.001 for both methods).
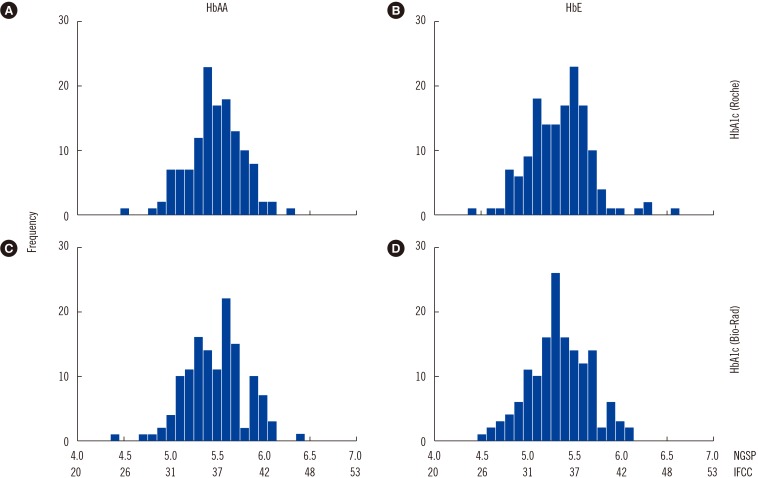 | Fig. 1Histogram of HbA1c results in the study population. (A) and (B) show HbA1c levels measured by the Roche Integra 800CTS immunoassay (Roche Diagnostics, Mannheim, Germany). (C) and (D) show HbA1c levels measured by Bio-Rad D10 HPLC (Bio-Rad Laboratories, Hercules, CA, USA).
|
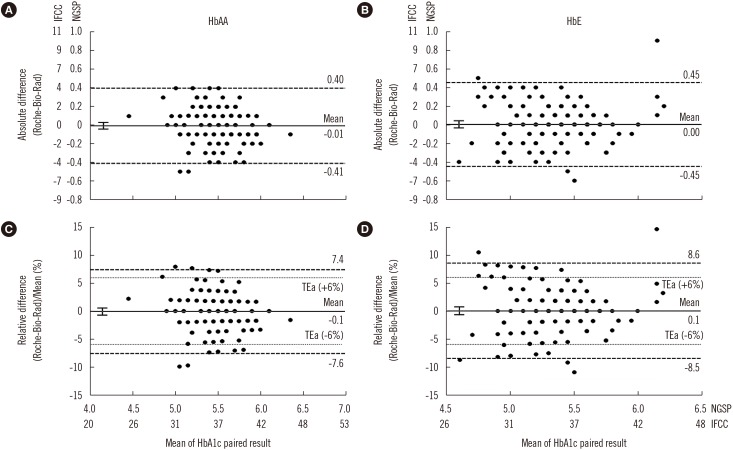 | Fig. 2Bland-Altman plots of HbA1c results for HbAA and HbE subjects. (A) and (B) show the absolute differences in HbA1c results between the immunoassay (Roche Integra 800CTS; Roche Diagnostics, Mannheim, Germany) and cation-exchange HPLC (Bio-Rad D-10; Bio-Rad Laboratories, Hercules, CA, USA). (C) and (D) show percentage of the mean differences in HbA1c results. Left panels are for HbAA subjects (N=131) and right panels are for HbE subjects (N=148). The bold solid lines denote mean bias and 95% confidence intervals. The dashed lines denote the 95% limits of agreement of the difference, and the dotted lines denote the College of American Pathologists allowable total error (TEa, ±6%) [17].
|
In the univariate logistic regression, there were no differences in FPG, total cholesterol, triglycerides, HDL-cholesterol, calculated LDL-cholesterol, or creatinine levels between HbAA and HbE subjects (P>0.05 for all). AST, ALT, Hb, Hct, MCV, mean corpuscular Hb, and mean corpuscular Hb concentration significantly differed between HbAA and HbE subjects. In the multiple logistic regression, only MCV significantly contributed to differences in HbA1c levels between groups (Table 1).
Paisooksantivatana et al. [13] suggested that the difference in HbA1c levels between HbAA and HbE subjects in their study was related to biological factors. However, their ability to draw this conclusion is limited because the glycemic status of their subjects was neither defined a priori nor described in their study. They also did not specify the age of their subjects, which is associated with increasing HbA1c levels [18]. We selected subjects with normal FPG, AST, ALT, and creatinine levels to control biological factors that may confound the interpretation of HbA1c results. Moreover, age did not significantly differ between the two groups. The HbA1c level was slightly, but significantly, lower (mean difference of 0.2% HbA1c, or mean % difference of 3.6%) in HbE subjects than in HbAA subjects, according to both the immunoassay and HPLC. Our finding is similar to that of Paisooksantivatana et al . [13], albeit at a smaller magnitude. This discrepancy may be explained by the more stringent inclusion criteria used in our study. Interestingly, the magnitude of the difference in HbA1c levels matches that of the racial difference in HbA1c levels between non-Hispanic White (median: 4.9%), non-Hispanic Black (median: 5.2%), and Mexican-American (median: 5.0%) children and young adults included in the Third National Health and Nutrition Examination Survey of the USA [19].
Although the difference in HbA1c levels between normoglycemic HbAA and HbE subjects is relatively small and unlikely to alter clinical decisions, from an epidemiological perspective, a 0.2% HbA1c difference can lead to a significant proportion of population being classified differently. This is because the threshold of non-diabetes HbA1c (≤5.6%) falls very close to the mean or median of the distribution of HbA1c in the general population (e.g., mean of 5.47% in Thailand [20], median of 5.5–5.9% in Singapore [18]). Hence, even a relatively small shift in HbA1c levels can lead to a significant proportion of the population being misclassified.
A limitation of this study is that HbA1c level was measured in only normoglycemic subjects, to control glycemic status. The physiological effects of HbE on HbA1c levels in subjects with impaired glucose metabolism or diabetes are unknown and should be explored. Another limitation is the lack of definitive Hb testing (e.g., genetic analysis) to confirm the identity of the Hb variants, owing to resource limitations. Importantly, the finding that MCV significantly contributes to the difference in HbA1c levels between HbAA and HbE subjects may be due to a selection bias, as HbAA was defined as MCV >80 fL, according to the local clinical practice guidelines for diagnosis and management of thalassemia syndrome [16]. Thus, this finding should be interpreted with caution and warrants further research.
In conclusion, while controlling age and glycemic status, we showed that HbA1c level is slightly but significantly lower in HbE subjects than HbAA subjects. Each laboratory should compile a database of subjects with hemoglobinopathy and provide interpretative comments to inform clinicians when hemoglobinopathy is identified in samples for HbA1c measurement. Clinicians should exercise caution when interpreting HbA1c results from HbE subjects.
 XML Download