

 PDF
PDF ePub
ePub Citation
 Print
Print


Peripheral T-cell lymphomas, not otherwise specified (PTCLs) represent approximately 10% of all non-Hodgkin lymphomas [1]. They are aggressive diseases with various degrees of bone marrow (BM) infiltration. Overall, one-third of PTCL cases show evidence of BM infiltration, which can be best identified in biopsies rather than on aspirates [2345]. BM examination is routinely performed in PTCL patients to assess the extent and stage of the disease. CD3 is a pan-T-cell related marker expressed both in reactive and neoplastic T-cells. BM involvement is easily diagnosed when the involvement is extensive but is more difficult when the neoplastic cells show an interstitial pattern or in cases of a minimal amount of involvement. Moreover, a variety of reactive T-cell proliferations frequently show histological features resembling malignant processes [6]. We evaluated CD3 as an immunohistochemical marker for assessing the extent of BM involvement in PTCL patients and its prognostic impact, and provided a diagnostic guideline for assessing BM involvement in PTCL.
We retrospectively reviewed the electronic medical records of patients diagnosed as having PTCL in Asan Medical Center, Seoul, Korea, between July 1998 and December 2011, and 92 patients met the following inclusion criteria: (i) confirmed diagnosis of PTCL on pathology review, (ii) BM evaluation (right and left sides) for staging work-up performed at diagnosis, (iii) BM blocks available for additional immunohistochemical analysis, and (iv) treatment with cyclophosphamide, doxorubicin, vincristine, and prednisone (CHOP) combination chemotherapy. All patients were staged according to the Ann Arbor system [7], performance status was assigned according to the Eastern Cooperative Oncology Group (ECOG) scale [8], and the International Prognostic Index (IPI) score (with the factors age, performance status, lactate dehydrogenase level, BM involvement) was calculated as previously described [9] (Table 1). The study was approved by the Institutional Review Board of Asan Medical Center (AMC IRB 2012-0084), which is officially accredited by the Forum for Ethical Review Committees in Asia and the Western Pacific.
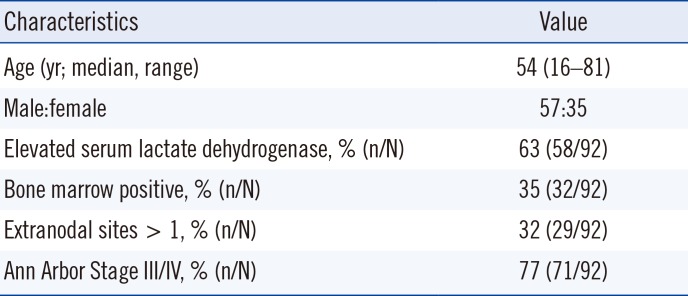
Table 1
Clinical features of patients with peripheral T-cell lymphoma, not otherwise specified
![]()
BM involvement was confirmed by immunohistochemical analysis using monoclonal antibodies specific for CD3 and CD8 (DAKO, Glostrup, Denmark), CD4 and CD20 (NovoCastra, Newcastle, UK), and CD56 (Zymed, Carlsbad, CA, USA), following routine protocols for automated immunohistochemistry on the Ventana Benchmark XT system (Ventana Medical Systems, Tucson, AZ, USA). Two hematopathologists reviewed BM biopsies and graded the staining positivity semi-quantitatively. The proportion of CD3 positivity was graded as 0–10%, 10–25%, 25–50%, 50–75%, and 75–100%, and the number of CD3-positive cells in a cluster was graded as <10, 10–20, 20–30, 30–40, and >40 cells (Fig. 1). In cases showing discrepancy between the right and left sides of BM biopsies, the results with higher grades were used.
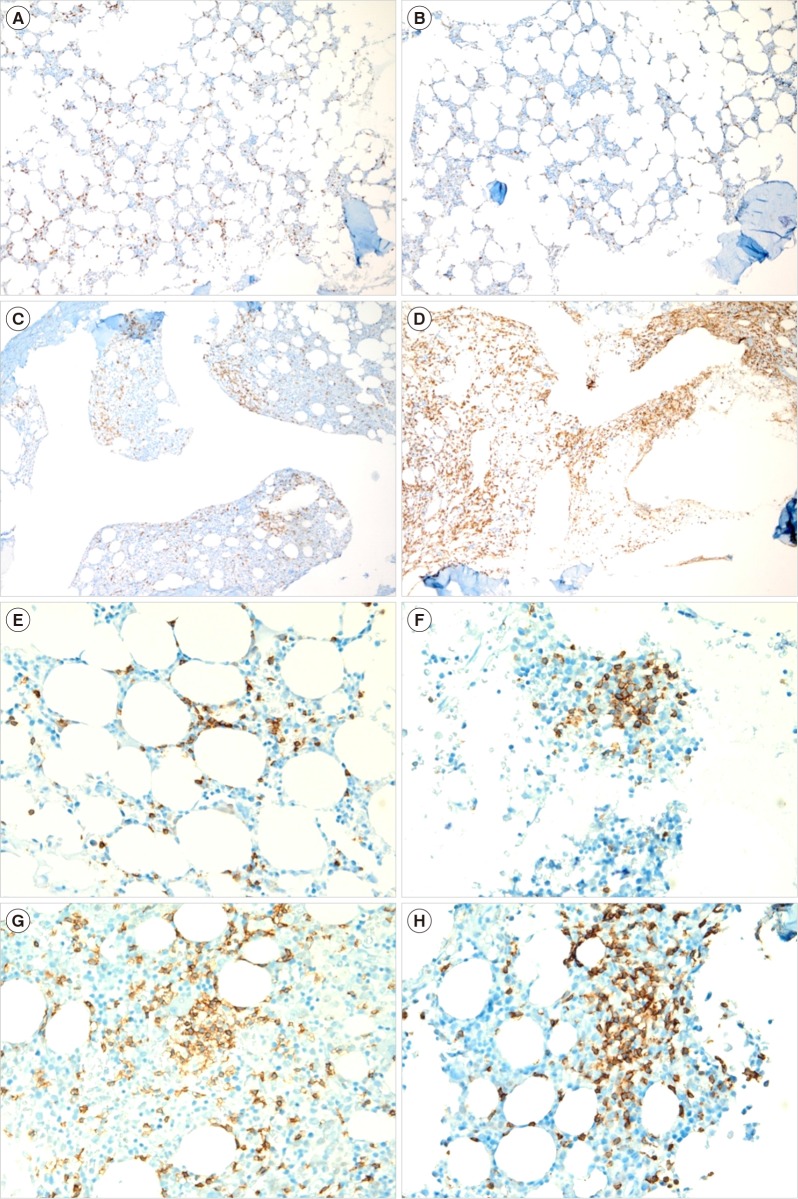 | Fig. 1Representative examples of bone marrow biopsies with various proportions of CD3 positivity in patients with peripheral T-cell lymphoma, not otherwise specified (CD3 immunohistochemical stain, ×100): (A) 10–25%, (B) 26–50%, (C) 51–75%, and (D) 76–100%, and various numbers of CD3-positive cells in a cluster in patients with peripheral T-cell lymphoma, not otherwise specified (CD3 immunohistochemical stain, ×400): (E) <10 cells in a cluster, (F) 21–30 cells, (G) 31–40 cells, and (H) >40 cells.
|
The proportion of CD3-positive cells and the number of CD3-positive cells in a cluster were evaluated to determine the cut-off points at which a significant difference in progression-free survival (PFS) and overall survival (OS) was observed. PFS was dedefined as the time between the first pathological diagnosis and time of relapse, disease progression, or death from any cause. OS was defined as the time from diagnosis until death from any cause. To compare clinical characteristics between the groups assigned based on the proportion of CD3-positive cells and the number of CD3-positive cells, we used an independent t-test for continuous variables and the χ2 test for categorical variables. The Kaplan-Meier method was used to assess PFS and OS, and the log-rank test was used for comparison between groups (Fig. 2). The Cox proportional hazards model was used for multivariate analysis to determine independent predictors of PFS and OS. A receiver operating characteristic (ROC) curve was constructed to calculate the area under curve (AUC) for prediction of BM involvement. All statistical analyses were performed using SPSS version 18.0 for Windows (SPSS Inc., Chicago, IL, USA).
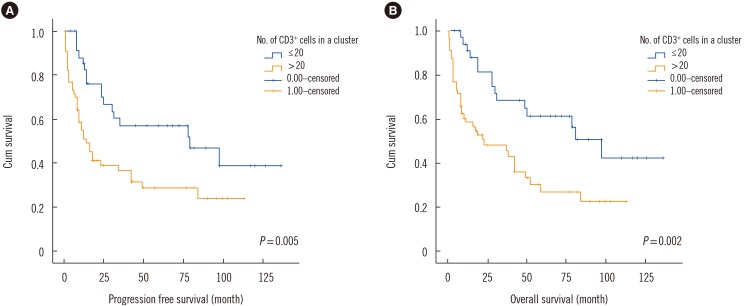
Univariate analysis showed that overall, a CD3-positive cell frequency >25% was associated with a borderline significant difference in PFS and OS compared with a CD3-positive cell frequency below or equal to 25% (P=0.132 and P=0.064, respectively). Having >20 CD3-positive cells in a cluster adversely affected PFS and OS (P=0.005 and 0.002, respectively); thus, the cut-off point for the number of CD3-positive cells in a cluster was 20. The median follow-up duration was 3.5 years, and the 5-year OS for the group with ≤20 CD3-positive cells in a cluster group was 56%, but only 27% for the group with >20 CD3-positive cells in a cluster. The 3-year OS was 65% and 46%, respectively, and the corresponding 3-year PFS was 57% and 32%, respectively.
Multivariate analysis confirmed that >20 CD3-positive cells in a cluster adversely affected PFS and OS, independent of the IPI score. However, when the five individual IPI factors were controlled, >20 CD3-positive cells in a cluster adversely affected only OS and had a borderline significant effect on PFS (Table 2).
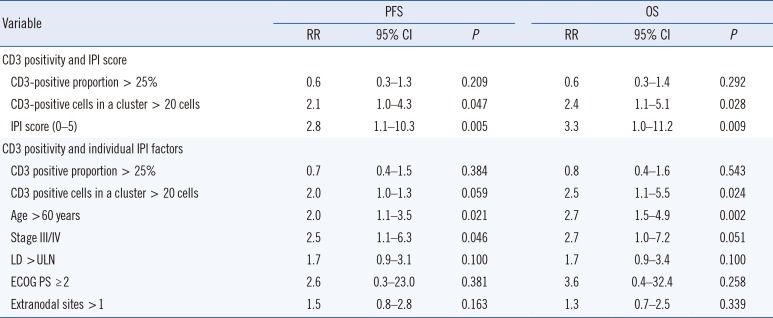
Table 2
Cox proportional hazards analysis of predictors of PFS and OS in peripheral T-cell lymphoma, not otherwise specified
![]()
BM involvement was reported in the initial BM reports for 32 of the 92 patients (34.8%), represented by the paratrabecular involvement and/or the partial or complete effacement of BM space with neoplasm. The AUC of >20 CD3-positive cells in a cluster for agreement with the initial report of BM involvement was 0.686 (95% CI: 0.560–0.813).
Cut-off points for the proportion of positive cells and the number of positive cells in a cluster for CD4 and CD8 were not obtained. In the Kaplan-Meier analysis, >10% positivity of CD20 was associated with poorer OS (P=0.024). However, in the multivariate analysis, the proportion of CD20-positive cells was not significantly associated with PFS or OS. CD56 was negative in all cases.
BM involvement has particular clinical significance in PTCL compared with other malignant lymphomas. Galliamini et al. [10] proposed a new prognostic index of T-cell lymphoma that incorporated three factors of the IPI: age >60 years, Eastern Cooperative Oncology Group (ECOG) performance status ≥2, and elevated serum lactate dehydrogenase, as well as BM involvement. Evaluation of BM involvement is therefore critical for assessing stage and predicting the clinical course of PTCL. This evaluation may be difficult when the neoplastic cells are infiltrated in an interstitial pattern, and the secondary changes in the BM microenvironment may obscure the neoplastic infiltrate [1112]. Moreover, the individual cells of BM-involved PTCL display small to medium-sized lymphocytes compared with the large cells seen in Hodgkin's lymphoma or diffuse large B cell lymphoma. Therefore, the staining pattern and formation of lymphocytic aggregates are valuable factors in the assessment of BM involvement in PTCL.
Various pathological factors have been assessed for application as prognostic indexes in PTCL, including the Ki-67 proliferation index, number of Epstein-Barr virus-positive B cells, and CD56 and CD30 expression [13]. In our study, the IPI score was a significant predictor of OS and PFS, with age and stage of PTCL emerging as the strongest predictors among the IPI prognostic factors (Table 1). Although univariate analysis showed that the proportion of CD3 positivity was an adverse prognostic factor, in the multivariate analysis, only the number of CD3-positive cells in a cluster emerged as an independent predictor of survival after the IPI factors were controlled. We propose >20 CD3-positive cells in a BM biopsy cluster as a candidate indicator for BM involvement in PTCL.
 XML Download