

 PDF
PDF ePub
ePub Citation
 Print
Print


INTRODUCTION
Paroxysmal nocturnal hemoglobinuria (PNH) is an acquired hematopoietic stem cell disease caused by mutation of the PIG-A gene encoding enzymes involved in the biosynthesis of glycosylphosphatidylinositol (GPI)-anchored proteins on red blood cells (RBCs) and white blood cells (WBCs) [12]. Patients with classical PNH with overt (>1%) PNH clones diagnosed by flow cytometry (FCM) can show intravascular hemolysis; however, symptom positivity is correlated with the proportion of cells lacking GPI-anchored proteins [345]. Small PNH clones are present in patients with aplastic anemia (AA) and low-grade myelodysplastic syndrome (MDS), with an incidence of 18.5% (AA)/1.1% (MDS) when a 1% cutoff is applied and 39.5% (AA)/1.8% (MDS) when a 0.01% cutoff is applied [6]. AA patients harboring small PNH clones show better responsiveness to immunosuppressive therapy [78], and 10–25% of these patients exhibit expansion of small PNH clones, which could progress to overt PNH [9]. These results justify the need for PNH testing that can detect small PNH clones with at least 0.01% sensitivity in patients with AA/low-grade MDS.
Many laboratories still use conventional FCM (C-FCM), including the single antigen (CD55 or CD59) gating approach for RBCs and the fluorescein-labeled proaerolysin (FLAER) or CD24 gating approach for granulocytes, which cannot guarantee sufficient sensitivity for the detection of “minor” (0.1–1%) PNH clones [1011]. High sensitivity FCM (HS-FCM) was recently developed for the sensitive detection of minor PNH clones in patients with AA/low-grade MDS as well as the diagnosis of overt PNH. The International Clinical Cytometry Society practical guidelines [12] recommend the application of HS-FCM with a detection sensitivity of 0.01% for granulocytes, monocytes, and RBCs. These guidelines also recommend the use of one lineage-specific marker to avoid false-positive results and minimize the false-negative effect of major RBC aggregates in PNH clone detection, while maintaining a good signal-to-noise ratio and discrimination power of type II and III PNH RBCs from normal RBCs. Further, they recommend the use of two GPI markers, such as FLAER; testing with at least two cell lineages; and a four-color combination using FLAER/CD24/CD15/CD45 and FLAER/CD14/CD64/CD45 for high-resolution detection of granulocyte and monocyte PNH clones with a demonstrated detection sensitivity of at least 0.02% and 0.04% [1213].
HS-FCM has shown satisfactory precision, accuracy, and inter-laboratory agreement rates in measuring PNH clone size [1415]. However, to our knowledge, no study has compared the performance of C-FCM and HS-FCM in diagnosing overt PNH and detecting minor PNH clones in patients with AA/low-grade MDS. We confirmed the superiority of HS-FCM over C-FCM for these purposes, through a prospective analysis.
Go to : 
METHODS
Patient and control selection
We used a total of 23 peripheral blood (PB) samples obtained from 23 prospectively enrolled patients diagnosed as having AA/low-grade MDS (N=15) and overt PNH (N=8) from October 2016 to January 2017 at Pusan National University Hospital, Busan, Korea. AA was diagnosed in 12 patients on the basis of the following criteria: presence of cytopenia×in at least two of three cell lineages (absolute neutrophil counts <1.5×10⁹/L, Hb <1.0×10² g/L, platelets <100×109/L), decreased reticulocytes, and decreased cellularity of <20% in the bone marrow (BM) study. Out of three patients with low-grade MDS, two had MDS with single lineage dysplasia (SLD), and one had MDS with multilineage dysplasia (MLD), according to the 2016 WHO classifications [16]. The eight PNH patients had intravascular hemolysis and cytopenia at diagnosis and showed the presence of overt PNH clones, previously defined by FCM performed at diagnosis. The detailed clinical and demographic data of the patients, including complete blood count results, are summarized in Table 1.
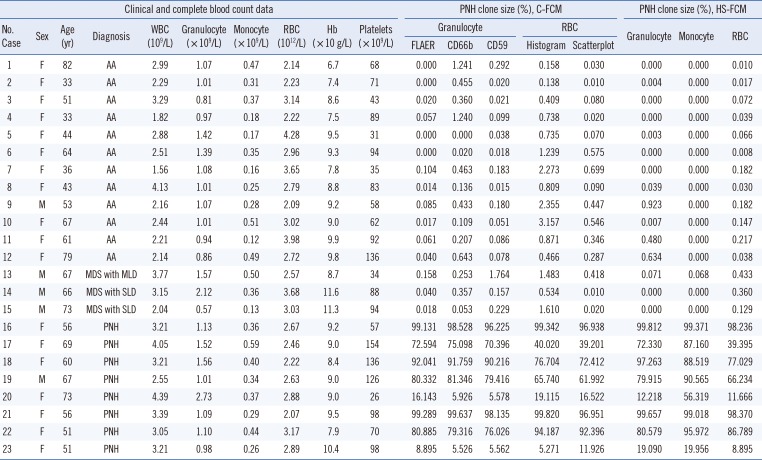
Table 1
Results of C-FCM and HS-FCM in 23 patients with aplastic anemia/myelodysplastic syndrome and paroxysmal nocturnal hemoglobinuria
Abbreviations: M, male; F, female; WBC, white blood cell; RBC, red blood cell; Hb, hemoglobin; C-FCM, conventional flow cytometry; HS-FCM, high sensitivity flow cytometry; FLAER, fluorescein-labeled proaerolysin; PNH, paroxysmal nocturnal hemoglobinuria; MDS, myelodysplastic syndrome; SLD, single lineage dysplasia; MLD, multilineage dysplasia; AA, aplastic anemia; CD, cluster of differentiations.
![]()
In addition, 41 PB samples were obtained from 41 healthy controls (median age: 38 years [range 23–52 years], 23 males and 18 females). Written informed consent was obtained from all patients and healthy controls. This study was approved by the Institutional Review Board of Pusan National University Hospital (Approval Number: 2015-001).
FCM
C-FCM and HS-FCM were performed simultaneously in all samples,
using a Navios flow cytometer (Beckman Coulter, Miami, FL, USA). In C-FCM, granulocytes were gated using a CD45-PerCP (peridinin chlorophyll protein complex)/(side scatter) SS scatterplot, and the PNH clones among the granulocytes were enumerated independently from the scatterplot using three different GPI markers (FLAER-FITC [Fluorescein isothiocyanate, Cedar Lane Laboratories, Burlington, Ontario, Canada]: CD45+/FLAER−, CD66b-FITC [clone 80H3, Beckman Coulter]: CD45+/CD66b− and CD59-FITC: CD45+/CD59−). RBCs were gated using an FS/SS scatterplot, and the CD59 deficient PNH clones among the RBCs were enumerated based on both the histogram and scatterplot.
In HS-FCM, granulocytes were gated using additional lineage specific markers CD15-PC7 (phycoerythrin-cyanine 7, clone 80H5, Beckman Coulter)+/(SS) followed by CD45-PerCP (peridinin chlorophyll protein complex)+/SS scatterplot. The PNH clones among the granulocytes were enumerated using two GPI markers (CD24-PE [phycoerythrin], clone ALB9, Beckman Coulter, and FLAER-FITC) and the CD24-/FLAER-scatterplot. RBC singlets were gated using an additional lineage specific marker CD235a-FITC (clone KC16, Beckman Coulter)+/forward scatter (FS) followed by FS/SS scatterplot. The PNH clones among the RBCs were enumerated using the CD59-PE (clone MEM43, Invitrogen, Carlsbad, CA, USA)-/CD235a-FITC+ scatterplot. Monocytes were gated using an additional lineage specific marker CD64-PE (clone 22, Beckman Coulter)+/SS followed by the CD45-PerCP/SS scatterplot, and the PNH clones among the monocytes were enumerated using two GPI markers (CD14-PC7 [clone RMO52, Beckman Coulter] and FLAER-FITC) using the CD14-/FLAER- scatterplot. HS-FCM was performed as described previously [1718].
The modified sample preparation procedure for RBC analysis by HS-FCM was as follows: 100 µL of 1:100 diluted EDTA-anticoagulated PB samples were mixed by vortexing with the undiluted monoclonal antibody (CD235: 2 µL; CD59: 1 µL; CD15: 20 µL; other antibodies: 10 µL per test). Following incubation in the dark at 25℃ for 20 minutes, the samples were washed and resuspended with phosphate-buffered saline and then analyzed by FCM. The sample preparation procedure for granulocyte and monocyte analysis by HS-FCM was similar to that for the RBCs, except that lysing reagents Immunoprep (Beckman Coulter) were used prior to the washing and resuspension procedure. The lower limit of detection (LOD), defined as the minimum percentage detectable above background, was calculated as for HS-FCM, using the equation detailed in recent guidelines [17]. The sensitivity of HS-FCM was evaluated using a 10-fold serial dilution assay with an undiluted PNH sample and a normal sample.
PNH clone incidence and size in healthy controls
HS-FCM was performed in 41 healthy control samples to assess PNH clone incidence and PNH clone size in healthy controls. The results were compared with those from a previous study [17].
Statistical analysis
In 23 patient samples, PNH clone sizes obtained from three different cell lineages (granulocytes, RBCs, and monocytes) using HS-FCM were compared by Passing-Bablok regression and Bland-Altman analysis. Granulocytic PNH clone size obtained using C-FCM with three different GPI markers (FLAER, CD66b, and CD59) and HS-FCM, and RBC PNH clone size obtained using C-FCM with histograms and scatterplots and HS-FCM were also compared by same analysis. Subsequently, the C-FCM and HS-FCM results were compared focusing on the detection of minor PNH clones in AA/low-grade MDS patients and the detection of overt PNH clones in PNH patients. In the Bland-Altman analysis, mean difference, lower and upper limits of agreement (mean difference±1.96 SD) and their 95% confidence intervals (CIs), and P values were calculated. Spearman's rank correlation analysis was performed to examine relationships among granulocytic and RBCs PNH clone sizes obtained by C-FCM and HS-FCM, and PNH clone sizes of three cell lineages obtained by HS-FCM. All analyses were two-tailed. P≤0.05 were considered statistically significant. MedCalc version 18.2.1 (MedCalc Software, Ostend, Belgium) was used for all analyses.
Go to :
RESULTS
LOD and sensitivity of HS-FCM
The LODs of HS-FCM were 0.006% (RBCs), 0.032% (granulocytes), and 0.141% (monocytes). The lowest detectable results of HS-FCM were 0.002% for RBCs (at a 1:10,000 dilution, 23 events detected), 0.010% for granulocytes (at a 1:10,000 dilution, 11 events detected), and 0.071% for monocytes (at a 1:1,000 dilution, 10 events detected).
PNH clone incidence and size in healthy controls
In the 41 healthy control samples, PNH clones were detected in the granulocytes, monocytes, and RBCs of nine, three, and 10 samples, respectively. The median number of PNH clones in the detected samples was four (range: 2–8), one, and nine (range: 2–18) in the granulocytes, monocytes, and RBCs, respectively. The median PNH clone size was 0.006% (range: 0.003–0.009%), 0.007% (range: 0.003–0.008%), and 0.004% (range 0.001–0.009%) for granulocytes, monocytes, and RBCs, respectively. There were no samples with PNH clone size >0.01% in the healthy controls.
The median acquisition events of C-FCM and HS-FCM in patient samples
The median number of acquisition events using the 23 patient samples was 10,064 (range: 9,995–10,297) and 7,239 (range: 4,681–10,975) for RBCs and granulocytes by C-FCM and 301,329 (range: 299,714–316,257), 61,598 (range: 60,242–62,767), and 14,147 (range: 11,476–21,868) for RBCs, granulocytes, and monocytes, respectively by HS-FCM.
Comparison of HS-FCM results obtained from three cell lineages
The results of the three cell lineages obtained by HS-FCM are described in Table 1. Very strong correlations (γ=0.9469–0.9786) were observed between the PNH clone sizes obtained from the three cell lineages of the 23 patient samples (Fig. 1A-C). However, monocyte PNH clone size was greater than RBC PNH clone size, with a mean difference of 6.5% (P=0.0366). Granulocyte PNH clone size was also greater than RBC PNH clone size, with a mean difference of 3.2% (P=0.0812). Although the monocyte PNH clone size was greater than the granulocytic PNH clone size with a mean difference of 3.2%, the difference was not statistically significant (Fig. 1D-F).
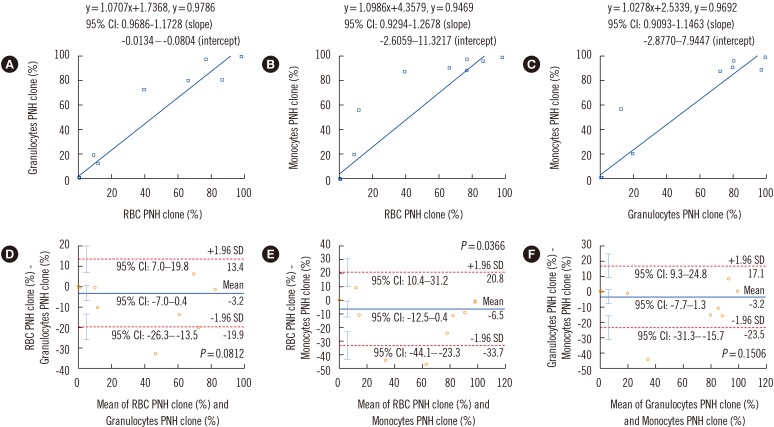 | Fig. 1Comparison of high sensitivity flow cytometry results obtained from three cell lineages (granulocytes, monocytes, and RBCs). Results are compared using Passing-Bablok regression analysis (A-C) and Bland-Altman analysis (D-F). Regression equations, correlation coefficients, and 95% CIs for the slope and intercept of the equations are shown in A-C. In the Bland-Altman analysis, mean difference (indicated by the blue horizontal line), lower and upper limits of agreement (indicated by the red dotted horizontal lines), and their 95% CIs (indicated by the cyan vertical bars) are presented in D-F.Abbreviations: RBC, red blood cell; PNH, paroxysmal nocturnal hemoglobinuria; CI, confidence interval.
|
None of the AA/low-grade MDS samples had >1% PNH clones in all three cell lineages; however, eight (53.3%) samples showed the presence of minor PNH clones in one or more cell lineages (Table 1). In the PNH samples, the granulocyte and monocyte PNH clone sizes were greater than the RBC PNH clone size, with a mean difference of 9.3% (P=0.0042) and 18.8% (P=0.0001), respectively.
Comparison of C-FCM and HS-FCM results for granulocytes
The granulocyte results using three different GPI markers obtained by C-FCM are presented in Table 1. A very strong correlation (γ=0.9962–0.9968) was observed between the granulocyte PNH clone size of the 23 patient samples calculated by C-FCM and HS-FCM (Fig. 2A-C). C-FCM using CD59 showed a smaller granulocyte PNH clone size than HS-FCM, with a mean difference of 1.7% (P=0.0301). C-FCM using both FLAER and CD66b also showed a trend for smaller granulocyte PNH clone size than HS-FCM, with a mean difference of 0.7% and 0.9%, respectively (Fig. 2D-F).
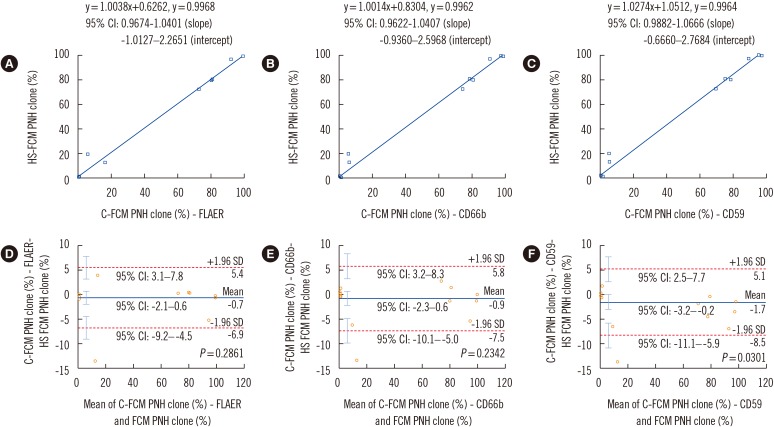 | Fig. 2Comparison of C-FCM granulocyte PNH clone size results with three different GPI markers and HS-FCM. Results are compared using Passing-Bablok regression analysis (A-C) and Bland-Altman analysis (D-F). Regression equations, correlation coefficients, and 95% CIs for the slope and intercept of the equations are shown in (A-C). In the Bland-Altman analysis, mean difference (indicated by the blue horizontal line), lower and upper limits of agreement (indicated by the red dotted horizontal lines), and their 95% CIs (indicated by the cyan vertical bars) are presented in (D-F).Abbreviations: HS-FCM, high sensitivity flow cytometry; C-FCM, conventional flow cytometry; PNH, paroxysmal nocturnal hemoglobinuria; FLAER, fluorescein-labeled proaerolysin; CD, cluster of differentiations; CI, confidence interval.
|
Of the 15 AA/low-grade MDS samples, two (13.3%) and one (6.7%) showed >1% granulocyte PNH clones using C-FCM with CD66b and CD59, respectively; however, these three samples showed negative results using HS-FCM. HS-FCM showed the presence of minor granulocyte PNH clones (median 0.634%, range: 0.480–0.923%) in three (20.0%) samples. Seven (46.7%) samples showed minor granulocyte PNH clones using ≥1 C-FCM, but all of these samples showed negative results using HS-FCM (Table 1). In the PNH samples, smaller granulocyte PNH clone size was observed in C-FCM than in HS-FCM, with a mean difference of 1.9–5.0% (P=0.0008–0.0412).
Comparison of C-FCM and HS-FCM results for RBCs
The RBC results using the histogram and scatterplot obtained by C-FCM are presented in Table 1. Very strong correlations (γ=0.9982–0.9983) were observed between the RBC PNH clone size obtained by C-FCM and HS-FCM (Fig. 3A, B). C-FCM with the histogram showed greater RBC PNH clone size than HS-FCM, with a mean difference of 1.5% (P=0.0018). C-FCM with the scatterplot also showed a trend for greater RBC PNH clone size than HS-FCM (mean difference of 0.1%) (Fig. 3C, D).
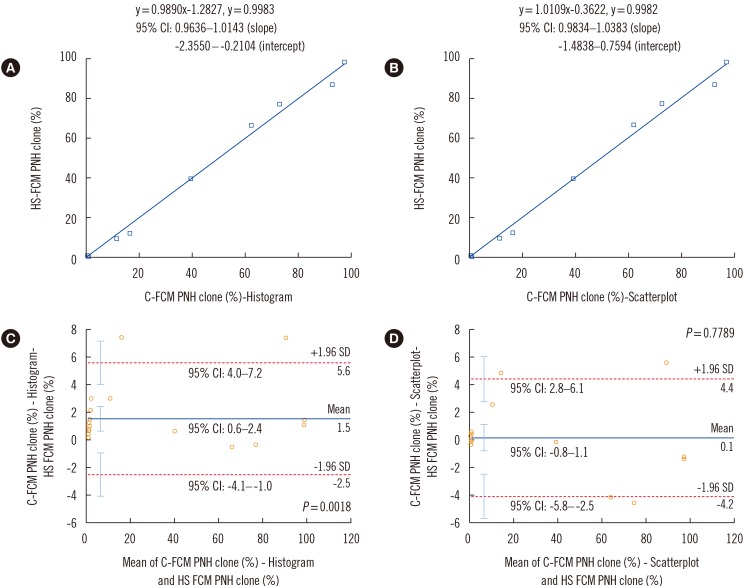 | Fig. 3Comparison of C-FCM RBC PNH clone size results with scatterplot and histogram and HS-FCM. Results were compared by means of Passing-Bablok regression analysis (A-B) and Bland-Altman analysis (C-D). Regression equations, correlation coefficients, and 95% CIs for the slope and intercept of the equations are shown in (A) and (B). In the Bland-Altman analysis, mean difference (indicated by the blue horizontal line), lower and upper limits of agreement (indicated by the red dotted horizontal lines), and their 95% CIs (indicated by the cyan vertical bars) are presented in (C) and (D).Abbreviations: RBC, red blood cell; HS-FCM, high sensitivity flow cytometry; C-FCM, conventional flow cytometry; PNH, paroxysmal nocturnal hemoglobinuria; CI, confidence interval.
|
None of the 15 AA/low-grade MDS samples exhibited >1% RBC PNH clones using HS-FCM; however, C-FCM with the histogram demonstrated >1% RBC PNH clones in six (40.0%) samples. HS-FCM showed minor RBCs PNH clones in seven (46.7%) samples, and all these samples also showed identical results in C-FCM with the scatterplot. However, nine (60.0%) samples showed minor RBCs PNH clones using C-FCM with the histogram; of these, six samples showed negative results using HS-FCM (Table 1). In the PNH samples, RBC PNH clone size was greater by C-FCM with the histogram than by HS-FCM, with a mean difference of 2.5% (P<0.0001).
Go to :
DISCUSSION
In our comparison of the performance of C-FCM and HS-FCM, we demonstrated that HS-FCM did not produce any false-positive results for healthy controls when a 1% cutoff value was applied. These results indicate that cases of overt PNH misdiagnosis could be eliminated in healthy controls using HS-FCM, which can reduce unnecessary treatment or follow-up testing in patients without overt PNH clones. In the evaluation of PNH clone size in healthy controls, no samples had PNH clone size >0.01%, and PNH clone size for RBCs and granulocytes was higher than that reported previously [17]. That study also reported two to six cells and two cells per 1,000,000 acquired gated events in RBCs and granulocytes, respectively.
HS-FCM detected minor PNH clones at a frequency of 53.3% in AA/low-grade MDS patients when three cell lineages were simultaneously examined. In addition, HS-FCM detected greater PNH clone size in granulocytes and monocytes than in RBCs. Our results support previous findings [15] and could be partially due to the higher sensitivity of RBCs to complement-mediated lysis (which can occur in patients with PNH) compared with granulocytes and monocytes. Our results also support the need for simultaneous detection of PNH clones in monocytes and granulocytes, as well as in RBCs, for sensitive PNH diagnosis when HS-FCM is applied, especially in cases with expected massive hemolysis, in which the detectable RBC PNH clones would be significantly reduced.
We found that HS-FCM can detect a significantly greater granulocytic PNH clone size than C-FCM using CD59 and also tends to detect a greater granulocytic PNH clone size than C-FCM with both FLAER and CD66b. These differences are significant, especially in PNH patients. HS-FCM could eliminate the false-positive rates of 6.7–13.3% recorded for the detection of overt granulocyte PNH clones in AA/low-grade MDS patients by C-FCM. HS-FCM could also detect minor granulocytic PNH clones with at a frequency of 20.0% in these patients. Taken together, these results indicate that HS-FCM would be more useful in detecting minor granulocytic PNH clones with higher sensitivity in AA/low-grade MDS patients and reducing false positivity in detecting overt PNH clones compared with C-FCM.
We determined that HS-FCM can detect significantly smaller RBC PNH clone sizes than C-FCM, if the RBCs PNH clone size is calculated from the histogram. These differences are reduced when the calculation is based on the scatterplot. These results are in contrast to the granulocyte results. We suggest that as the inclusion of non-RBC or platelet debris occurs more frequently in RBC gating than in granulocyte gating (owing to size similarity), the lineage specific marker CD235a used for RBCs is more important than CD15 used for granulocytes, and essential for reducing false positivity in the detection of PNH clones, as supported by previous studies [1112]. Moreover, we found that in AA/low-grade MDS patients, HS-FCM could eliminate the 40.0% false positivity identified in the detection of overt RBC PNH clones and minor RBC PNH clones using C-FCM with the histogram, and could detect minor RBC PNH clones with a frequency of 46.7%. These results further support the use of HS-FCM instead of C-FCM.
Our study has some limitations. We could not analyze PIG-A gene mutation to confirm the presence of minor PNH clones in patients with AA/low-grade MDS. This may limit the interpretation of our results in terms of sensitivity/specificity. Another limitation is the low patient numbers, which could significantly influence our study's statistical power. More comprehensive studies including a greater number of patients and PIG-A gene mutation analysis are required to confirm our findings.
In conclusion, HS-FCM could be useful for sensitive detection of minor PNH clones as well as for reducing C-FCM false-positive minor PNH clone cases in AA/low-grade MDS patients.
Go to :
 XML Download