

 PDF
PDF ePub
ePub Citation
 Print
Print


INTRODUCTION
Lower urinary tract symptoms (LUTS) as description for complex clinical symptoms of bladder, prostate, and urethra disorders are the most frequent urologic disease in elderly men, often combined with benign prostatic hyperplasia (BPH). Along with the progressive decline of testosterone (T) in men as part of the aging process, there is a gradual increase in prostate volume and development of BPH and LUTS [1].
The prevalence of LUTS/BPH rises with age with significant implications on quality of life (QOL) and overall health. From prospective US studies incidence and progression rates were observed to increase steeply with age, with progression rates being higher than incidence rates [2]. Prevalence of LUTS is reported for among 15% to 60% of all men aged above 40 years of age [3]. Besides the decrease in QOL for patients, LUTS represents a costly public health issue and as such can be seen as serious matter with respect to an aging global population.
The pathogenesis of both LUTS and BPH is complex and multifactorial. Generally, BPH is considered a common etiology of LUTS but this is not an inevitable correlation. The association between LUTS and obesity, metabolic syndrome (MetS), and erectile dysfunction is established at epidemiological level [45]. As potential biological mechanism prostatic inflammation resulting from the immunologic response of pathogenic noxae is discussed to be involved in the development and progression of chronic prostatic diseases such as BPH [67]. The MetS may influence the prostate microenvironment and thus, is suggested to be involved in LUTS pathogenesis [89]. Another hypothesis focuses on the obesity-related increase of intra-abdominal pressure leading to venous hypertension, one-way valvular damage, increased venous backflow pressure, and finally prostatic growth [10].
Besides non-modifiable risk factors such as age, geography, and genetics, the pathophysiology of LUTS/BPH also seems to be driven by modifiable risk factors, such as serum dihydrotestosterone, obesity, elevated fasting glucose and diabetes [23]. As all these factors often occur in combination with T deficiency, functional hypogonadism might act as part of a causal relationship.
In fact, androgenic hormones, such as T are strongly involved in the cellular mechanisms of the lower urinary tract. Androgen receptors are present in the epithelium of the urethra and bladder. T is jointly responsible for function and forming of smooth muscles and the enzymes contained therein. Via stimulation of the nitric oxide synthase (NOS) T modulates the production of nitric oxide (NO) which plays a crucial role for prostatic innervation and smooth muscle relaxation, and dilatation of urethra and bladder neck. This mechanism of T-induced NO smooth muscle relaxation is also reflected in the effect of phosphodiesterase-5 (PDE-5) inhibitors used as effective treatment of LUTS/BPH. While PDE-5 interacts with NOS with the effect to reduce NO production, the use of PDE-5 inhibitors consequently leads to an up-regulation of NO production [111].
The involvement of T in the lower urinary tract suggests a physiological correlation between T and LUTS. Lack of T may be a risk factor for LUTS/BPH suggesting a causal link between hypogonadism and incidence of LUTS/BPH [11].
Aiming at a deeper understanding of the correlation between hypogonadism and LUTS and the effects of testosterone therapy (TTh) relating thereto we analyzed data from a registry study of hypogonadal men under long-term TTh who showed mild respectively moderate-to-severe LUTS at baseline.
MATERIALS AND METHODS
1. Patients
An observational, prospective, cumulative, ongoing registry study is performed in 805 symptomatic hypogonadal men with a baseline total T level of ≤12.1 nmol/L.
Patients who agreed to start TTh were treated with injections of T undecanoate (intramuscular injections at 3-month-intervals after an initial 6-week interval). Patients who decided against TTh served as controls.
Ethical guidelines by the German ‘Ärztekammer’ (German Medical Association) for observational studies in patients receiving standard treatment were followed. After receiving an explanation about the nature and the purpose of the study, all subjects consented to be included in the registry and have their data analyzed.
LUTS severity was categorized based on the International Prostate Symptom Score (IPSS). At baseline, mild IPSS (<8) was recorded in 615 patients, of which 253 underwent TTh and 362 served as controls. Moderate-to-severe IPSS (8–19) was recorded in 190 patients, of which 159 underwent TTh and 31 served as controls.
In the mild IPSS group, median follow-up was 8 (TTh patients) and 9 years (control), respectively. In the moderate-to-severe IPSS group, median follow-up was 9 (TTh-group) resp. 8 years (control).
2. Assessment and follow-up
Anthropometric parameters (weight, waist circumference [WC], body mass index [BMI]), urinary function parameters (IPSS, post-voiding residual volume), prostate parameters (prostate volume, prostate specific antigen [PSA]), lipids and glycemic control (total cholesterol, high density lipoprotein [HDL], low density lipoprotein [LDL], triglycerides, HbA1c, fasting glucose), blood pressure (systolic/diastolic), C-reactive protein (CRP), and QOL (Aging Males' Symptoms, AMS) were measured in the TTh-group at their 3-months visits for T injection, data from the controls at their biannual routine visits.
3. Statistical methods
Statistical methods were described elsewhere [12]. Briefly, data in both groups were averaged across each year and yearly data used to assess differences between groups while adjusting for possible confounding. Mean changes over time between groups were compared by a mixed effects model for repeated measures, with a random effect for intercept and fixed effects for time, group and their interaction. Changes were adjusted for covariates age, weight, WC, BMI, fasting glucose, blood pressure, lipids and AMS to account for baseline differences between the two groups.
RESULTS
In the mild IPSS group, mean age at baseline was 60.0±7.0 years (TTh-group: 54.6±7.4; control: 63.6±4.8). In the moderate-to-severe IPSS group, mean age at baseline was 63.0±4.0 years (TTh-group: 62.6±4.3; control: 65.3±4.8). The vast majority of patients in both groups showed overweight respectively obesity. Concomitant medication included α-blockers, 5α-reductase inhibitors, and PDE-5 inhibitors. A detailed description of baseline characteristics is presented in Table 1.
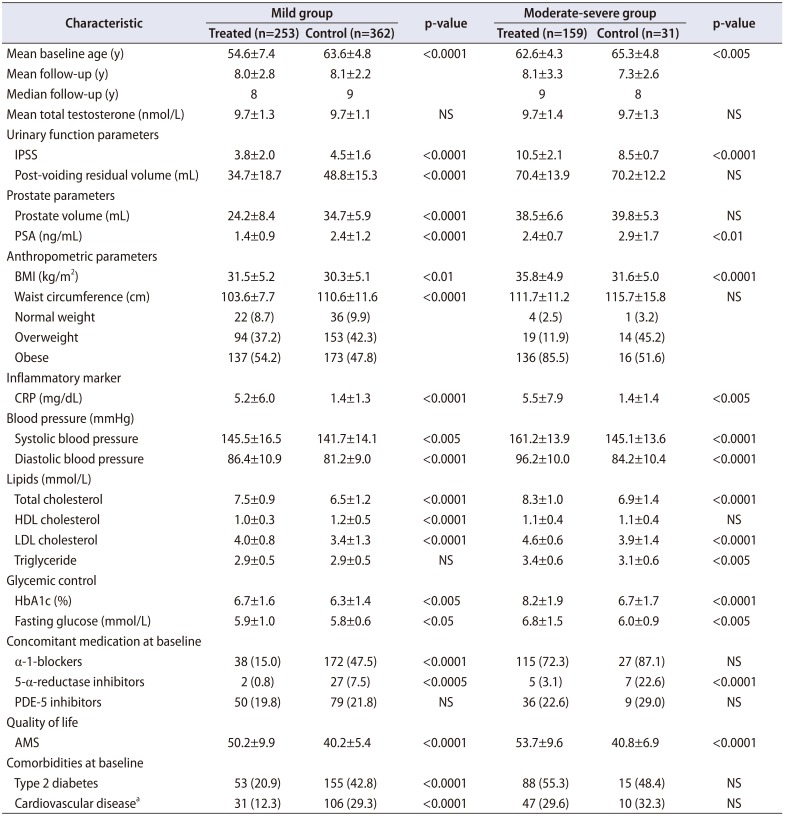
Table 1
Baseline characteristics, comorbidities and concomitant medication at baseline in mild and moderate-severe IPSS groups
Values are presented as mean±standard deviation, number only, or number (%).
IPSS, International Prostate Symptom Score; PSA, prostate specific antigen; BMI, body mass index; CRP, C-reactive protein; HDL, high density lipoprotein; LDL, low density lipoprotein; PDE-5, phosphodiesterase-5; AMS, Aging Males' Symptoms; NS, not significant.
a:Cardiovascular disease was defined as prior myocardial infarction, stroke, or diagnosis of coronary artery disease.
![]()
1. Urinary function parameters
In both TTh-subgroups, mean IPSS decreased constantly throughout the follow-up (Fig. 1A). In the mild IPSS group, mean IPSS decreased from 3.8±2.0 to 1.4±0.7. In the moderate-to-severe IPSS group, IPSS decreased from 10.5±2.1 to 2.4±0.9. In contrast, for patients in the control-groups the mean IPSS values increased steadily from 4.5±1.6 to 6.8±2.2 (mild IPSS group) and from 8.5±0.7 to 8.8±3.2 (moderate-to-severe IPSS), respectively.
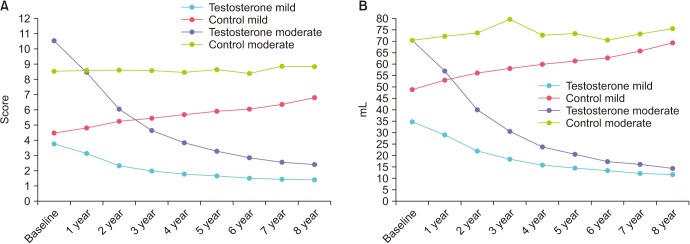
Mean post-voiding residual (PVR) volume decreased in all patients under TTh from 34.7±18.7 to 11.0±4.0 mL (mild IPSS group) and from 70.4±13.9 to 14.0±4.0 mL (moderate-to-severe IPSS group) (Fig. 1B). The control-groups showed an increase from 48.8±15.3 to 69.0±21.0 mL (mild IPSS group) and from 70.2±12.2 to 75.0±25.0 mL (moderate-to-severe IPSS group).
2. Prostate parameters
Mean prostate volume was 24.2±8.4 mL at baseline and 24.3±7.2 mL after 8 years in the TTh-group with mild IPSS and slightly increased from 38.5±6.6 to 40.3±7.2 mL in the TTh- group with moderate-to-severe IPSS. In the control-groups, there were modest increases from 34.7±5.9 to 36.3±5.9 mL (mild IPSS) and from 39.8±5.3 to 41.1±5.2 mL (moderate-to-severe IPSS) (Fig. 2A).
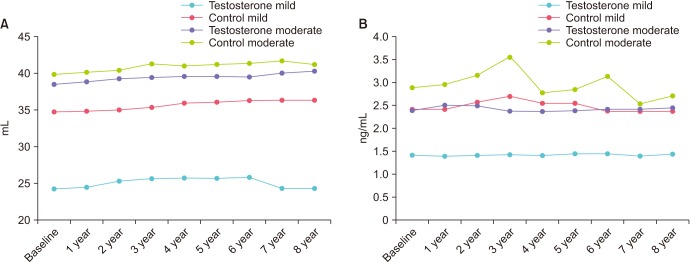
Mean PSA was 1.4±0.9 ng/mL at baseline and 1.4±0.8 ng/mL after 8 years in the TTh-group with mild IPSS and 2.4±0.7 at baseline and 2.4±0.6 mL after 8 years in the TTh-group with moderate-to-severe IPSS. In the control-groups, PSA remained equally stable (Fig. 2B).
3. Anthropometric parameters
For all patients under TTh a constant loss of weight was noted throughout the observation period. Mean body weight decreased from 99.0±16.0 to 84.7±8.1 kg in patients with mild IPSS, and from 111.9±15.1 to 91.0±8.3 kg in patients with moderate-to-severe IPSS. The control-groups showed a slight weight increase from 94.4±12.5 to 94.6±10.1 kg (mild IPSS) and a decrease from 98.0±15.4 to 90.2±9.0 kg (moderate-to-severe IPSS), respectively (Fig. 3A). Mean BMI decreased in TTh-patients from 31.5±5.2 to 27.0±2.8 kg/m2 (mild IPSS group) and from 35.8±4.9 to 29.2±2.8 kg/m2 (moderate-to-severe IPSS group). The control-groups showed stable BMI from 30.3±5.1 to 30.3±3.5 kg/m2 (mild IPSS) and a decrease from 31.6±5.0 to 29.3±2.8 kg/m2 (moderate-to-severe IPSS), respectively (Fig. 3B). Percent weight decreased in TTh-patients with mild IPSS by 17.0±7.6% and by 19.1±7.1% in patients with moderate-to-severe IPSS. Control-groups showed a weight increase by 4.5±3.6% and 2.2±4.5%, respectively (Fig. 3C). WC in TTh-patients with mild IPSS decreased from 103.6±7.7 to 96.0v5.0 cm and from 111.7±11.2 to 99.4±6.2 cm for TTh-patients with moderate-to-severe IPSS (Fig. 3D). Control-groups showed a decline in WC from 110.6±11.6 to 109.7±7.8 cm (mild IPSS) and from 115.7±15.8 to 106.5±5.9 kg (moderate-to-severe IPSS), respectively.
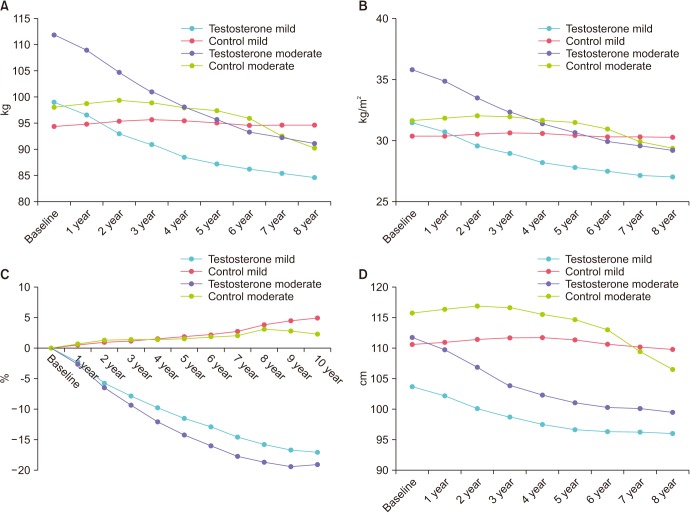
Fig. 3
Anthropometric measures: (A) Body weight, (B) body mass index, (C) percent weight loss, and (D) waist circumference in men with mild IPSS under TTh and untreated controls, and in men with moderate-to-severe IPSS under TTh and untreated controls. IPSS, International Prostate Symptom Score; TTh, testosterone therapy.
![]()
4. CRP
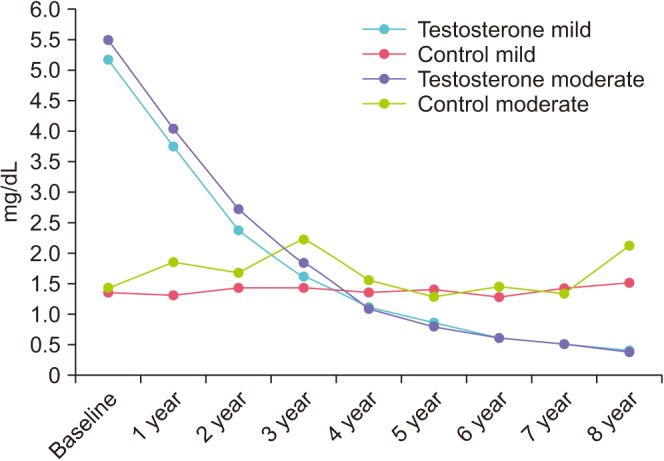
At baseline, both TTh-groups showed elevated CRP values of 5.2±6.0 and 5.5±7.9 mg/dL. During TTh, CRP decreased to <0.5 mg/dL. In controls, CRP increased from 1.4±1.3 to 1.5±1.6 mg/dL (mild IPSS group) and from 1.4±1.4 to 2.1±2.2 (moderate-to-severe IPSS group) (Fig. 4).
5. QOL
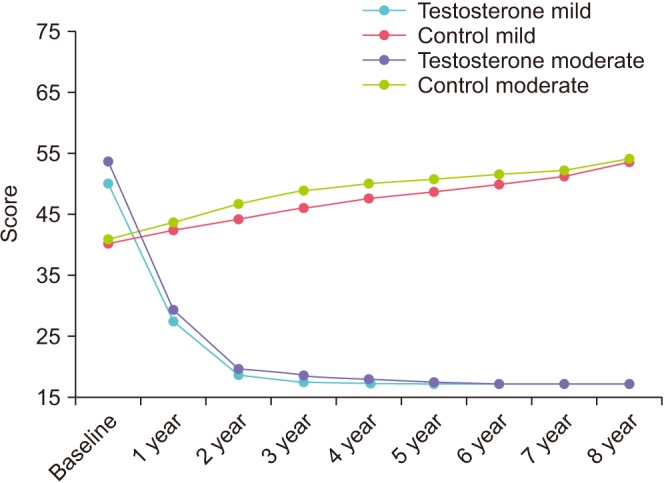
In the TTh groups, AMS decreased from 50.2±9.9 to 17.2±0.5 (mild IPSS group) and from 53.7±9.6 to 17.2±0.3 (moderate-to-severe IPSS group). Control-groups showed an increase from 40.2±5.4 to 53.6±4.7 (mild IPSS) and from 40.8±6.9 to 54.0±3.8 (moderate-to-severe IPSS) (Fig. 5).
6. Metabolic parameters
In the TTh-groups, total cholesterol decreased from 7.5±0.9 to 5.1±0.2 mmol/L (mild IPSS group) and from 8.3±1.0 to 5.3±0.3 mmol/L (moderate-to-severe IPSS group). Control-groups showed an increase in total cholesterol from 6.5±1.2 to 7.3±1.2 mmol/L (mild IPSS) and from 6.9±1.4 to 7.2±1.3 mmol/L (moderate-to-severe IPSS) (Supplementary Fig. 1A). In the TTh-groups, HDL increased from 1.0±0.3 to 1.3±0.3 mmol/L (mild IPSS group) and from 1.1±0.4 to 1.5±0.4 mmol/L (moderate-to-severe IPSS group). Control-groups showed little change in HDL from 1.2±0.5 to 1.2±0.6 mmol/L (mild IPSS) and from 1.1±0.4 to 1.0±0.6 mmol/L (moderate-to-severe IPSS) (Supplementary Fig. 1B). In the TTh-groups, LDL decreased from 4.0±0.8 to 2.6±0.4 mmol/L (mild IPSS group) and from 4.6±0.6 to 2.8±0.2 mmol/L (moderate-to-severe IPSS group). Control-groups showed an increase in LDL from 3.4±1.3 to 4.1±1.3 mmol/L (mild IPSS) and from 3.9±1.4 to 4.3±1.6 mmol/L (moderate-to-severe IPSS) (Supplementary Fig. 1C). In the TTh-groups, triglyceride decreased from 2.9±0.5 to 2.1±0.1 mmol/L (mild IPSS group) and from 3.4±0.6 to 2.2±0.1 mmol/ L (moderate-to-severe IPSS group). Control-groups showed an increase in triglyceride from 2.9±0.5 to 3.3±0.5 mmol/L (mild IPSS) or remained stable from 3.1±0.6 to 3.1±0.6 mmol/L (moderate-to-severe IPSS) (Supplementary Fig. 1D).
In the TTh-groups, fasting glucose decreased from 5.9±1.0 to 5.3±0.1 mmol/L (mild IPSS group) and from 6.8±1.5 to 5.3±0.1 mmol/L (moderate-to-severe IPSS group). Control-groups showed an increase from 5.8±0.6 to 6.1±1.0 mmol/L (mild IPSS) and from 6.0±0.9 to 6.2±0.9 mmol/L (moderate-to-severe IPSS) (Supplementary Fig. 2A). In the TTh-groups, HbA1c decreased from 6.7±1.6% to 5.6±0.6% (mild IPSS group) and from 8.2±1.9% to 5.9±0.5% (moderate-to-severe IPSS group). Control-groups showed an increase in HbA1c from 6.3±1.4% to 7.2±2% (mild IPSS) and from 6.7±1.7% to 6.8±1.6% (moderate-to-severe IPSS) (Supplementary Fig. 2B).
7. Blood pressure
In the TTh-groups, systolic blood pressure decreased from 145.5±16.5 to 128±5.7 mmHg (mild IPSS group) and from 161.2±13.9 to 130±5.8 mmHg (moderate-to-severe IPSS group). Control-groups showed an increase from 141.7±14.1 to 144.7±11.6 mmHg (mild IPSS) and a decrease from 145.1±13.6 to 143.3±10.3 mmHg (moderate-to-severe IPSS) (Supplementary Fig. 3A). In the TTh-groups, diastolic blood pressure decreased from 86.4±10.9 to 77.9±34.2 mmHg (mild IPSS group) and from 96.2±10.0 to 75.8±4.2 mmHg (moderate-to-severe IPSS group). Control-groups showed an increase from 81.2±9.0 to 84.3±8.8 mmHg (mild IPSS) and a decrease from 84.2±10.4 to 83.9±6.7 mmHg (moderate-to-severe IPSS) (Supplementary Fig. 3B).
8. Testosterone
In the TTh-groups, total T increased from 9.7±1.3 to 18.1±1.5 nmol/L (mild IPSS group) and from 9.7±1.4 to 17.8±1.5 nmol/L (moderate-to-severe IPSS group). Control-groups showed a decrease from 9.7±1.1 to 8.5±1.3 nmol/L (mild IPSS) and from 9.7±1.3 to 8.0±1.2 nmol/L (moderate-to-severe IPSS) (Supplementary Fig. 4).
For all parameters, estimated adjusted differences between TTh groups and untreated controls for patients with mild respectively moderate-to-severe IPSS baseline values are summarized in Table 2.
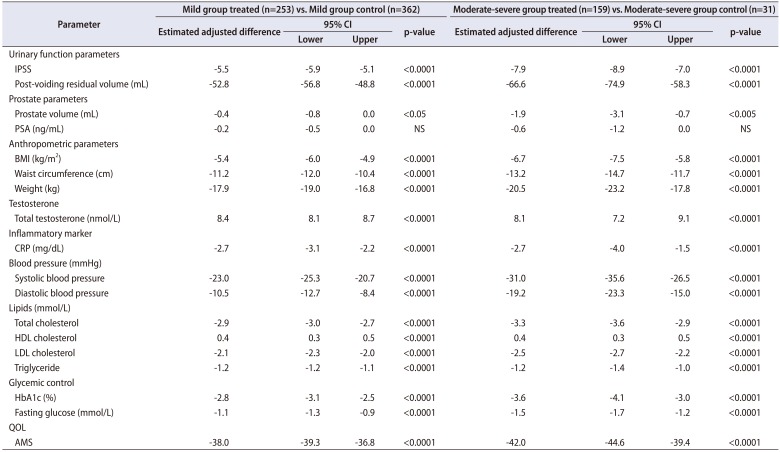
Table 2
Estimated differences at 8 years between treated and control patients, adjusted for baseline age, BMI, fasting glucose, lipids, blood pressure, and QOL (assessed by AMS)
![]()
9. Major adverse cardiovascular events (MACE)
Deaths and incident non-fatal myocardial infarctions and strokes are summarized in Table 3.
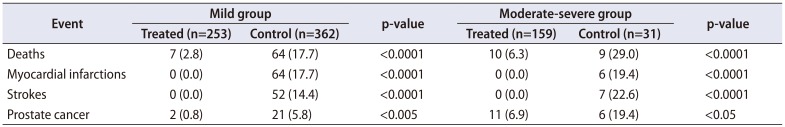
Table 3
Major adverse events during the entire observation time up to 12 years
![]()
DISCUSSION
Our analysis revealed significant improvement under TTh of urinary function and anthropometric parameters, lipids and glycemic control, blood pressure, CRP, and AMS. This substantial improvement was found not only in absolute terms but even more clearly in comparison with the respective control-groups. Interestingly, the considerably worse baseline values in patients with moderate-to-severe IPSS showed the greatest improvement. No effect was seen from TTh on prostate parameters confirming the safety of properly performed TTh. As a matter of fact, incident prostate cancer was reduced in the TTh-groups compared to the control-groups. This finding is consistent with a Canadian study in which men with the highest exposure to TTh (i.e., the longest treatment duration) had a decreased risk of prostate cancer diagnosis [13], as well as with our own observations showing that the incidence of prostate cancer in hypogonadal men on long-term TTh was significantly lower that expected in comparison with the incidence in large prostate cancer screening trials in the U.S. and Europe [14].
TTh resulted in decrease of IPSS for patients with both mild and moderate-to-severe LUTS whereas in the controls IPSS remained stable in patients with moderate-to-severe IPSS and increased in those with mild IPSS. PVR decreased in both TTh-groups and increased in both control-groups. TTh may not only alleviate complaints related to LUTS but also prevent age-related development of LUTS. These results are in line with a number of studies in the literature reporting a clear improvement of LUTS under TTh [4151617]. Conversely, others recorded that TTh in hypogonadal men did not produce differences in IPSS and PVR but these results also included no worsening of LUTS during TTh [181920]. A systematic review of 35 trials with hypogonadal men found that for patients with mild LUTS TTh resulted in either no change or an improvement in symptoms; for men with MetS, however, TTh revealed a uniform improvement in LUTS [21].
In a 5-year study of TTh of hypogonadal men with MetS and moderate LUTS, study patients under TTh showed a threefold lower incidence of prostatitis compared to the control-group [16]. This finding is consistent with the observed inverse association between T and CRP and brings further evidence to the potential role of T in inflammatory processes [22]. The correlation between T and CRP was confirmed by our analysis. Both TTh-groups started with elevated CRP values which constantly decreased during TTh. Interestingly, both control-groups showed an increase of CRP values over time.
Obesity is strongly associated with prostate volume and pro-inflammatory factors released from visceral fat [22324]. As a consequence, there is evidence linking obesity and incidence or progression of LUTS. In fact, this link was observed in our study as well. Under TTh, a constant decrease of weight was noted in parallel with the improvement of LUTS throughout the observation period. The weight loss was accompanied by loss of abdominal fat clearly recognizable by the reduction of WC. The sustained reduction of abdominal fat is facilitated by the normalization of T as T is an essential factor in the biochemical processes of losing abdominal fat, building up muscle mass and thus increasing basal metabolic rate. The association between regulation of T and sustained weight loss has been shown in long-term observational studies [1625]. Hence, hypogonadal obese patients may have a double benefit from TTh - reduction of obesity as component of MetS coupled with a decrease of LUTS respectively a lower risk for LUTS or its progression.
MetS, cluster of risk factors for cardiovascular disease (CVD), is suggested to be involved in LUTS pathogenesis [89]. Hence, LUTS is correlated with CVD and the risk and occurrence of MACE in males. Patients with moderate-to-severe LUTS have shown a significantly increased risk of MACE [26]. The Framingham Risk Score as assessment tool for estimating an individual's 10-year risk of developing CVD was found to be increased more than five-fold or ≥10 percent of men with moderate-to-severe LUTS [27]. In fact, the results from our study not only confirm that restoration and maintenance of normal T levels facilitate normalization of lipids, glycemic control, blood pressure, and CRP presenting an improved cardiometabolic risk profile in parallel LUTS improvement. In terms of outcomes, we also observed a significant reduction in MACE.
LUTS is an indicator for the patient's disease state and besides its association with overall health, LUTS is known to have a profound impact on QOL. Using the self-administered AMS questionnaire, a range of physical, psychological, and sexual symptoms in aging men can be assessed by the patients. In our study, a considerable and rapid improvement in AMS was documented in both TTh-groups during the first two years of TTh. Remarkably this improvement remained constant during the following eight years of observation. In contrast, in patients in both control-groups a steady increase of AMS was documented.
1. Study limitations
In this study we evaluated the impact of TTh in hypogonadal patients presenting different grades of LUTS severity. Strengths of our study included the high accuracy of data collected in a private urology practice and the validation by control-groups of hypogonadal LUTS patients who decided against TTh. The size of the groups depended on the number of LUTS patients being in ambulatory treatment in the urology office and in particular on the patients' decisions for or against TTh.
The total number of patients with mild LUTS at baseline was 615, of which 253 started TTh and 362 served as control. These numbers can be considered sufficient to ensure a valid comparison. There was a marked difference in baseline age due to the fact that there were patients in the TTh groups who did not have the choice for or against TTh, including young patients with Klinefelter's syndrome and testicular cancer patients. We tried to overcome these baseline differences by adjusting changes between treated and untreated groups for age and a number of cardiometabolic risk factors. Moderate-to-severe LUTS was recorded in 190 patients at baseline, of which most started a TTh (n=159) and only a small number of patients decided against TTh and served as controls (n=31). Already small at baseline, this control-group became progressively smaller during follow-up and was reduced to 17 patients in year 8.
Our study results show the beneficial effects of long-term TTh on LUTS in hypogonadal men, in particular for those with moderate-to-severe LUTS. These findings and the scale of effect need further confirmation in future studies with sufficiently large test and control-groups.
CONCLUSIONS
Correcting hypogonadism by TTh has shown to be highly effective and safe for improving LUTS in hypogonadal men. Continuous and significant improvement of urinary parameters under TTh, as was verified by comparison with control-groups, goes along with the improvement of anthropometric parameters, lipid profile and glycemic control, blood pressure, and CRP values. QOL, assessed by AMS, was not only significantly improved under TTh but remained at the improved level despite increase of age during the observation period.

 XML Download