

 PDF
PDF ePub
ePub Citation
 Print
Print


INTRODUCTION
Urolithiasis is a relatively common urologic disease that significantly affects the quality of life of patients due to pain and high recurrence rate [1]. The etiology and cause of urolithiasis remain unclear. However, its incidence varies depending on the region, and its prevalence varies according to age and environmental conditions in the same region. In Korea, the number of patients with urinary stone is increasing due to improvement in living standards and westernization of dietary habits. Because epidemiologic studies of the incidence of urolithiasis are difficult to target large-scale specific groups or regions, most studies are performed retrospectively for patients diagnosed at a hospital for a certain period of time.
Raheem et al. [2] reported the increasing prevalence of the urinary stone and the changes in the treatment of stone over time. Extracorporeal shock wave lithotripsy, rigid or flexible ureteroscopic stone removal, laparoscopic surgery, percutaneous nephrolithotomy, and open surgery are generally performed for the treatment of urinary stones, and minimally invasive surgical methods are gradually increasing. In the United States, the cost of stone treatment is estimated to be US $ 3,791,000,000 in 2007.
In some countries, the health insurance system is directly operated by the state. Korea has a health insurance system, which covers nearly 97.3% of the total population. By using the medical service, personal information of the target people, such as age, sex, area, frequency of use, type of treatment, and income level, is obtained. In addition, information about the medical service, such as the diagnosis, diagnostic instrument or test used, treatment used, and prescription is collected.
Many countries have analyzed various diseases in the field of urology using national insurance data [345]. Several multicenter studies on urological diseases have been conducted in Korea, but national survey or population-based studies are lacking. However, after publishing a big data from the Health Insurance Review and Assessment Service (HIRA) in 2012 [6], the National Health Insurance (NHI) Service releases Standard Cohort Data (SCD) for 11 years [789] and population-based epidemiology studies have also been reported in Korea.
Therefore, in this study we aimed to analyze the demographic aspects, such as age-specific subdivisions, incidence by region, incidence by sex, and prevalence or urolithiasis in Korea, using standard cohort data.
Go to : 
MATERIALS AND METHODS
1. Ethical
Written informed consent was exempted under IRB approval. The reason of exemption is as follows. Research involving the collection or study of existing data (collected prior to the research for purposes other than the research) if the data is publicly available or recorded by the investigator in such a manner that the subjects cannot be identified. Institutional ethics review was sought and approved by Catholic University of Korea, Institutional Review Board (approval number: UC14RISE0160).
2. NHI-SCD
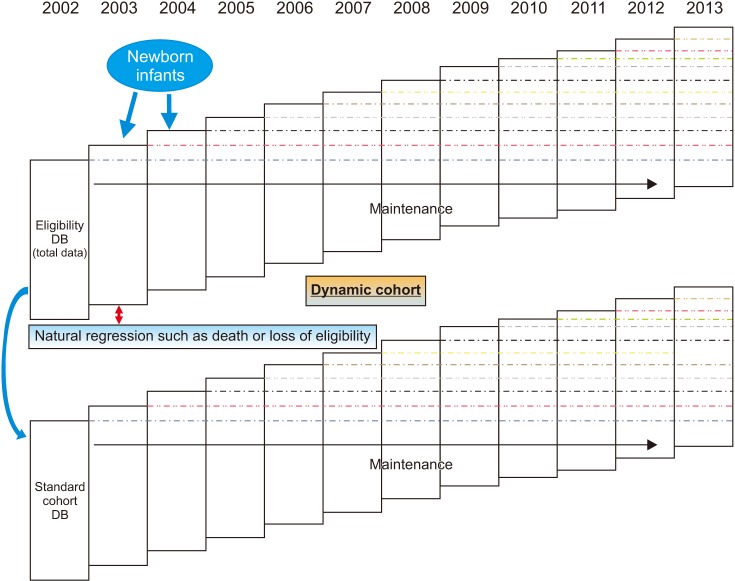
The NHI-SCD have slight annual changes in sample size due to different factors, such as decrease by death or loss of qualification, and increase by births or gain of nationality. Therefore, the cohort data comprise a dynamic database (DB). The DB maintains about one million samples per year. Approximately one million people are randomly selected among the entire population and added to the increase factors, such as newborns or qualification, to prevent decrease in size of the cohort due to death and disqualification, among others. The cohort data were from January 1, 2002 to December 31, 2013 (Fig. 1).
The demographic characteristics include sex, age (5-year-old age group classification), residential area, household information, disability, death, reasons for death, and medical care. A total of 16 area codes were assigned, and for the income brackets, the regional and workplace subscribers were classified into 10 groups. In cases of medical use, information of medical institution and medical expenses, examination results, mental health, oral health, accident/poisoning, chronic disease, and other diseases were obtained and included in our cohort data. Lifestyle information, such as smoking, drinking, obesity, exercise, and physical activity, was also included.
In terms of diseases, the cohort data were based on the international classification of disease 10th edition, clinical modification (ICD-10-CM).
The total number of the population was 47,851,928, and those without income were excluded. Thus, true population of the cohort was 46,605,433. Gender-age-income level stratified proportional allocation stratified random sampling was used to calculate 1,476 stratified population. The following formula was followed:

nijk=Number of stratified samples
Nijk=Number of stratified population
n=Total number of samples
N=Total number of population
As a result, the total number of samples was 1,025,340 (2.2% of the population), consisting of 994,627 workers in the workplace/area and 30,713 in medical care.
All statistical analyses were performed using SAS Institute (9.3 version; SAS Institute, Cary, NC, USA). All data was reviewed by Department of Medical Statistics, Catholic University of Korea.
3. Incidence
To calculate the incidence rate, the subjects were qualified as standard cohort DB from January 1, 2003 to December 31, 2012. The index date of cohort was defined as the point at which the sample cohort was first qualified for the study period (2003–2013) (defined as the qualification DB base year, January 1 of the relevant year). Patients with urinary stones were defined as those with N20 or N13.2 on ICD-10-CM as the primary diagnosis after the index date, and the first occurrence date during the follow-up period was defined as the outcome date. Those who had been diagnosed with urolithiasis (N20 or N13.2 on ICD-10-CM) before the date of cohort entry were excluded. The ending date was the earliest date of event occurrence, death, or loss of eligibility criteria. N20 on ICD-10-CM included all the lower diagnosis categories N20.0, 20.1, 20.2, and 20.9.
4. Prevalence
The prevalence study included all NHI-SCD subjects. We defined N20 or N13.2 as a primary or secondary diagnosis on an analysis year basis.
Go to :
RESULTS
1. Incidence rate
A total of 1,114,997 persons were eligible for the cohort of the Health Insurance Corporation from January 1, 2003 to December 31, 2012. Of these patients, 1,111,828 subjects were finally included, excluding those who had been previously diagnosed with urinary stone before entering the cohort.
1) Total incidence
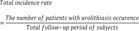
The total number of patients with urinary tract stones was 36,857. The total duration of the study was 11,285,820.9 person-years, and the total incidence was 3.27 per 1,000 person-years.
2) Incidence rate by diagnostic code, gender, 5-year age group, and year
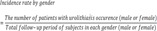
Urolithiasis occurrence was reported in 22,530 males and 14,327 females. The total observation periods were 5,617,629.17 person-years in male and 5,668,191.73 in female. The incidence rates were 4.01 per 1,000 person-years in male and 2.53 per 1,000 person-years in female. The male-to-female ratio was 1.57:1.
Total 6 diagnostic codes were used for statistical analysis (N13.2, N20.0, N20.1, N20.2, N20.9, and N20). The definition for the codes are mentioned in Table 1. N20 code decreased dramatically since 2007, since it was no longer recommended for usage due to its unspecific definition. In both sex, calculus of ureter only (N20.1), comprised the largest proportion of total diagnosis (58.2% in male, 54.3% in female) with incidence rate of 2.49 per 1,000 person-years. On the other hand, N20.2 code defined as kidney stones conjoined with ureteral stones, had the lowest incidence of 0.17 per person-years.
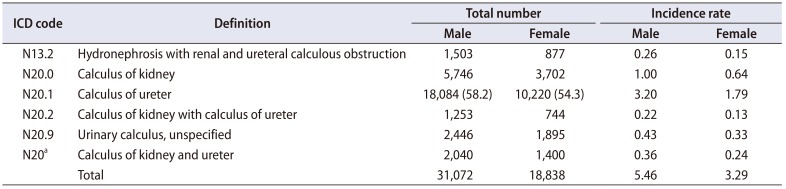
Table 1
Definition and total number of diagnosis, incidence rate (per 1,000 person-year) by diagnostic codes
![]()
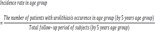
By age group of 5 years, the 45–49 age group comprised the largest number of patients (12.8% of the total patients), and overall, the shape of the normal distribution curve is shown (Fig. 2). However, the highest incidence was found in the 50–54 age group in the male, and the highest incidence was in the 55–59 age group in the female (Table 2, Fig. 3). In yearly incidence, 3,751 patients in 2005 accounted for 10.2% of the patients who developed stones during the study period. The smallest number of cases occurred in 2013 (3,138 patients, 8.5%) (Fig. 4).
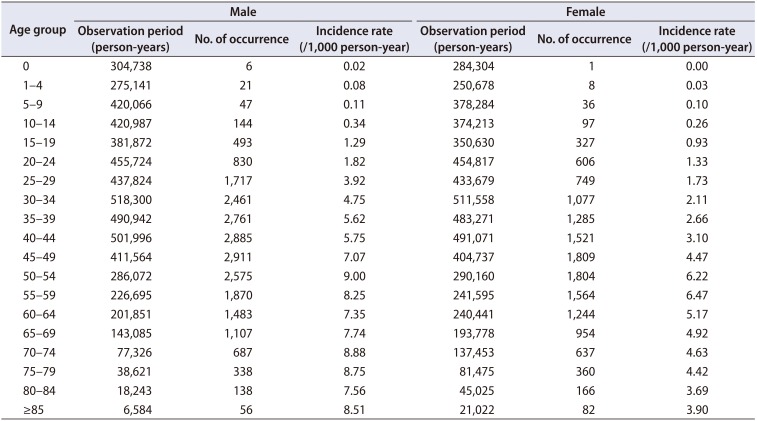
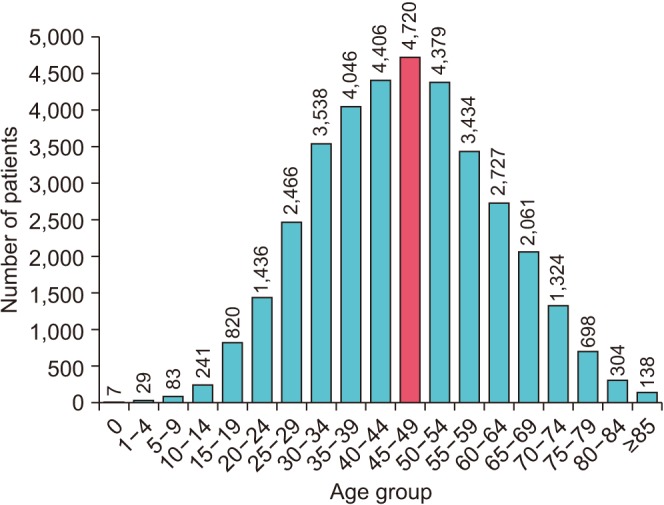
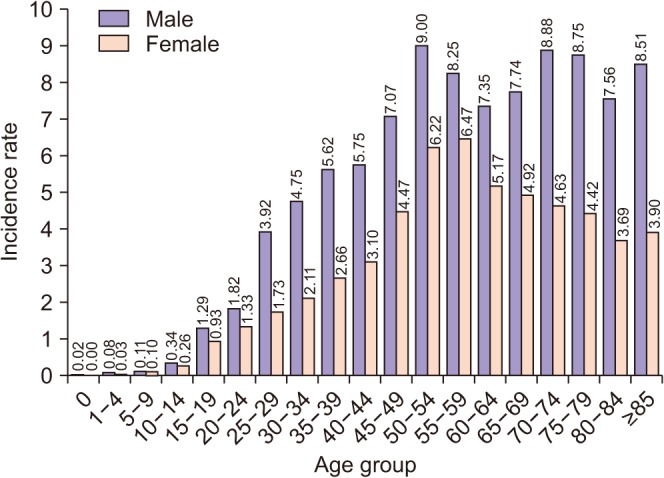
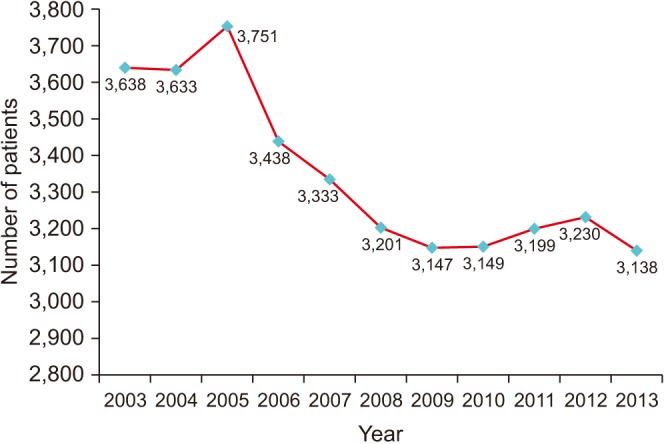
Table 2
Comparison of incidence rates by age group
![]()
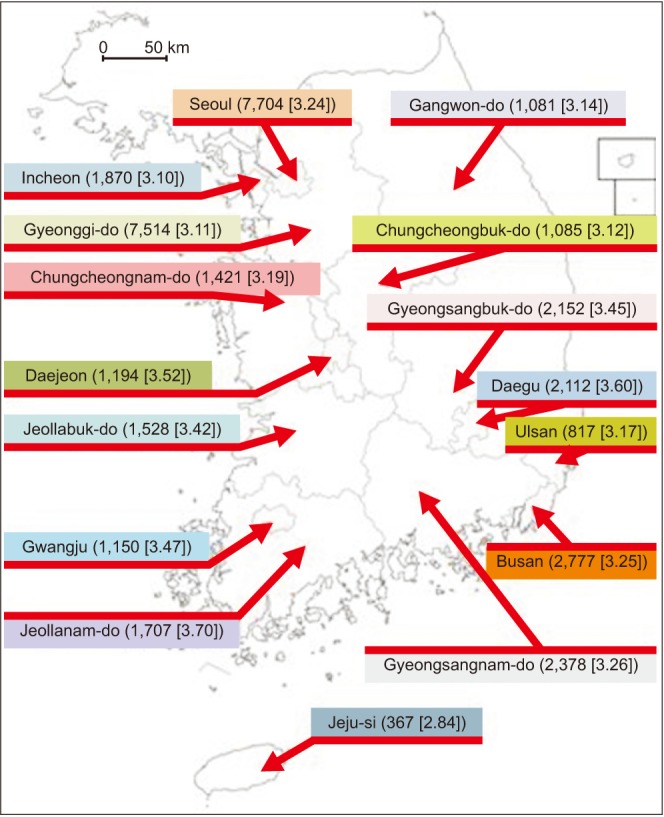
The incidence rate by region was divided into 16 regions nationwide. The highest number of patients with urolithiasis was found in Seoul (7,704 patients) and Gyeonggi-do (7,514 patients). Of the 16 cities and provinces, Jeollanam-do had the highest incidence of 3.70 per 1,000 person-years, and Jeju had the lowest incidence of 2.84 per 1,000 person-years (Fig. 5). In subgroup analysis by sex, Daegu had the highest incidence (4.56) in males, and Jeollanam-do had the highest incidence (3.20) in females. Jeju had the lowest incidence in both sex (3.39 in male, 2.30 in female).
2. Prevalence
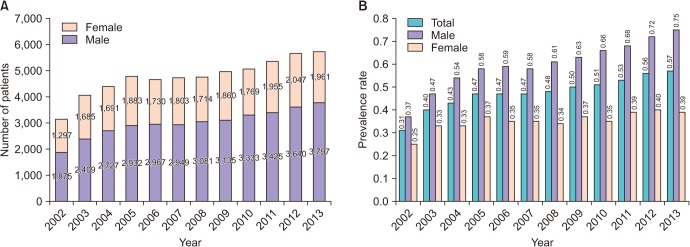
The prevalence of urinary stone has increased yearly from 0.31% in 2002 to 0.57% in 2013, an increase of 1.84 times over 10 years (Fig. 6A). The prevalence in male increased from 0.37% in 2002 to 0.75% in 2013, while in female it was from 0.25% in 2002 to 0.39% in 2013. The male-to-female ratios were 1.44:1 in 2002, and it increased up to 1.93:1 in 2013. The prevalence rate in male is rapidly increasing than in female (Fig. 6B). The prevalence rate in was the highest in Jeollanam-do (0.52%) and the lowest in Jeju (0.40%). In male, Daegu had the highest prevalence (0.70%) an Jeju had the lowest (0.50%). In female, Jeollanam-do (0.43%) was the highest while Jeju (0.29%) had the lowest prevalence.
Go to :
DISCUSSION
The word urolithiasis is made up of a combination of the word ‘oûron’, which refers to the ancient Greek word urine, and ‘lithos’, which means stone. Therefore, urolithiasis occurs everywhere in the urinary tract and is closely related to urine. Renal stone was first found in ancient Egyptian mummy [10]. Thus, it has always been part of life and long history of mankind. Urolithiasis is a disease with various clinical symptoms including severe pain, hematuria, and urinary tract infection. It occurs worldwide, resulting in high costs and other problems. There are various claims about the causes of the onset, and many studies are still being carried out. The accepted risk factors include gender, age, regional characteristics, racial characteristics, eating habits, degree of water intake, obesity and comorbidity [11121314].
In North America, the prevalence of kidney stones in adults was about 3.2% from 1976 to 1980 [15], but it more than doubled to 8.8% from 2007 to 2008. In Europe, the prevalence was increased by 4.8%–6.2% [16]. In Japan, Yasui et al. [17] reported that the incidence of urolithiasis was 134.0 per 100,000 in 2005, which was slightly lower than that in western countries.
In our study, we made a subgroup analysis using diagnostic codes. In UK, renal stone (N20.0) composed the largest proportion of total urolithiasis [18]. However, in our study, ureter stone (N20.1) composed more than half of total diagnosis, and renal stone was the second most common diagnosis. This difference could not be exactly explained but we could focus on some epidemiological differences in both countries. Also the sum of total diagnostic code (49,910) surpasses the number of patients diagnosed (36,857). This could be explained by patient's recurrence which was not analyzed in this study, and several cases of a patient having multiple diagnosis associated with urolithiasis. In further studies, we aim to review about the exact recurrence using more precise model of this cohort.
Bae et al. [6] reported that the prevalence rate of HIRA-National Patients Sample was the highest at 60–69 years. Similar results were obtained by Tae et al. [9]. We found a similar but slightly different result. The peak incidence group was 50–54 years, which was slightly younger than the previous studies, and the incident rate was still high in elder groups but tend to decrease slightly than the 50–54 years group.
As a well-known risk factor, male gender is prone to experience life-time episode of urolithiasis. The same result was also observed in our cohort study. However, the exact pathophysiology of gender difference in urolithiasis remains uncertain [19]. Some studies stressed on the protective effect of estrogen, while others concluded testosterone as a risk factor. In some studies, estrogen replacement therapy seems to be a risk factor for urolithiasis [20]. In our study, by agesubgroup analysis of each gender, females tended to show a dramatic rise from the age of 45–49 reaching the peak incidence in the age group of 55–59. This age matches the period of menopause in Korean females [21]. And unlike the male group the incidence tends to decrease after reaching the peak incidence in age group of 55–59. Therefore, urolithiasis and hormonal changes in peri-menopausal women seem to have etiological correlation, but the exact role of sex hormones or exogenous hormonal replacement remains to be evaluated.
In our study, we performed a sub-analysis divided by province in Korea. The most interesting result of this subanalysis was that although the provinces, Jeollanam-do and Gyeongsangnam-do, are located in the same latitude and have very similar meteorologic factors, they showed significant differences in the incidence of urolithiasis (3.70 vs. 3.26). For further explanation, major etiologic factors such as ethnicity, gender, and age, were compared and showed no differences in both provinces [22]. Daily dietary sodium intake was similar in Gyeongsang-do and Jeolla-do (4,798.1 mg vs. 4,605.7 mg) [23]. The cause of the differences in the findings remains unclear, however, further evaluation including precise investigation of dietary habits will be conducted in the future. Jeju Island, which is located in the southernmost part of Korea, showed the lowest incidence among all the provinces analyzed. In the USA, the southern area had higher prevalence than the northeastern and western areas [15]. In other studies, increase in average temperature leads to a significant increase in renal colic episodes [24]. Park et al. [25] reported that temperature over 18℃ is a risk factor for urinary stone attack incidence. However, Jeju has significantly higher average temperature than Seoul but has relatively higher humidity and higher precipitation than the main Korean peninsula [26]. In some studies, renal colic and humidity showed less correlation or weaker correlation with urolithiasis [27]. On the other hand, Dallas et al. [28] implied the effect of precipitation as a protective factor in urolithiasis. Having higher humidity and higher precipitation, insensible loss of fluid through sweating could be decreased, acting as a protective factor in stone formation. Studies combining climate and urolithiasis have proven that temperature itself is a major risk factor for urinary stone formation. However, in the case of Jeju, precipitation and humidity could be strong protective factors for the incidence of urolithiasis. With further cohort and climate matching studies, the relationship between rain and urinary stone could be clarified.
Dietary habit or sodium intake is one of the most important factors of urinary stone formation [29]. Korea, having almost homogenous ethnicity and relatively small differences in climate among provinces, might be one of the best candidates to analyze dietary impact on stone formation with less bias. However, the current nutritional studies in Korea are based on a relatively small number of cohort (estimated about 20,000) compared with a stone cohort, and are mostly based on patient questionnaires, thus, quantitative measures could be less precise than expected. Further study models with more precise dietary analysis combined with a national cohort study might reveal further more association with stone formation and food intake.
As mentioned above, our analysis had some limitations. First, recurrence rate could not be measured because final treatment result was not included in the cohort. Thus, a person with the same urinary stone with different timing of diagnosis could not be distinguished with a person with newly formed urinary stone. Second, the cause of regional differences could be only hypothesized but not identified. Only rough data of the total sodium intake was available, and more precise measurement data, including water, salt, and dietary protein intake, which could be major risk factors, were absent. However, the dietary habits of the sample and the actual incidence rate are possible to correlate by analyzing the regional samples through additional analysis and investigation. Thus, establishment of a preventive diet or determination of a salt, meat, and water intake for Koreans is possible.
Go to :
CONCLUSIONS
The mean incidence number of urolithiasis was 3,350 each year, which remained almost the same every year during the analysis period. The prevalence rate increased from 3,172 in 2002 to 5,758 in 2013. The incidence in male was 1.57 times higher than in female, and it is most prevalent among aged 45–49 years, with the highest incidence occurring in Jeollanam-do and the lowest in Jeju.
Go to :
 XML Download