

 PDF
PDF ePub
ePub Citation
 Print
Print


INTRODUCTION
The Sustainable Development Goals (SDG) proposed in 2015 made a clear commitment to improve child survival, with an explicit target for all countries to reduce neonatal mortality to as low as 12 deaths per 1,000 live births and under-five mortality to 25 deaths per 1,000 live births.1) As of 2015, 20% of the total under-five deaths in the world (or 1,201,000 deaths) was attributed to India,1) despite the country’s remarkable 4.1 percent rate of reduction from 1990 to 2016 (from 126 to 43 deaths per 1,000 live births).2) In recent years, India has strengthened its relevant policies and increased budgetary allocations to improve maternal and child survival, as exemplified by Expanded Programmes on Immunization (Mission Indradhanush)3) and pilot programmes to improve the quality of care in maternal labour rooms especially in remote areas.456) Given this movement, up-to-date empirical evidence on modifiable factors to reduce postnatal deaths has important and timely relevance for policy discussions in India.
A key component of maternal and child health interventions is promoting coverage of appropriate and timely care both during pregnancy and at delivery.789) The World Health Organization (WHO) specifically recommends at least four antenatal care (ANC) visits, ideally occurring between 8 and 12 weeks of gestation, between 24 and 26 weeks, at 32 weeks, and between 36 and 38 weeks.10) The WHO guidelines further outline the service package required for each visit, including screening for complications, educational advice on healthy lifestyle, 2 tetanus toxoid injections, and 90 iron/folic acid tablets.11) Additionally, ensuring birth delivery in institutional settings with the assistance of a skilled birth attendant (SBA) can substantially reduce the risk of stillbirth or maternal deaths due to intrapartum- related complications.112) The latest estimates from India report that just over half of the mothers had at least 4 ANC visits and almost 79% had institutional births.13)
Contrary to the expected benefits of ANC visits and SBA at delivery, a number of prior studies found that expanding the coverage of individual uptake of these services does not necessarily translate into improvements in neonatal, infant, and child mortality outcomes in the context of low- and middle-income countries (LMICs) where the quality of health service delivery is not optimal.1214151617) Weak health systems and poor incentives are identified as critical barriers that create a gap between individual access to care and the actual health outcomes.1418) These conflicting findings suggest that the overall quality of care in maternal services and clinical capacity may play an independent role on birth outcomes and subsequent child survivals over and above individual access to ANC and SBA. Also importantly, they may explain the uneven geographical distribution of the burden of child deaths.19) Within India, substantial inter- and intra-state disparity exists for infant and under-five mortality with higher concentration in central and eastern regions.20) To our knowledge, whether this geographic variation in neonatal, infant, and under-five mortality is largely due to clustering of ‘high-risk’ individuals or presence of contextual factors operating at higher levels (such as provider quality) has not yet been systematically examined using multilevel modeling.
Assessing quality in health care is challenging due to lack of universally accepted definition.21) Moreover, indicators of contextual provider quality are not routinely available in nationally representative surveys in the context of LMICs. For instance, Demographic and Health Surveys (DHS) do not collect information on patient satisfaction and safety or health inputs or system efficiency. 22) To overcome this data constraint, prior studies have often used caesarean and episiotomy rates,23) neonatal near-miss events (i.e., newborn infants presenting selected markers of severity and surviving the first neonatal week),24) and maternal mortality as proxy indicators for quality of care. Another recent study used principal components analysis based techniques to quantify variation in quality of care using core DHS indicators for Indonesia and found disparities by wealth and geographical regions.22) We offer a fairly new approach to derive contextual provider quality indicators and assess their relative importance along with individual utilization of ANC and SBA in India using multilevel framework.
This study uses the latest nationally representative data from India to first create indicators for district and state provider quality based on residuals deviating from the ecological associations between ANC (and SBA) rate and prevalence of neonatal, infant, and under-five mortality at each respective level. Then, we use multilevel statistical techniques to examine: (1) whether individual use of ANC and SBA is independently associated with each mortality outcome, after taking into account of other important sociodemographic covariates and contextual provider quality indicators, and vice versa, and (2) the magnitude and partitioning of variation in mortality outcomes by multiple relevant levels (i.e., communities, districts, and states), both before and after adjusting for individual compositional characteristics and contextual provider quality indicators.
METHODS
1. Data
The latest Demographic and Health Survey (DHS) conducted in 2015~2016 (round VII), also equivalent to the National Family Health Survey (NFHS)(round 4) in India, was used for this study. All seven union territories in addition to the 29 states in India were surveyed for the first time in the NFHS-4. This allowed estimation of many indicators at the district level for all 640 districts in India as per the 2011 census.2526) Survey respondents were selected following a probability-based cluster sampling procedure. Sampling frames were first developed on the basis of non-overlapping units of geography (identified as the primary sampling units (PSUs)) by states and urban and rural areas within each state. At the second stage, a fixed proportion of households were selected using systematic sampling within each PSU.26) The full dataset is available upon request from https://dhsprogram.com/ and contains no identifiable information on the study participants. DHS is known for standardized and nationally representative sampling of participants, objective measurement of anthropometric measures, collection of a wide range of monitoring and impact evaluation indicators for health and nutrition, and high response rates.26)
2. Study Population and Sample Size
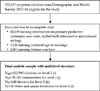
India DHS 2015~2016 collected data on all children born within 5 years of age from the survey year in each selected household. A total of 255,327 singleton children were eligible to be included in our analysis. Of them, 68,119 children (26.7%) who were missing information on ANC visits or SBA were excluded. For complete case analysis, 4,228 children (1.7%) who were missing information on one or more of the covariates listed below were also excluded, leaving 182,980 children across 28,283 communities, 640 districts, and 36 states and union territories in the final analytic sample (Fig. 1).
3. Outcome Variables
Three mortality outcomes were assessed in this study: neonatal mortality (i.e., deaths within the first month), infant mortality (i.e., deaths within one year since birth), and under-five child mortality (i.e., deaths within the first five years).
4. Individual Access to Care
From mother's self-reported data on utilization of ANC services, we created a binary variable indicating whether the mother had <4 or≥4 ANC visits. Another binary variable was coded indicating whether the mother had birth delivery in an institutional setting with a SBA (doctor, nurse, or midwife).
5. Contextual Provider Quality
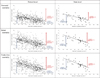
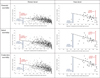
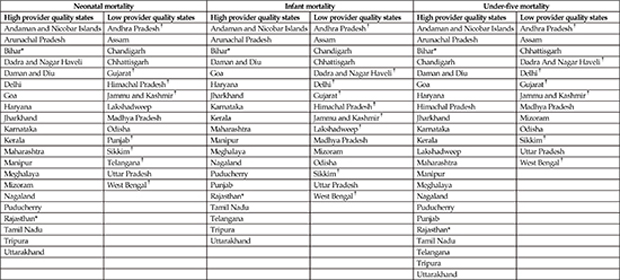
Indicators for outcome-specific provider quality (low versus high) were derived for each district and state (hereafter collectively referred to as ‘contextual provider quality indicators’) from the following ecological models. An ecological model here simply refers to a regression model with both predictor and outcome variables aggregated at higher levels27) (i.e., districts and states). For instance, based on an ecological model regressing proportion of mothers reporting≥4 ANC visits and proportion of neonatal mortality at the district level, positive residuals (i.e., districts with higher than average mortality rate given the same proportion of ANC≥4) were coded as ‘low provider quality’ districts and negative residuals (i.e., districts with lower than average mortality rate given the same proportion of ANC≥4) were coded as ‘high provider quality’ districts (Fig. 2). This procedure was repeated for infant and child mortality outcomes at both the district and state levels. Similarly, another set of contextual provider quality indicators were derived from residuals based on ecological models regressing mortality prevalence by proportion of delivery with SBA (Fig. 3).
6. Other Covariates
Several other important covariates at the child, maternal, and household levels were identified. Child's sex (male, female), birth order (1, 2~3, 4~5, ≥6), birth interval (first birth, <24, 24~47, ≥48 months), and delivery mode (normal, caesarean) were included in our analysis. At maternal level, mother's age (15~19, 20~24, 25~29, 30~34, 35~39, 40~44, 45~49 years), marital status (currently married or living together, never/formerly married), education (none, primary, secondary, higher, college), age at marriage (<18, ≥18 years), and whether tetanus injection was given (yes, no) were assessed. Indicators of household socioeconomic and environmental conditions were coded as following. In DHS, household wealth index, a composite index of relative standard of living, was created using principal component analyses of household characteristics and assets and then categorized into quintiles.26) The source of drinking water was considered safe for water piped into dwelling or yard/plot, public tap/standpipe, tube well or borehole, protected well or spring, rain water, and bottled water, and unsafe otherwise. The sanitation facility was defined as improved if households had access to flush to piped sewer system, septic tank, or pit latrine, ventilated improved pit latrine, pit latrine with slab, and composting toilet, and unimproved otherwise. A binary variable for whether solid fuels were used for cooking (yes, no) was considered as a crude measure of household air quality. Lastly, household place of residence (urban, rural) was included in our analysis.
7. Analysis
In DHS, individual level data followed a four-level hierarchical structure with children at level-1 (i), nested within communities (or PSUs) at level-2 (j), districts at level-3 (k) and states at level-4 (l). In India, states are the political unit at which federal polices operate; districts are the lowest administrative unit at which the elected district councils plan the provision of services and infrastructures; and communities represent villages for rural areas and urban frame survey blocks for urban areas and capture the local environment.28) Multilevel statistical techniques provide a technically robust and efficient framework to account for the complex survey design and assess variation in outcomes by multiple levels.2930) As suggested by its name, multilevel modeling enables simultaneous examination of the circumstances of individuals at one level in the context of multiple higher geographic, administrative, and social levels, and thereby discern the relative contribution of different levels to the scientific question of interest.2930)
For each of the three binary outcome variables (neonatal, infant, and under-five mortality), a series of four-level random intercept logistic regression models were estimated based on a logit-link function. We first ran a null model with no predictor variable to serve as a baseline for comparing changes in variance estimates in subsequent models (Model 1).
For interpretation, β0 represents the median log odds of mortality across all India and bracketed terms represent random effects associated with states, districts, and communities, respectively. The term f0l is a state-specific residual that represents a departure of each state from the national median log odds of mortality; ν0kl is a district-specific residual conditional on state; and µ0jkl is a community-specific residual. Assuming a normal distribution of these residuals, this model partitions the total variation in mortality by between-state (i.e., f0l~N(0, σ2f0 ), between-district (i.e., ν0kl~N(0, σ2µ0
 ), and between- community (i.e., µ0jkl~N(0, σ2µ0) components. For binary outcomes, the variance at the individual level (level-1) cannot be obtained directly from the model, and all remaining variance is assumed to be a function of the binomial distribution (i.e., 3.29).30)
), between-district (i.e., ν0kl~N(0, σ2µ0), and between- community (i.e., µ0jkl~N(0, σ2µ0) components. For binary outcomes, the variance at the individual level (level-1) cannot be obtained directly from the model, and all remaining variance is assumed to be a function of the binomial distribution (i.e., 3.29).30)
In subsequent models, all the individual-level covariates(X′ijkl) were included first without ANC and SBA in Model 2 and then with ANC and SBA in Model 3.
Then, the fixed effect of provider quality indicators derived from ANC for districts (Model 4A) and states (Model 4B) were added to evaluate the relative importance of individual access to ANC versus contextual provider quality. Similarly, provider quality indicators derived from SBA were evaluated for districts (Model 5A) and states (Model 5B).
For each successive model, the proportion of variance in the log odds of mortality explained by additional factors was computed by subtracting the variance of model with more terms from the variance of simpler model, and converting to percentage. Data were prepared using STATA 13.0 and all multilevel models were estimated using the MLwiN 3.0 with predictive/penalized quasi likelihood approximation with a second-order Taylor linearization procedure. For interpretation, we report odds ratios (ORs) and 95% confidence intervals (CIs).
RESULTS
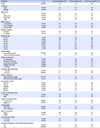
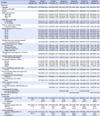
Of the total 182,980 children, 1.8% died within the first month, 2.6% within the first year, and 2.8% within the first five years (Table 1). A clear patterning in the prevalence of mortality was shown by household wealth and several maternal characteristics. For instance, the proportion of under- five mortality was 4.0% in the poorest quintile whereas only 1.5% in the wealthiest quintile. A J-shaped patterning in mortality was observed for maternal age, with the proportion of under-five mortality being high for the youngest age group (4.8%), lowest for 25~29 year group (2.3%), and highest for the oldest mothers (7.1%). In our final analytic sample, about half of the mothers (47.3% or n=86,626) reported to have attended at least four ANC visits and 75.8% (n=138,789) delivered birth in institutional settings with SBA. The proportion of neonatal mortality was lower for those who had≥4 ANC visits (1.4% vs 2.2%) and SBA (1.7% vs 2.2%) compared to their counterparts (Table 1). Based on the contextual provider quality indicators derived from ANC visits, 276~281 districts (43.1~43.9%) and 13~16 states (36.5~44.4%) were classified as low quality areas depending on the mortality outcome (Fig. 2). Similarly, when derived from SBA, 268~285 districts (41.9~44.5%) and 8~9 states (22.2~25.0%) were classified as low quality areas (Fig. 3). The full list of states and districts and their classifications are presented in Appendix.
1. Neonatal Mortality
In the base model with no predictors (Model 1), we found most variation in neonatal mortality attributed to the community level (Variance Partitioning Coefficient [VPC]: 40.3%) followed by substantially smaller variation at state (VPC: 2.6%) and district (VPC: 1.2%) levels (Table 2). In Model 2, several individual-level covariates were significantly associated with increased odds of neonatal mortality. Important associations were found in respect to birth order and birth interval. Conditional on all other factors, being the 2nd/3rd and 4th/5th child was associated with significantly lower odds of neonatal mortality compared to being the first born (OR: 0.68; 95% CI: 0.60, 0.79 and OR: 0.81; 95% CI: 0.67, 0.99, respectively) whereas being the 6th or above was not significant. Birth interval of <24 months was associated with almost 40% increased odds of neonatal mortality (OR: 1.37; 95% CI: 1.19, 1.57) whereas longer interval (24~47months) showed 15% reduced odds (OR: 0.85; 95% CI: 0.75, 0.96). Higher odds of neonatal mortality were found for c-section vs normal delivery (OR: 1.31; 95% CI: 1.17, 1.47) and not having received tetanus injection before birth (OR: 1.53; 95% CI: 1.36, 1.72). Lack of maternal education (OR: 1.43; 95% CI: 1.17, 1.73) and poorest household wealth (OR: 1.72; 95% CI: 1.37, 2.15) were also significant risk factors for neonatal mortality, suggesting the importance of socioeconomic conditions. Inclusion of these covariates explained 56.3% of between-district variation and 34.1% of between-community variation, but less than 20% of between- state variation in neonatal mortality.
Model 3 included individual-level ANC and SBA predictors (Table 2). Failure to meet the WHO recommended 4 ANC visits was associated with 12% increased odds of neonatal mortality (OR: 1.12; 95% CI: 1.02, 1.23). Absence of SBA at delivery and births in non-institutional settings was associated with 4% increased odds of neonatal mortality, albeit not statistically significant (OR: 1.04; 95% CI: 0.94, 1.15). Compared to Model 2, additional consideration of individual-level ANC and SBA explained around 6% of variation each at community and state levels, and 3% at district level. Individual-level ANC remained statistically significant even after additionally adjusting for contextual provider quality indicators, which showed even stronger associations with neonatal mortality. In Model 4A/B, districts and states with low provider quality based on ANC were associated with almost 70% and 50% increased odds of neonatal mortality, respectively. Similarly, districts and states with low provider quality based on SBA were associated with almost 80% and 60% increased odds of neonatal mortality, respectively, in Model 5A/B. Relative to Model 3, district provider quality indicators explained all the remaining variation in neonatal mortality at the district level, and state indicators explained 22.6 ~40.9% of the between-state variation in neonatal mortality.
2. Infant Mortality
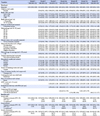
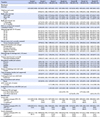
Contextual variation in infant mortality was smaller in magnitude compared to neonatal mortality. In Model 1, 29.4%(VPC) of total variation in infant mortality was attributed to communities and only 2.3%(VPC) to states and 1.3%(VPC) to districts (Table 3). The associations between individual-level covariates and infant mortality in Model 2 were comparable to those observed for neonatal mortality, with a larger fraction of variation explained at state (23.4%) and community (41.0%) levels. In Model 3, individual-level ANC was significantly associated with increased odds of infant mortality (OR: 1.15; 95% CI: 1.07, 1.24) conditional on all other covariates. Moreover, children born in non-institutional settings with no SBA had 9% higher odds of dying in the first year compared to their counterparts (OR: 1.09; 95% CI: 1.01, 1.18). These two individual-level primary predictors explained additional 7~8% of variation in infant mortality at all contextual levels. Contextual provider quality indicators showed strong influence on infant mortality, but to a lesser degree than they did for neonatal mortality. In Model 4A/B, districts and states with low provider quality based on ANC were associated with almost 64% and 32% increased odds of infant mortality, respectively. In Model 5A/B, districts and states with low provider quality based on SBA were associated with 61% and 46% increased odds of infant mortality, respectively. The between-district variation in infant mortality was fully explained after adjusting for district provider quality indicators, whereas 20~40% of the between- state variation was explained by state provider quality indicators.
3. Under-Five Mortality
Of total variation in under-five mortality, 28.7% (VPC) was attributed to community level in Model 1 (Table 4). Among individual-level covariates included in Model 2, socioeconomic factors showed stronger associations with under-five mortality than with other mortality outcomes. Lack of maternal education and poorest household wealth were each associated with 1.63 (95% CI: 1.39, 1.91) and 1.80 (95% CI: 1.50, 2.15) higher odds of under-five mortality compared to the best off reference groups. All covariates taken together explained larger proportion of variation at state (30%) and community (43%) levels. In Model 3, individual- level ANC and SBA were both significantly associated with under-five mortality, with OR: 1.17 (95%: 1.08, 1.26) and OR: 1.10 (1.02, 1.19) respectively, and explained additional 9~10% of variation at state and community levels and only 5.4% at district level. Moreover, they remained robust even after accounting for contextual provider quality indicators. Districts and states with low provider quality based on ANC were associated with almost 61% and 27% increased odds of under-five mortality, respectively. Similarly, districts and states with low provider quality based on SBA were associated with 57% and 43% increased odds of under-five mortality, respectively. In the final models (Model 4, 5), contextual variation in under-five mortality substantially reduced especially at the district level.
DISCUSSION
This study provides three salient findings. First, individual-level ANC and SBA were both significantly associated with all mortality outcomes conditional on a comprehensive set of maternal and child covariates. Overall, the magnitude of association was stronger for ANC than for SBA, and both were most strongly associated with under-five mortality. Second, individual use of ANC and SBA and contextual provider quality indicators were all importantly associated with mortality outcomes, independent of one another. Contextual provider quality mattered more than individual use of ANC and SBA for neonatal, infant, and under-five mortality. In particular, district provider quality indicators had stronger influence than state indicators, and the magnitude of associations was the greatest for neonatal mortality. Third, for all mortality outcomes the largest contextual variation was observed at the local level (community) rather than for districts or states. Substantial fraction of variation, especially at district level, was explained by individual and contextual variables.
We used the latest nationally representative data of children in India, but there are potential limitations to our study. The use of cross-sectional analysis prohibits us from making any causal claim. Although we adjust for a comprehensive set of demographic, socioeconomic, and birth-related factors, the coefficient estimates from our models should not be interpreted as independent effects on mortality outcomes as they may be biased from over-adjustment for mediators and inadequate adjustment for important confounders. For instance, our estimation of individual-level ANC and mortality outcomes may be conservative given that we simultaneously adjusted for SBA in institutional delivery, which is suggested to be promoted by the quality of ANC service provision.313233) Another data constraint relates to the pregnancy and childbirth measures being self-reported by mothers with a recall period of up to five years. Prior validation studies suggest that the sensitivity and specificity of self-reported coverage of maternal and child health indicators can vary substantially when compared to health care records34) or direct observations.35)
The validity of our contextual provider quality indicators is another critical concern. Our method relies on a simple assumption that districts (or states) with higher than average mortality rate given the same proportion of women with ≥4 ANC visits (or SBA) are due to poor service quality in the area. Similar approaches are taken in multilevel analyses when there are scientific interests in simultaneously assessing the effects of ecological and individual exposure variables yet contextual level data are not available.36) Despite our approach being methodologically robust, in the absence of indicators related to the types of health messages and education provided by health personnel and surveys on patient satisfaction, it is difficult to validate how well these indicators truly capture care that is timely, sufficient, and appropriate in content. Further applications of our methodology using other available DHS variables, such as timing of ANC visits, health check-ups conducted during the visit (i.e., measures on weight, height, blood pressure, urine sample, blood sample, stomach examination), whether iron supplementary and pregnancy complication advice were given to the mother, and indication of postnatal checks, are needed. Nevertheless, the states identified as “low quality” areas in our study largely aligned with a prior study that found lower than desired quality of ANC (in terms of utilization, clinical quality, and interpersonal quality of care) in both northern and southern states in India.37)
Our findings provide useful insights to current literature and policy discussions around discrepancy between individual access to care and overall quality of care.383940) Lack of, or inadequate, ANC visits to a health facility as well as delivery without SBA or in non-institutional settings have been linked to increased risk of neonatal and infant mortality across LMICs.8414243) Other studies, however, have found non-significant relationships121441) and questioned the underlying causal mechanisms as large gaps exist between contact and content of care during antenatal, birth and postnatal periods.3940) We attempted to further advance this literature by simultaneously assessing the relative importance of individual access to care and contextual provider quality in respect to neonatal, infant, and under-five mortality. In doing so, we found both to be importantly related to mortality outcomes, independent of one another, with the magnitude of associations being stronger for contextual provider quality.
Taken together with existing evidence, our findings suggest that policies should continue to promote individual access to ANC and institutional deliveries; yet, without addressing supply-side constraints that compromise quality of care, such policies will be less effective in reducing newborn deaths.12) For instance, the Janani Suraksha Yojana program in India invested more than 200 million US dollars annually to incentivize women (in the form of cash transfers) to give birth in a health facility.41) Despite its success in significantly increasing the rate of institutional deliveries, studies found no effect of the program on either neonatal mortality or early neonatal mortality (deaths within the first 24 hours).41) Our findings suggest that regardless of institutional deliveries with SBA, poor quality of care at the district level (and to a lesser degree at the state level) can be detrimental for neonatal, infant, and under-five mortality. In order to achieve large improvements in child survival, there must be concomitant improvements on training of service providers to treat complications, ensuring adequate emergency obstetric-care facilities, specialist and staff, essential drugs and necessary equipment, and allocating resources to facilities in proportion to caseloads and actual need.12)
Another important policy implication of our findings is in identifying the geographic level that contributes most to the total variation in neonatal, infant, and under-five mortality. While programs on maternal and child health in India tend to focus on districts or states for the purpose of monitoring and intervention, we found the largest contextual variation in mortality outcomes attributed to within-district local area. Therefore, the role of communities merits further investigation to better understand the geographic disparity in child survival in India. Previous multilevel studies on poverty28) and catastrophic health spending42) also documented the importance of village level. In our study, a substantial fraction of the contextual variation was explained by the individual and contextual predictors, indicating that their clustering has largely induced geographic variation in neonatal, infant, and under- five mortality.
CONCLUSION
We used the India DHS from 2015~2016 to demonstrate a method to construct contextual provider quality indicators based on individual-level data on access to care during pregnancy and at delivery. Based on a multilevel analysis, we found consistent evidence to support the importance of both individual use of ANC and SBA and contextual provider quality in respect to neonatal, infant, and under-five mortality. When simultaneously considered, contextual provider quality mattered more than individual use of ANC and SBA for all mortality outcomes and they explained substantial geographic variation especially at the district level. Further investigations are needed to assess the importance of improving quality of health service delivery at higher levels to prevent unnecessary child deaths in developing countries.


 XML Download