

 PDF
PDF ePub
ePub Citation
 Print
Print


INTRODUCTION
The nutritional and hormonal status of an animal during fetal and early life may determine the long-term control of energy metabolism, in particular by programming future feeding behavior and energy expenditure regulation [12]. These factors may play a key role in determining susceptibility to obesity and metabolic disease in adult life [3]. Adverse prenatal environmental influences may induce permanent adaptive changes in the developing fetus that may promote survival in the short-term but may increase vulnerability to later obesogenic environmental stimuli [45]. Over-nutrition from lactating obese dams or from the post-weaning diet may also amplify the risk of metabolic and hormonal disorders during adult life and then induce obesity [6]. Leptin and insulin plays a critical role in the establishment of this programming [7]. Insulin is the major postprandial hormone and acts by moderating satiety signals generated by a meal in the brain tissue [8]. Animals that lack or are insensitive to insulin are known to be hyperphagic and to gain weight [9]. Leptin also plays a key regulator of energy homeostasis and neuroendocrine pathways within the hypothalamus to reduce body fat content and food intake [10]. Obese humans and rodents with elevated circulating leptin levels but less functional leptin receptors (LepRs) in the brain may develop severe obesity and hyperphagia through blunting leptin sensitivity [11]. The key targets of leptin action are not only orexigenic neurons that express the peptides neuropeptide Y (NPY) and agoti-related protein (AgRP) but also anorexigenic neurons that express pro-opiomelanocortin (POMC) and cocaine amphetamine related transcript (CART) within the hypothalamic arcuate [12]. Since LepR, particularly the long form (Ob-Rb), is expressed at NPY/AgRP neurons and POMC/CART neurons, leptin is expected to act on the inhibition of NPY/AgRP neurons and on the stimulation of POMC/CART neurons through LepR [912]. The intracellular domain of LepR binds to activated signal transducer and activator of transcription protein 3 (STAT3) and then phosphorylation of STAT3, to induce the expression of these neuronal peptides [10]. Recently apolipoprotein E (ApoE), which has been found in the hypothalamus as a satiation factor, was reported to be modulated by leptin [13]. While central ApoE administration reduces food intake [14], the specific intracellular signaling mechanisms activated by ApoE remain largely unknown.
The development of a hypothalamic neuropeptide network begins after birth and is achieved at the end of the second or third postnatal week in rodents [15]. Early nutritional influences may impact the normal development and maturation of this neuroendocrine network. An easy access to high-fat foods has been implicated in the rise of obesity in both children and adults [16]. Leptin and insulin resistance (IR) due to prenatal malnutrition could be amplified by peri- and post-natal high fat nutrition through neuroendocrine modification. It is important to understand how metabolic and hypothalamic signals interact with each other depending on eating behavior. Although some studies observed that the influence of maternal over-nutrition or high-fat diet before and after the weaning on the development of metabolic disorders in offspring in adult offspring (hereafter, ‘adult offspring’) [1617], studies which elucidate the dietary effects on hypothalamic markers at early life stage of age are much to be done in an aspect of early prevention of metabolic disorders.
We hypothesized that maternal and/or post-weaning high-fat diet will affect hypothalamic appetite signaling, predisposing to offspring to obesity. We investigated how a high-fat diet during maternal and/or post-weaning affects growth, insulin and leptin resistance, and the hypothalamic responses of appetite genes and leptin signaling in adult offspring. Furthermore, we observed whether a post-natal control diet after weaning could be ameliorate the adverse effects of exposure to the maternal high-fat diet.
MATERIALS AND METHODS
Animals
The animal protocols used in the present research followed the “Guide for the Care and Use of Experimental Animals” issued by the Animal Care and Use Committee of the Korea Centers for Disease Control and Prevention (KCDC) and the Korea Food and Drug Administration, and were reviewed and approved by the Animal Ethics Committee of KCDC (KCDC-12-026-1A) and Kyungnam University (KUIAC-17-04). Eight-week-old female and male Sprague Dawley rats were purchased from Japan SLC (Shizuoka, Japan) and were housed in individual cages at 22°C ± 2°C with a 12-hour light-dark cycle. All rats were acclimated to this environment with ad libitum access to water and Purina Rat Chow (Purina #5001 Chow; Dyets, Inc., Bethlehem, PA, USA). Females were mated following the 2 weeks acclimation period. After mating was confirmed with the presence of vaginal plug, the pregnant female rats were randomly assigned to a high-fat diet (n = 8, H group) or a control diet (n = 8, C group). Animals consumed their respective diets from gestation to weaning. Dams were weighed throughout gestation. After birth, pups were weighed, and the litter size was reduced to 10 pups per dam in order to ensure sufficient milk supply and to equal numbers of males and females. After litters were weaned at postnatal week 3, offspring from the control diet and high-fat diet dams were assigned to either a high-fat diet or a control diet and fed their diet until the end of the experimental at 7 weeks of age, giving rise to 4 dietary groups in order to sacrifice for blood parameters and hypothalamic parameters. We refer to the offspring born to high-fat diet dams as H-H and H-C groups according to their post-weaning diets. Offspring born to control diet dams are referred to as C-H and C-C groups according to their post weaning diet. The first letter refers to the maternal diet (pregnancy and lactation), second letter to the diet from weaning to 7 weeks of age.
The experimental diet was modified by changing the fat and carbohydrate content, based on the AIN-93M diet (ICN Biomedicals Inc., Irvine, CA, USA). The C group provided 3.82 kcal/g (dry weight) and contained the following metabolic energy content (kcal %): 21% protein, 12% fat, and 67% carbohydrate. The H group provided 4.70 kcal/g (dry weight) and contained the following metabolic energy content (kcal %): 17% as protein, 43% as fat, and 40% as carbohydrate. Beef tallow was used as the main fat source and corn oil was added to 4% of total fat weight to supply essential fatty acids. The vitamin and mineral content in the 2 diets were identical and in accordance with the requirements for standard rat diets. Water was freely available throughout the experiment, and body mass was recorded every week. Food intake was measured every 2 days for the duration of the experiment.
Oral glucose tolerance test
After 7 weeks of maternal and post-weaning diet modification, rats were deprived of food overnight and subjected to an oral dose of glucose (2 g/kg body weight). Blood samples were obtained from the tail at 0, 30, 60, 90, and 120 minutes after glucose administration to measure glucose concentration. Blood glucose was measured using a Super Glucocard II analyzer (ARKRAY, Inc., Kyoto, Japan).
Blood and tissue collection
At the end of week 7, rats were fasted overnight and anesthetized using CO2. Blood was collected with heparinized tubes by heart puncture. Plasma was separated by centrifugation at 3,000 rpm and 4°C for 20 minutes and stored at −80°C until further analysis. Abdominal fat, liver, and brain tissues were excised and frozen immediately in liquid nitrogen, and stored at −80°C until further analysis.
Biochemical analysis of plasma and liver
Concentration of serum glucose (AM-201K), triglyceride (TG, AM-157SK), total cholesterol (TC, AM-202K), high-density lipoprotein cholesterol (HDL-C), and low-density lipoprotein cholesterol (LDL-C) were determined using an enzyme assay method (Asan Pharmaceutical, Yongin, Korea). Free fatty acids (FFAs) were determined using a NEFA kit (Wako, Osaka, Japan). Enzyme immunoassays were performed to measure plasma insulin (Rat Insulin Kit RPN2567; Amersham, Buckinghamshire, UK) and leptin (Mouse/Rat Leptin ELISA Kit, 022-LEP-E06; ALPCO Diagnostics, Salm, NH, USA). An IR index was calculated as follows:
IR index = fasting serum insulin concentration (ng/mL) × fasting serum glucose concentration (mM/L) ÷ 22.5
after modifying the method of Matthews et al. [18] by using insulin concentrations instead of insulin units. Lipid composition of liver was measured after lipid extraction. Liver were homogenized, and tissue lipid was extracted in chloroform-methanol solution according to Bligh and Dyer method [19]. The solution was centrifuged after addition of 0.9% NaCl, and the lower phase was collected for evaporation. Then phosphate-buffered saline (pH 7.4) containing 1% Triton-100 was added to dissolve the remaining pellet. Hepatic TG and cholesterol concentrations were measured using the same commercial kits as those used with the plasma.
Western blotting
The hypothalamus was homogenized in 50 mM Tris-HCl, 100 mM NaCl, and 1 mM EDTA (pH 7.5) containing a protease inhibitor cocktail (Roche diagnostics, Indianapolis, IN, USA) and a phosphatase inhibitor (Pierce, Rockford, IL, USA). Equal amounts of hypothalamus whole lysate protein were separated by 6%–8% sodium dodecyl sulfate polyacrylamide gel electrophoresis, transferred to polyvinylidene difluoride membranes, incubated in blocking buffer, and treated with primary antibodies. Rabbit polyclonal antibodies against actin were obtained from Santa Cruz Biotechnology Inc. (Santa Cruz, CA, USA). Rabbit polyclonal antibodies against phospho-STAT3 (pSTAT3 [Tyr705]), STAT3 (Cell Signaling Technology, Denver, MA, USA), and Ob-R (Santa Cruz Biotechnology Inc.) were used. Appropriate secondary antibodies were used, and the bands were visualized using enhanced chemiluminescent Western Blotting Detection Reagents (RPN2106; Amersham) and X-ray film (AGFA, Mortsel, Belgium). Tina 2.0 software (Silk Scientific Inc., Orem, UT, USA) was used for densitometric analysis of immunoreactive bands. Actin levels were determined for each blot to verify equal protein loading.
Real-time polymerase chain reaction (PCR)
Total RNA from the hypothalamus was extracted from tissues using TRI reagents (Molecular Research, Cincinnati, OH, USA) according to the manufacturer's instructions. RNA was treated with RNase-free DNase I before reverse transcription. For quantitative PCR, cDNA was synthesized using an oligo-dT primer with SuperScript II Reverse Transcriptase (Invitrogen, Carlsbad, CA, USA). RNA expression was quantified by real-time quantitative PCR using SYBR green PCR reagents (Applied Biosystems, Foster City, CA, USA) and the ABI PRISM 7300 Real-time PCR system (Applied Biosystems). The relative quantitation (r.q.) value was calculated by analyzing changes in SYBR green fluorescence during PCR according to the manufacturer's instructions. Data are expressed as 2−DDCT values obtained by normalizing to b-actin and normalizing mean ΔCT values to the C-C group. Rat-specific gene primers were as follows: β-actin forward 5′-GGCCAACCGTGAAAAGATGA-3′, reverse 5′-CACAGCCTGGATGGCTACGT-3′; NPY, forward 5′-CCGCTCTGCGACACTACATC-3′, reverse 5′-GGGCTGGATCTCTTGCCATA-3′; AgRP, forward 5′-CACCCTGGGAACAGTGTGT-3′, reverse 5′-GGCCTCCCTTGGGTTCCT-3′; POMC, forward 5′-GGCCTTTCCCCTAGAGTTCAA-3′, reverse 5′-ACGTGCTCCAAGCCATCAG-3′; CART, forward 5′-CCGAGCCCTGGACATCTACTC-3′, reverse 5′-GCCTTGGCAGCTCCTTCTC-3′; ApoE, forward 5′-CTGGTTCGAGCCGCTAGTG-3′, reverse 5′-CGTGTATCTTCTCCATTAGGTTTGC-3′.
Statistical analysis
All data were expressed as mean ± standard error (SE) and were analyzed using Statistical Analysis Systems statistical software package version 9.4 (SAS Institute, Cary, NC, USA). Comparisons between groups were made using one-way analysis of variance (ANOVA) followed by Duncan's multiple range tests. Differences between means were considered statistically significant at p < 0.05. For the study comparing sex and diet differences in the parameters measured, we analyzed by two-way ANOVA for the sex (male vs. female), the main effects of diet (C vs. H), and sex × diet interactions. For the study comparing overall diet effect, the data were analyzed by two-way ANOVA for the effects of maternal (pregnancy and lactation) diet, post-weaning diet, and maternal diet × post-weaning diet.
RESULTS
Body mass, fat mass, and dietary intake
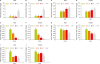
There was no significant difference in maternal food intake (H group, 131.4 ± 3.6 kcal/day; C group, 111.2 ± 27.7 kcal/day) and maternal body weight gain (H group, 80.8 ± 7.7 g/week; C group, 75.0 ± 6.8 g/week) during pregnancy and lactation. The different maternal diets throughout the prenatal period did not significant change litter size (H group, n = 13.71 ± 0.78; C group, n = 14.88 ± 0.64) and mean value of pups' birth weight (H group, 6.19 ± 0.23 g; C group, 6.03 ± 0.35 g). However, the maternal high-fat diet significantly increased body weight of offspring at 3 weeks of age compared to control diet (H group, 39.4 ± 0.7 g vs. C group, 32.2 ± 0.6 g, p < 0.05). The average daily caloric intake of offspring from week 3 to 7 is shown in Fig. 1A. The average daily caloric intake was significantly increased in the H-H group compared with all the other groups in both sexes. Groups fed a control diet (C-C and H-C group) after weaning consumed significantly less energy intake in both sexes than H-H group. Female C-H offspring that switched to a high-fat diet from the control diet after weaning significantly more consumed than C-C group (Fig. 1A). Body weight changed according to maternal or post-weaning dietary treatment at week 7 (Fig. 1B). Female offspring had significantly lower body weight than male counterparts throughout the experimental period (Fig. 1B). We did not observe a significant difference in body mass among the various diet treatment groups in male adult offspring (Fig. 1B). However, H-H group's offspring in female rats were significantly heavier than C-C group's offspring reflecting energy intake (Fig. 1B). The body mass of H-C group's offspring was also significantly lower than that of H-H group's female offspring. Although it has increased, the body mass of C-H group's offspring was not significantly higher compared to C-C group's offspring (Fig. 1B).
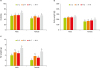 | Fig. 1Energy intake (A), body mass (B), and fat mass (C). Values are mean ± standard error (n = 6 per sex per group).
*,†,‡Groups with different marks are significantly different at p < 0.05.
|
Both of maternal and post-weaning dietary modifications led to changes in fat mass (Fig. 1C). The fat mass was significantly higher in H-H group compared to the C-C group in both sexes. The fat mass of H-C group's offspring was significantly lower than that of H-H group's offspring in both sexes, but it was not significantly different in the C-H group, in spite of increasing trend of fat accumulation compared to the C-C group (Fig. 1C).
The levels of biochemical parameters in plasma and liver
After 7 weeks of maternal and post-weaning dietary modifications, glucose intolerance was significantly increased in H-H group compared with C-C group in both sexes (Fig. 2A and 2B). Although the levels of fasting glucose were not significantly changed (Fig. 2A-2C), the fasting plasma insulin level and IR index in H-H group in both sexes were significantly increased compared with C-C group, indicating overall impairment in insulin sensitivity (Fig. 2D and 2E). In male H-C group's offspring that switched to a control diet from high-fat diet after weaning, it was significantly improved glucose tolerance and insulin sensitivity, as can be seen from the decline of the levels of insulin and IR index and the results of glucose intolerance test (Fig. 2A, 2D, and 2E). Plasma leptin levels were closely related to body mass and dietary intake, reflecting body fat deposition. The plasma leptin levels were also significantly higher in the H-H group compared to the C-C group in both sexes. C-H group had significantly higher leptin levels compared with C-C group in both sexes (Fig. 2F). On the contrary, the effect of switching to the control diet on plasma leptin levels could be seen in female rats only (H-C vs. H-H; Fig. 2F).
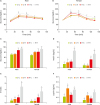 | Fig. 2Glucose tolerance (A, B), plasma glucose (C), insulin (D), IR index (E) and leptin (F) levels. Values are mean ± standard error (n = 6 per sex per group).IR, insulin resistance.
*,†,‡Groups with different marks are significantly different at p < 0.05.
|
The plasma levels of TC and LDL-C in H-H offspring were higher, respectively, than in C-C offspring in both sexes (p < 0.05). However, there were no significant differences in the plasma levels of TG, FFA, and HDL-C. The hepatic TG concentration was higher in H-H group's offspring than in C-C group's offspring in both sexes but TC concentration was higher in H-H group's offspring than in C-C group's offspring in female (p < 0.05). The lipid content of plasma and liver were significantly changed by the long-term high-fat diet intake. However, diet switching effect to the control diet or the high-fat diet on plasma and liver lipid levels could not be seen in both sexes (Table 1).
Table 1
Plasma lipid composition
Values are mean ± standard error (n = 6 per sex per group).
TG, triglyceride; TC, total cholesterol; HDL-C, high-density lipoprotein cholesterol; LDL-C, low-density lipoprotein cholesterol; FFA, free fatty acid.
*,†Different superscript marks were significantly different between groups at p < 0.05.
![]()
We observed that the type of dietary intake plays an important role in the change of the calorie intake, body weight, fat mass, insulin, IR index and leptin. Maternal diet or post-weaning diet also affected these parameters but the changes were not consistent (Table 2).
Table 2
The effect of maternal and post-weaning diet on parameters in offspring
BW, body weight; IR, insulin resistance; LepR, leptin receptor; pSTAT3, phosphorylation of signal transducer and activator of transcription protein 3; NPY, neuropeptide Y; AgRP, agoti-related protein; POMC, pro-opiomelanocortin; CART, cocaine amphetamine related transcript; ApoE, apolipoprotein E; NS, not statistically significant at p < 0.05.
Two-way analysis of variance test to observe the sex and diet effect or the maternal and post-weaning diet effect: *Maternal: effect of the diet up to weaning from pregnant (prenatal and pre-weaning period); †Post-weaning: effect of the diet after weaning; ‡Maternal x post-weaning; Interaction of the effect of the diet up to weaning from the pregnant and the effect of the diet after weaning.
![]()
Expression of hypothalamic appetite genes
Hypothalamic mRNA expression of appetite-relating genes responded to maternal and post-weaning dietary modification similarly in both sexes. Long-term high-fat diets significantly increased orexigenic genes and significantly reduced anorexigenic genes compared to control diets. Orexigenic NPY and AgRP mRNA expression were significantly higher in H-H group compared with C-C group (Fig. 3A-3D). In contrast, mRNA expression of anorexigenic POMC, CART, and ApoE were significantly lower in offspring from H-H group compared with C-C group (Fig. 3E-3J). As a result of dietary switching after weaning, NPY and AgRP mRNA expression level of C-H group were not significantly different compared with those of C-C group (Fig. 3A-3D) in both sexes. However, both male and female C-H group showed significantly lower mRNA expression of POMC and ApoE than C-C group. C-H group rats showed lower CART mRNA expression compared with C-C group only in female. In the contrary, according to supply high-fat diet, male H-C group showed lower NPY expression in both sexes and lower AgRP expression in female than H-H group (p < 0.05). H-C group had significantly higher POMC mRNA expression than H-H group in both sexes. CART mRNA expression was higher in H-C group rats than H-H group rats, and this condition could be seen in male rats (p < 0.05). Female H-C rats showed higher ApoE mRNA expression than female H-H group (p < 0.05).
 | Fig. 3NPY (A, B), AgRP (C, D), POMC (E, F), CART (G, H), and ApoE (I, J) mRNA levels in the hypothalamus. Values are mean ± standard error (n = 6 per sex per group).NPY, neuropeptide Y; AgRP, agouti-related protein; POMC, pro-opiomelanocortin; CART, cocaine and amphetamine related transcript; ApoE, apolipoprotein E.
*,†,‡,§Groups with different marks are significantly different at p < 0.05.
|
When we consider sex effect and diet effect by two-way ANOVA, we observed the sex and diet interactions in the gene expression of CART (p < 0.000) and ApoE (p < 0.02) but not in the gene expression of NPY, AgRP, and POMC. When we consider the maternal and post-weaning diet effect by two-way ANOVA, the expression of NPY, POMC, CART, and ApoE were affected by maternal (pre-weaning) and post-weaning diet in both sexes. The expression of AgRP was affected by both of maternal and post-weaning diet in female rats but it was affected only by maternal diet in male rats. There were interactive effects between maternal and post-weaning diet on NPY and POMC mRNA level in both sexes (Table 2).
Effect of dietary changes on hypothalamic LepR and STAT3 levels
Hypothalamic LepR protein levels were significantly affected by maternal diet as well as post-weaning diet in both sexes (p < 0.01; Table 2). LepR protein levels were significantly lower in the H-H group compared to the C-C group in both sexes. Switching to the post-weaning high-fat diet (C-H group) significantly decreased LepR protein level when we compared with C-C group in both sexes. On the contrary, H-C group showed higher LepR protein levels than H-H group in male and female rats (Fig. 4A and 4B).
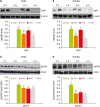 | Fig. 4LepR (A, B) and STAT3 phosphorylation (C, D) in the hypothalamus. (A, C) are the results for males and (B, D) are the results for females. Values are mean ± standard error (n = 6 per sex per group).LepR, leptin receptor; STAT3, signal tranducer and activator of transcription protein 3; pSTAT3, phosphorylation of STAT3.
*,†,‡Groups with different marks are significantly different at p < 0.05.
|
To test whether LepR can regulate downstream targets such as STAT3, we measured pSTAT3 (Tyr 705) levels in the hypothalamus of rats. In both sexes, we observed lower hypothalamic pSTAT3 levels in rats exposed to high-fat diets (C-H, H-C, and H-H groups) compared to animals in the C-C group (Fig. 4C and 4D). Especially, H groups (C-H and H-H groups) significantly decreased pSTAT3 levels compared to the C group (C-C and H-C groups) in female rats. The level of pSTAT3 was significantly affected not only by sex × diet type but also by maternal diet (pre-weaning) × post-weaning diet (Table 2).
DISCUSSION
The adverse environmental conditions during early life plays important roles in the development of hypothalamic neuronal systems, which might predispose offspring to become obese adults. Results from male and female offspring indicated that exposure to long-lasting high-fat diet consumption during maternal (prenatal and pre-weaning) and post-weaning periods showed significantly increased body weight, fat mass, plasma insulin and leptin, glucose intolerance, IR and orexigenic genes (NPY/AgRP) mRNA and decreased the levels of anorexigenic genes (POMC/CART) mRNA with decreased protein levels of LepR and STAT3 activation (pSTAT3). These detrimental effects were partially reversed by switching the diet from high-fat diet to control diet, while the beneficial effects were deteriorated by switching the diet from control diet to high-fat diet after weaning. Although some biochemical parameters did not change in the same direction depending on sex, female offspring were more affected than male offspring, as leptin, food intake and body weight were increased in females due to high-fat diets after weaning. Providing control diet after weaning lowered calorie intake, fat weight and plasma insulin and leptin levels, IR, accompanied with decreased appetite-promoting genes and increased appetite-suppressing genes and leptin signal. In the contrary, post-weaning high-fat diet induced an opposite pattern to that seen by the control diet. Post-weaning high-fat diet increased leptin levels and decreased appetite-suppressing genes and leptin signal, which appeared more clearly in the female offspring than in the male offspring. The effect of post-weaning dietary modification like this was more effective when the high-fat diet converted to the control diet than when the control diet converted to high-fat diet. It could be proposed that the hypothalamic programming effects of maternal obesity and/or high-fat diet on offspring hypothalamic energy regulation. Exposure to an overnourished environment during early life potentiates development and expression of orexigenic peptide and perhaps neurons, probably promoting hyperphagia and obesity. This implies that exposure to high calorie meals in the early stages of life has a greater impact. The exposure to maternal high-fat diet increases the risk of this programming, a risk further exacerbated by post-weaning high-fat diet consumption. This is indicated that post-weaning diet also can modify some extend the hypothalamic programming formed in maternal period. However, an early nutritional intervention, consumption of the control diet at weaning, was not sufficient to ameliorate many of these changes in hypothalamic programming although it shows improving effects.
Previously the consequences of a maternal high-fat diet during gestation or lactation, or both, on offspring were reported in some studies [517]. In those studies, the offspring from obese dams fed a high-fat diet during mating, gestation and lactation became gained more weight than those from lean dams. Maternal obesity status also continued until weaning. In our study, although the maternal and post-weaning high fat-diet did not affect the apparent maternal obesity and the reduction of litter size and offspring's birth weight, those dietary conditions could eventually affect energy metabolism in offspring. In addition, maternal high-fat diet during maternal (pregnancy and lactation) could continuously affect energy balance of offspring that switched from high-fat diet to the control diet after weaning.
To explore the underlying mechanisms of these long-term maternal and post-weaning effects on body mass due to high-fat feeding or diet modification, we have discussed this mechanism in more detail through the relationship between insulin and leptin resistance, and appetite-regulating genes. Consistent with other reports [2021], the maternal and the postnatal high-fat diet predisposed offspring to increased adiposity at 7 weeks of age in both sexes. Offspring fed a high-fat diet throughout the study showed the highest insulin and leptin levels and the highest fat mass and caloric intakes among groups. Providing control diet after weaning decreased fat mass compared to high-fat diet after weaning. Insulin is involved in the control of eating behavior by moderating satiety signals generated by a meal [78]. Insulin directly inhibited orexigenic NPY and AgRP and stimulated anorexic POMC and CART neurons [12]. On the other hand, the benefits promoted by insulin centrally are not found in situations of resistance of this hormone. The decreased sensitivity to insulin results in increased food consumption and in inaccurate valuation of foods, contributing to impulsive eating and obesity [8]. In our study, IR was positively correlated with energy intake, body and fat weight and the mRNA expression of NPY and AgRP and negatively correlated with the mRNA expression of POMC and CART. IR seems to be involved in reducing peripheral insulin transport and its uptake into the brain, turning the neurons less able to control appetite. Leptin is mainly secreted by adipocytes in proportion to body fat content and acts both in the brain and in the peripheral tissues. Leptin is also key signaling molecule responsible for long-term satiety and energy balance. Leptin acts on the hypothalamus through its long-form LepR and regulates food intake and energy expenditure [22]. Mutations that cause defective leptin secretion or abnormal LepR signaling result in obesity in ob/ob mice [23]. Because obesity is associated with central leptin resistance, we have focused on identifying the mechanisms involved in the action of leptin on hypothalamic neural circuitry for energy homeostasis. In our study, both of maternal and post-weaning high-fat diet significantly increased plasma leptin levels but significantly decreased hypothalamic LepR levels. Reduced hypothalamic expression of LepR possibly decreased the accessibility of leptin to hypothalamus. It consequently could affect feeding centers which contain neuropeptide-producing neuronal cells that express LepR and then regulate the expression levels of neuropeptides. Actually, high-fat feeding during early developmental stages could subsequently increase food intakes and body fat accumulation by increasing the expressions of orexigenic NPY and AgRP and decreasing the expression of anorexigenic peptides such as CART and POMC. Therefore, insensitivity to leptin action due to a high-fat diet during early developmental stages also could be one of the main mechanisms behind the regulation of food intake and the development of obesity.
Defects in hypothalamic leptin signaling are to be associated with the STAT3-dependent pathway [23]. A leptin surge, likely produced by differentiating white adipose tissue, is observed in rodent pups during the first 3 weeks of life [1524]. Mice that possess defects in the LepR or leptin synthesis, i.e., db/db mice or ob/ob mice, do not show pSTAT3- or STAT3-positive cell bodies in the ARC, respectively [25]. In our study, LepR showed positive correlation with pSTAT3. Hypothalamic pSTAT3 levels was lower in the maternal and post-weaning high-fat diet than that of the control diet at week 7 and its expression closely reflects blood leptin levels in these animals. Out data suggest that the decreases of LepR and pSTAT3 level would significantly increase the appetite through increasing NPY and AgRP and decreasing POMC and CART, and result in the decrease of energy intake, body weight and fat mass. The decreased pSTAT3 expression can inhibit leptin signaling, leading to leptin resistance in rats consuming high-fat diet. Leptin response through pSTAT3 activation could be acquired during the second week of postnatal life [26]. Leptin begins to accelerate the metabolic rate and promotes insulin sensitivity before it becomes capable of inducing a reduction in food intake [27]. In current experiment, dietary changes at week 3 of postnatal life might influence neurotrophic actions on immature CNS cells and its modification has been shown to have long-term effects on metabolism. There was some improvement of STAT3 activation and ApoE expression in female post-weaning C group, compared to the maternal and post-weaning H group, although this did not reach statistical significance in male rats.
ApoE is essential for the normal catabolism of triglyceride-rich lipoprotein constituents and is initially recognized for its importance in lipoprotein metabolism and cardiovascular disease [28]. More recently, ApoE is also known to be highly expressed in the hypothalamus and act as a physiological controller of food intake [1329]. Impairments in ApoE production could lead to chronic increases in meal sizes, which might result in obesity. We observed that the expression of hypothalamic ApoE mRNA was significantly lowered in maternal and post-weaning high-fat diet compared to the control diet. It showed a very close negative relationship between ApoE level and energy intake, which suggested that reduced ApoE levels contributed to hyperphagia. ApoE also has a positive relationship with LepR protein level, pSTAT3, POMC and CART levels and a negative relationship with AgRP and NPY. Prospective role of ApoE in energy balance made an explanation by the relationship between ApoE level and energy intake, body weight and fat mass. It was first observed that ApoE has a close relationship between Leptin and STAT3 signaling pathway in hypothalamus and their levels were significantly reduced in adult offspring fed maternal high-fat diet or post-weaning high-fat diet. The molecular mechanisms mediating the anorectic action of ApoE needs to be explored in future experiments.
CONCLUSION
The present study suggests the importance of diet on the regulation of hypothalamic gene expression and energy intake during growth. These differences according to diet type and exposed time were accompanied by some modifications in neuroendocrine gene expression through insulin-leptin-signaling pathway. The long-term high-fat diet during early life could lead to insulin and leptin resistance, decreased levels of hypothalamic LepR, decreased activation of STAT3, decreased anorexic genes, increased expression of orexigenic genes, increased energy intake, and increased risk of obesity. Switching the diet post-weaning may partially reverse these conditions. These results suggest that maternal and post-weaning diet conditions can alter the susceptibility of offspring to future metabolic disorders. Predispose to an overnourished environment during early life potentiates development and expression of orexigenic peptide, probably promoting hyperphagia and obesity. Although the post-weaning environment could modify early nutritional programming during early life, it was not sufficient to ameliorate many of these changes in hypothalamic programming.
 XML Download