

 PDF
PDF ePub
ePub Citation
 Print
Print


INTRODUCTION
Numerous in vitro experimental assays have been designed to screen pro- and/or anti-angiogenic drugs. These assays measure the abilities of endothelial cells (ECs) regarding proliferation, migration, invasion, and the formation of tubular structures. Among them, the tube formation assay is simple, rapid, quantitative, and cost-efficient; therefore, many laboratories commonly use it to obtain initial evidence of angiogenic properties. During the drug-development process, in vitro experimental data are critical when considering the advisability of moving forward to in vivo studies. Thus, the attention to additional detail of the widely used tube formation assay is necessary to improve the quality of pre-clinical data, leading to better decision-making for successful angiogenesis drug discovery.
ECs used in tube formation assays have considerable organ- and tissue-specific heterogeneity [1]. Human umbilical vein endothelial cells (HUVECs) and human dermal microvascular endothelial cells (HDMECs) are commonly used for this assay due to their wide availability [2]. However, these mature ECs require close monitoring due to their decreased proliferation capacity over time. Endothelial progenitor cells (EPCs) circulating in the peripheral blood have been reported to have robust proliferation capacity [3] and can be a new cell source for tube formation assays. Since being first identified by Asahara et al. [4], several subpopulations of EPCs have been identified. The current consensus is that ‘early’ EPCs promote neovascularization by secreting proangiogenic factors rather than by differentiating into endothelial cells [5]. ‘Late’ EPCs, also referred to as endothelial colony forming cells (ECFCs), are defined by the in vitro and in vivo assay to establish proliferative and functional potential for neovascularization [6]. It is now well accepted that ECFCs contribute to blood vessel formation in many post-natal pathophysiological conditions. For instance, circulating ECFCs are recruited to sites for vascular regeneration, such as ischemic tissues, where they are incorporated into the vascular endothelial lining and differentiate in situ into ECs [7]. It has also been reported that 40% of ECs in tumor tissue were derived from ECFCs that originated in the bone marrow [8]. These data suggest that application of ECFCs in tube formation assays is warranted to discover angiogenesis modulators.
Angiogenesis is a tightly-regulated, multi-step process [9]. First, angiogenic factors, such as vascular endothelial growth factor (VEGF) and fibroblast growth factor-2 (FGF-2), bind to their receptors on endothelial cells, activating signal transduction pathways. Matrix metalloproteinases (MMPs) are then released and degrade the extracellular matrix, allowing activated ECs to migrate out of the pre-existing vessel wall. Integrins expressed by ECs facilitate EC adhesion to the extracellular matrix and their migration. Angiopoietin-2 released from activated ECs then binds to Tie-2 receptors on the ECs, resulting in vessel sprouting. Finally, ECs release platelet-derived growth factor (PDGF), that chemo-attracts pericyte precursors which become associated with endothelial cells and differentiate into pericytes. In this multi-step angiogenesis process, a single cell goes through a dynamic progression in which tubular structures are created, elongated, and then regress in a time-dependent manner. Because tube formation assay results can be influenced by the observation time points, continuous measurement of the process is crucial to obtaining more detailed information compared with observing at one or two time points.
The purpose of the present study was to improve the widely used tube formation assay system in three respects. First, we used human ECFCs, endothelial precursors, for the assay. Second, we utilized a real-time cell recorder (NanoEnTek, Seoul, Korea) to continuously monitor tube formation for 48 hours. Third, to minimize analysis error due to the limited observation area, we used image-stitching software to increase the microscope field of view as large as 2×2 stitched area from the 4× object lens. This advanced tube formation assay system successfully measured the time-dependent progression of tube formation. Two angiogenic factors, VEGF and FGF-2, and VEGF inhibitor, vatalanib, were applied to verify the new assay system. The angiogenic effects of VEGF, FGF-2, and VEGF+FGF-2 were clearly distinguished by the new assay system. IC50 values of vatalanib was different at each observation time point. These results suggest that our advanced tube formation assay system can mimic the dynamic progression of tube formation from cells in response to angiogenic modulators. Therefore, this can be a sensitive and versatile assay model to evaluate potential pro- or anti-angiogenic drug candidates.
Go to : 
METHODS
Isolation and culture of human ECFCs
The study protocol was approved by the institutional review board of Duksung Women's University (IRB No. 2017-002-001). ECFCs were isolated from the adherent mononuclear cell (MNC) fraction of human peripheral blood using CD31-coated magnetic beads (Invitrogen, MA, USA) as described previously [10]. The isolated ECFCs were expanded on 1% gelatin-coated plates (BD Biosciences, NJ, USA) using endothelial growth medium-2 (EGM-2 without hydrocortisone; Lonza, MD, USA) supplemented with 10% fetal bovine serum (FBS; Atlas Biologicals, CO, USA) and 1% glutamine-penicillin-streptomycin (GPS; Gibco, MA, USA). ECFCs between passages 7 and 10 were used for all experiments.
In vitro tube formation assay
The capability of ECFCs to form tubule-like structures was determined using a tube formation assay with modifications of previous procedures [11]. Twenty-four-well plates were coated with ice-cold Matrigel solution (Phenol Red-Free; BD Biosciences, NJ, USA) and incubated at 37℃ for at least 30 min to allow the Matrigel to solidify. ECFCs were harvested, suspended in FBS-reduced medium (2%), seeded in the Matrigel-coated wells at a density of 15×104 cells/1 ml/well, and pre-incubated for 30 min at 37℃ for cell attachment. Images of the tubular structures were taken using a real-time cell recorder (NanoEntek, Seoul, Korea) every 1 h for 48 h.
Image preparation and data analysis
Image-stitching software was used to obtain a larger observation area. Real-time cell recorder automatically acquired four contiguous images of the 4× object lens at the same positions every 1 h for 48 h. The 2×2 stitched image was generated by the software, and used to quantify tube number and length by Image J software (NIH, MD, USA). The tube numbers at each time-point were normalized by the 6 hour-control tube number.
Statistical analysis
All values are expressed as the mean±SEM. The data was analyzed by ANOVA followed by Fisher's least significant difference post hoc test for multiple comparisons or Student's t-test for paired comparisons using Origin software (OriginLab, MA, USA). A value of p≤0.05 was considered statistically significant.
Go to :
RESULTS
Dynamic progression of tube formation from ECFCs
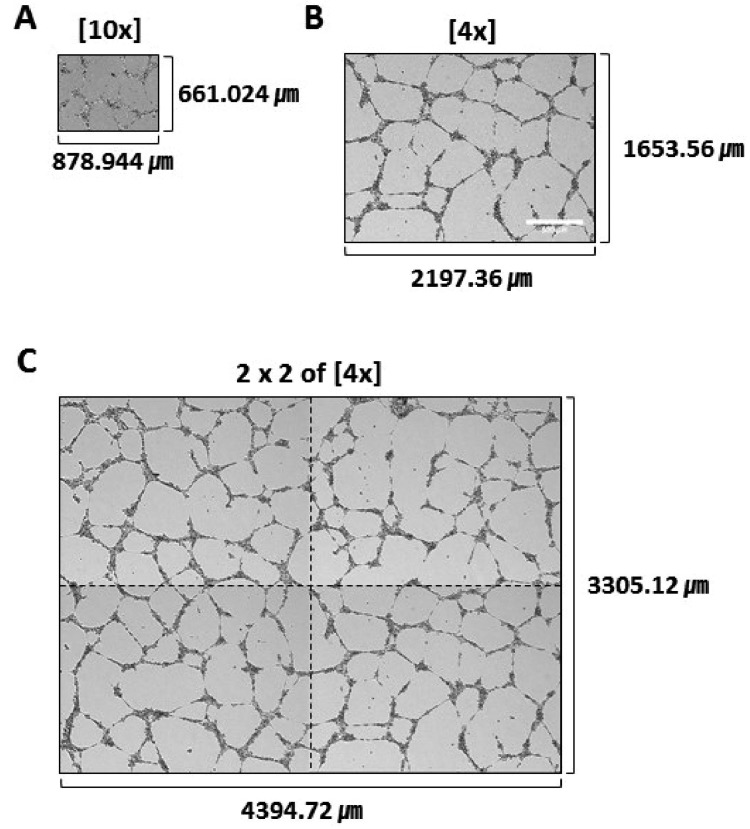
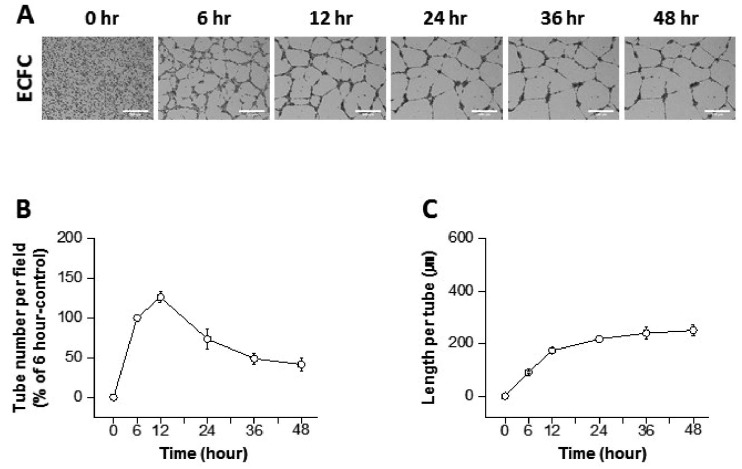
ECFCs were seeded at 15×104 cells/1 ml/well in 24-well plates coated with Matrigel. The tubular structures that formed in the thin Matrigel plaque were observed every 1 h for 48 h using a real-time cell recorder. Using a 4× object lens, 4 images were taken per well and stitched side-by-side, which enabled a 25-fold larger area to be analyzed compared to one image acquired using a 10× object lens (Fig. 1). The degree of tube formation was quantified using the number of tubes and length per tube. For the control, the tube number from ECFCs increased for the first 12 h and decreased at the later time points (Figs. 2A and B). Additionally, the length per tube increased until 12 h then did not change during the later observation time points (Figs. 2A and B). These results show the dynamic progression of tube formation in a single-cell suspension in which tubular structures are formed, elongated, and degraded in a time-dependent manner. This initial observation indicated that tube formation assays should be analyzed using a time-dependent image series taken at the same positions for at least 24 h to track the progression of tube formation.
Diverse effects of VEGF and FGF-2 on ECFCs tube formation
The proangiogenic factor VEGF induces vascular permeability and vascularization [12]. FGF-2 also promotes the physical organization of ECs into tube-like structures during angiogenesis [13]. In the present study, VEGF and FGF-2 were applied to verify our advanced ECFC tube formation assay system. ECFCs were treated with VEGF, and the tube number and length per tube were analyzed for 48 h (Supplemental video 1 and Fig. 3). At 6 h, 30 and 50 ng/ml of VEGF significantly increased the number of tubes compared with the control. ECFCs treated with 10 ng/ml VEGF also showed a tendency toward increased tube numbers at 6 h but not to a statistically significant degree (Figs. 3A, B, and D). The length per tube was slightly but significantly higher at all three concentrations of VEGF compared to the control at 6 h (Figs. 3A, C, and E). Subsequently, the tube numbers in the 50 ng/ml VEGF group rapidly decreased, but the remaining tube structures became elongated at the later time points, as demonstrated by the increased length per tube (Fig. 3A, D, and 3E). The degree of tube elongation was dependent on the VEGF concentration (Fig. 3E). These results show that an assay system using ECFCs can demonstrate VEGF-induced progression of angiogenesis in a time-dependent manner.
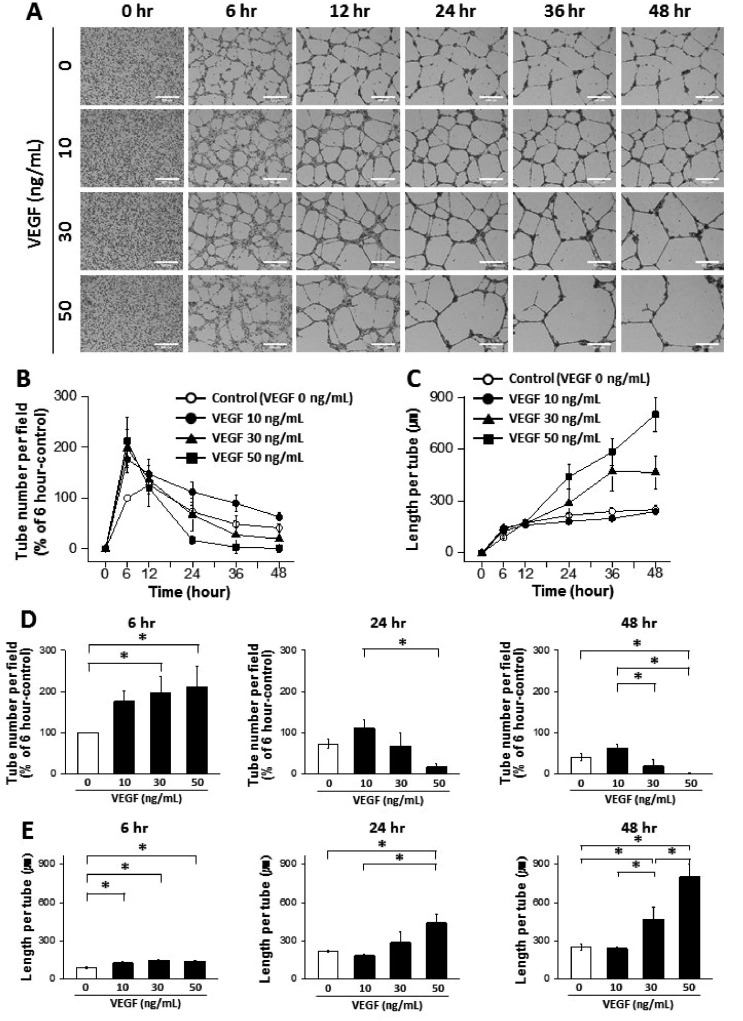 | Fig. 3Dynamic progression of tube formation from human endothelial colony forming cells (ECFCs) with treatment of vascular endothelial growth factor (VEGF).(A) Representative images of the tubular structures formed by ECFCs over 48 h in the presence and absence of VEGF (scale bar=500 µm). (B) Graph of the tube number over 48 h in the presence and absence of VEGF. (C) Graph of the length per tube over 48 h in the presence and absence of VEGF. (D) Statistical analysis of the tube number comparing 6, 24, and 48 h. (E) Statistical analysis of the length per tube comparing 6, 24, and 48 h. The asterisk (*) indicates a significant difference (p≤0.05) between groups (n=3–4).
|
The effects of FGF-2 on ECFCs were also tested (Supplemental video 1 and Fig. 4). Treatment with 10, 30, and 50 ng/ml FGF-2 increased tube formation at 6 h compared with the control, and the tube number became similar between the groups at the later time points (Figs. 4A, B, and D). The length per tube was significantly longer at 6 h in samples treated with 10 and 50 ng/ml of FGF-2, and became similar between the groups at the later time points (Figs. 4A, C, and E). These results confirm that our advanced assay system can replicate the physiological role of FGF-2, which is to stimulate ECFC to form tube-like structures in the initial step of angiogenesis.
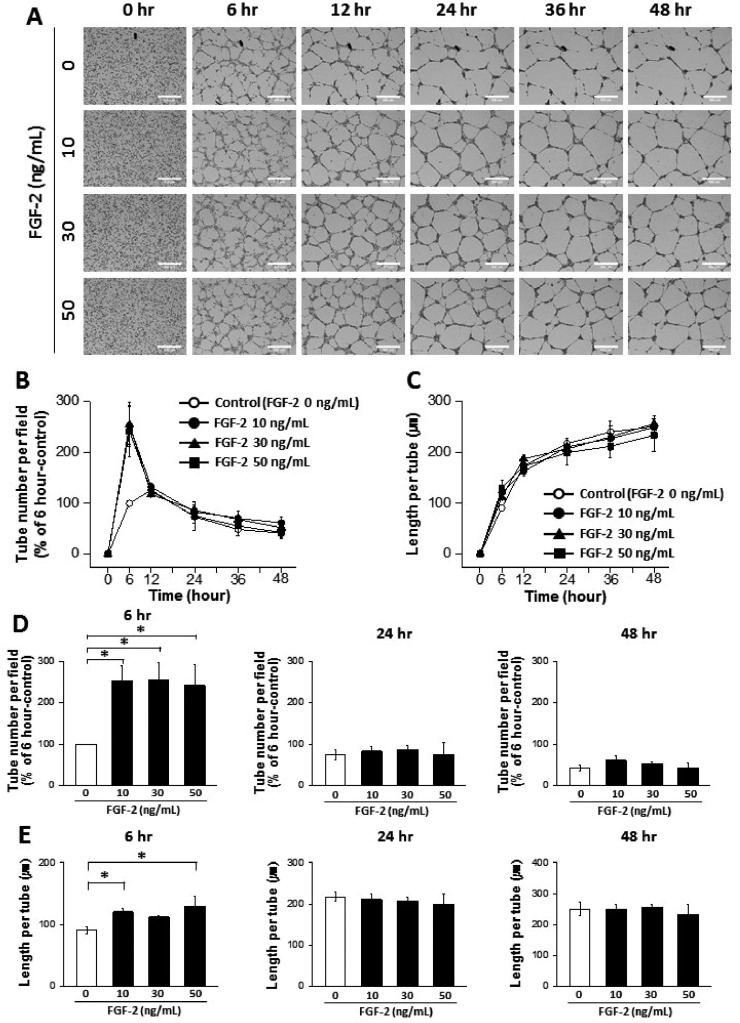 | Fig. 4Dynamic progression of tube formation from human endothelial colony forming cells (ECFCs) with treatment of fibroblast growth factor-2 (FGF-2).(A) Representative images of the tubular structures formed by ECFCs over 48 hours in the presence and absence of FGF-2 (scale bar=500 µm). (B) Graph of the tube number over 48 hours in the presence and absence of FGF-2. (C) Graph of the length per tube over 48 hours in the presence and absence of FGF-2. (D) Statistical analysis of the tube number comparing 6, 24, and 48 hours. (E) Statistical analysis of the length per tube comparing 6, 24, and 48 hours. The asterisk (*) indicates a significant difference (p≤0.05) between groups (n=3–4).
|
Co-treatment with VEGF and FGF-2 was also conducted to determine whether our assay system could demonstrate the synergic effects of combined pro-angiogenic agents (Supplemental video 1 and Fig. 5). Co-treatment of VEGF+FGF-2 (15 ng/ml of each) showed a significant increase in tube number than VEGF single treatment at 24 and 48 h (Fig. 5D). The increased tube number with VEGF+FGF-2 resulted in the reduced length per tube compared with either VEGF (30 ng/ml) or FGF-2 (30 ng/ml) at 48 h (Figs. 5D and E). These data suggest that the synergic effects of VEGF and FGF-2 can be demonstrated by our advanced tube formation assay system.
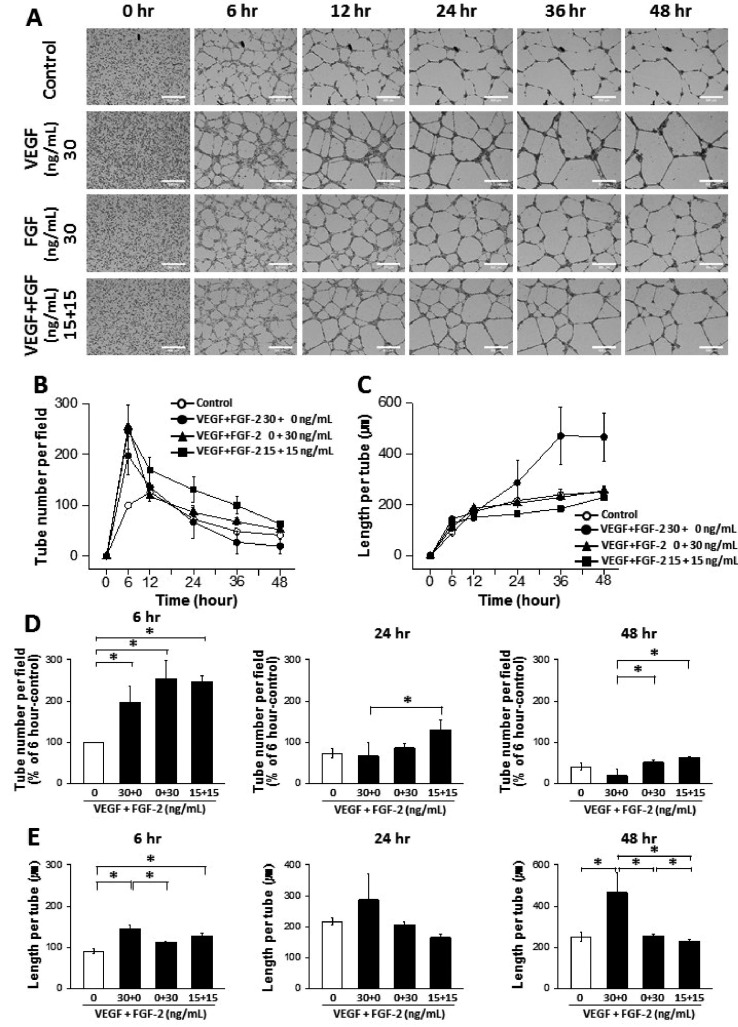 | Fig. 5Synergic effects of vascular endothelial growth factor (VEGF) and fibroblast growth factor-2 (FGF-2) on tube formation from human endothelial colony forming cells (ECFCs).(A) Representative images of the tubular structures formed by ECFCs over 48 h in the presence and absence of VEGF, FGF-2, and VEGF/FGF-2 (scale bar=500 µm). (B) Graph of the tube number over 48 h in the presence and absence of VEGF, FGF-2, and VEGF/FGF-2. (C) Graph of the length per tube over 48 h in the presence and absence of VEGF, FGF-2, and VEGF/FGF-2. (D) Statistical analysis of the tube number comparing 6, 24, and 48 h. (E) Statistical analysis of the length per tube comparing 6, 24, and 48 h. The asterisk (*) indicates a significant difference (p≤0.05) between groups (n=3–4).
|
Inhibitory effect of Vatalanib on tube formation of ECFCs
To examine the usability of our new assay system to screen anti-angiogenic drugs, ECFCs are treated with vatalanib (PTK787 or PTK/ZK), VEGF inhibitor. Vatalanib notably decreased tube number compared to control at 18 and 24 h (Supplemental video 2, Figs. 6A, and B). We assessed antiangiogenic IC50 values of vatalanib by examining the inhibition of tube formation. IC50 of vatalanib was 15.0±9.71 µM, 4.0±2.52 µM, and 5.5±2.70 µM at 12, 18, and 24 h, respectively (Fig. 6C). Wood et al. demonstrated that vatalanib inhibited VEGF-mediated cell proliferation (IC50=0.016±0.004 µM), and cell migration (IC50=0.058±0.010 µM) [14]. IC50 of vatalanib on capillary formation from the fragments of rat aorta was also tested, and vatalanib inhibited capillary formation with an IC50 of 0.675±0.06 µM after 6 days [14], which is 5 times lower than IC50 in the present study (3.4±2.52 µM after 18 h). This may be due to the experimental method as well as species (rat vs. human). We suggest that cells or tissues from human samples would be better choice when performing assays for drug discovery. Furthermore, IC50 of vatalanib have shown to be changed according to the observation time points (Fig. 6C). The assay system to monitor time-dependent IC50 values from the same cells can be a useful tool for evaluating anti-angiogenic potency of drug candidates.
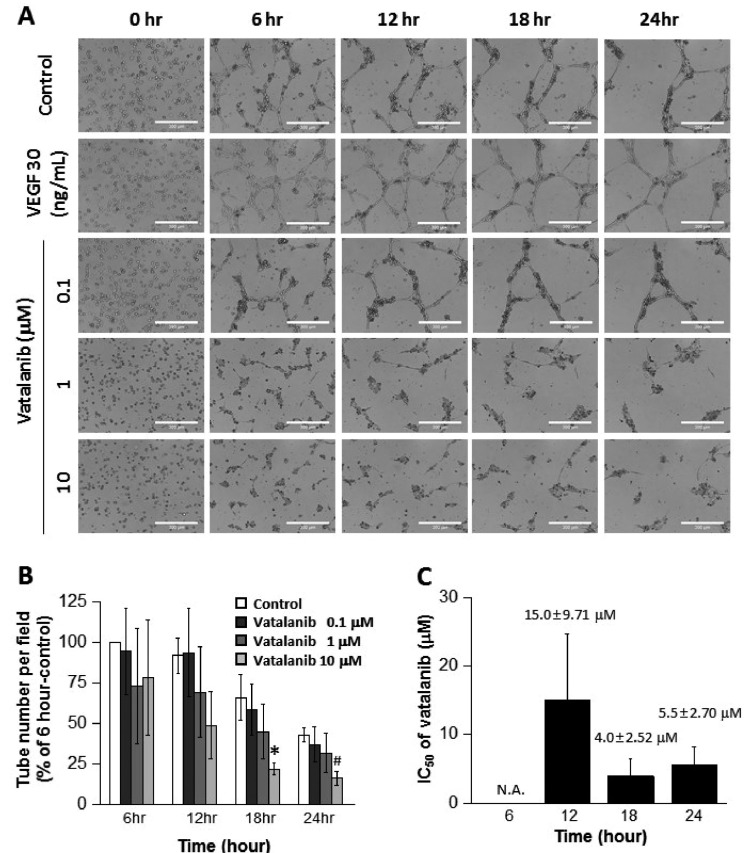 | Fig. 6Inhibitory effect of vatalanib on tube formation of ECFCs.(A) Representative images of the tubular structures formed by ECFCs over 24 h in the presence and absence of vatalanib (scale bar=300 µm). (B) Graph of the tube number over 24 h in the presence and absence of vatalanib. (C) Graph of IC50 of vatalanib by examining the inhibition of tube formation. N.A. means “not available.” The asterisk (*) indicates a significant difference (p≤0.05) compared to control. Sharp (#) indicates a notable difference (p≤0.06) compared to control (n=3).
|
Go to :
DISCUSSION
In the present study, we established an advanced in vitro tube formation assay system to evaluate pro- or anti-angiogenic agents. We first established the optimal conditions for tube formation assays using ECFCs, circulating adult endothelia precursors. Next, we improved the assay system by employing a real-time cell recorder to monitor time-dependent progression of tube formation from a single cell suspension over 48 h. We also applied image-stitching software to analyze a 25-fold larger area compared with a single image acquired using a 10× object lens. Finally, we verified the usefulness of our advanced assay system by treating ECFCs with the angiogenic stimulators, VEGF and FGF-2, and VEGF inhibitor, vatalanib. The diverse effect of VEGF and FGF-2 as well as VEGF+FGF-2 on tube formation were clearly observed using the new assay system. IC50 of vatalanib could be monitored time-dependently. These results suggest that our newly-established tube formation assay system using ECFCs can replicate the dynamic progression of tube formation from ECs in response to angiogenic modulators, thereby providing a sensitive and versatile assay model to evaluate potential pro- or anti-angiogenic drug candidates.
Blood vessels extend throughout the body to meet the demands of cells for their survival, namely delivering oxygen and nutrients and eliminating waste products. Abnormal angiogenic events are critical in a wide range of diseases affecting many millions of people worldwide; therefore, regulation of angiogenesis is a key target for pharmaceutical intervention [15]. Numerous pathological states, including tumor progression, diabetic retinopathy, rheumatoid arthritis, and psoriasis, involve excessive blood vessel formation. Conversely, in wound healing, myocardial infarction, and coronary artery disease, the aim of pharmaceutical intervention is to stimulate healthy neo-vessel formation. To successfully develop angiogenic modulators, in vitro experimental assays should mimic in vivo angiogenic events to provide more accurate results. The purpose of the present study was to improve the in vitro tube formation assay, which is a widely used assay system for studying angiogenesis.
First, we introduced ECFCs to tube formation assays. Most angiogenesis assays use mature ECs, which are normally isolated from human umbilical veins or dermal microvessels. These ECs initially grow well but tend to progressively lose their proliferative phenotype as well as their differentiation potential, which dampen their angiogenic response. This weakness can be overcome using ECFCs due to their robust proliferative capacity and defined angiogenic characteristics [3,16], which can minimize differences between donors as well as cell culture conditions. We determined the optimal conditions for tube formation assays with ECFCs, which were 15×104 cells/ml/well in Matrigel-coated 24-well plates with basal endothelial medium containing 2% FBS. We then confirmed the angiogenic response of ECFCs to VEGF, FGF-2, and combined treatment. VEGF induced rapid formation of tubular structures by 6 h then caused a dose-dependent regression. FGF-2 caused an increased tube formation at 6 h, and maintained tubular structures similar to the control group at the later time points. Combined treatment with VEGF and FGF-2 yielded higher tube formation over the entire observation period. It would be considered that anti-angiogenic potency should be analyzed in the presence of multiple angiogenesis factors to determine whether the test compound effectively inhibits physiological and/or pathophysiological angiogenesis.
Second, we utilized a real-time cell recorder to continuously track the tube formation process for 48 h. As shown in supplemental movie 1 and 2, tube formation from a single cell suspension changes dramatically over time. Time-lapse video images provide evidence of time-dependent dynamic changes in initiation, elongation, and degradation of tubular structures formed by ECFCs. Many previous reports showed the increase of tube formation with VEGF or FGF-2 treatment when observed one or two time points within 24 h. However, most of studies did not mention the time-dependent change of the tube number or length per tubes. Thus, continuous measurement of tube formation would be one of the advantages of this new assay system, which allows for in-depth evaluation of pro- and anti-angiogenic drug candidates.
Third, we obtained larger images to improve the accuracy and reproducibility of the results. Typically, the degree of tube formation is determined using microscope images taken with a 10× object lens. However, the image area from a 10× object lens is too small to correctly assess the distribution of tubular structures in the wells (as shown in Fig. 1). To overcome this limitation, 8–12 images per well are taken to get the average values of tube number and length per tube. However, this procedure is time-consuming, which can affect the cells in terms of temperature and CO2 concentration. It also introduces shaking stress to the cells, which can interfere with the formation and maintenance of tubular structures. Thus, we applied an image-stitching software to obtain larger images without these unintended stresses during the tube formation process. We acquired 4 side-by-side images using a 4× object lens then stitched the images together. As shown in Fig. 1, an image taken with a 4× object lens is 6.25-fold bigger than one from a 10× object lens. Moreover, the 2×2 stitched image area is 25-fold bigger than one image from a 10× object lens. This imagestitching process could minimize bias and increase the accuracy of the results through analyzing a larger image area.
Taken together, these results underline that the newly-established tube formation assay has been improved in three aspects, which leads to enhanced sensitivity for identifying pro- and antiangiogenic drug candidates. This advanced tube formation assay system may serve as an effective in vitro assay tool for future screening approaches focusing on the human angiogenesis process.
Go to :

 XML Download