

 PDF
PDF ePub
ePub Citation
 Print
Print


INTRODUCTION
Ischemia-reperfusion injury (IRI) is one of the main mechanisms of damage in native and transplanted kidneys [1]. IRI can cause variable cellular events that finally lead to necrosis and apoptosis of renal tubules [2]. Among several factors underlying IRI, inflammation is considered to play a key role in the pathogenesis of renal injury. The inflammatory reaction results in the production of multiple pro-inflammatory cytokines and chemokines such as tumor necrosis factor (TNF)-α, interleukin (IL)-1, and IL-6 that activate and recruit leukocytes [34]. There is substantial evidence that anti-inflammatory agents are effective in reducing renal injury after IRI [567].
Elements of the renin-angiotensin system are involved in the inflammatory process and play an important role in causing renal IRI [89]. Angiotensin II (Ang II), as the main peptide of the renin-angiotensin system, causes intrarenal vasoconstriction through an Ang II type 1 receptor (AT1). At the same time, Ang II mediates non-hemodynamic actions such as oxidative stress, inflammation, and apoptosis of renal tissue [1011]. Blockade of Ang II by using angiotensin converting enzyme inhibitors or AT1 blockers (ARBs) has protective effects after renal IRI [121314].
A newly developed ARB, fimasartan, exhibits potent and selective AT1 blocking activity [1516]. This drug is effective in lowering blood pressure with fast and long-acting efficacy [17181920]. Fimasartan reduces myocardial injury and stabilizes atherosclerotic plaques through its anti-inflammatory effect in animal studies [212223]. Here, we investigated the protective effects of pretreatment with fimasartan on IRI in a mouse model of ischemic renal injury.
Go to : 
METHODS
Animals
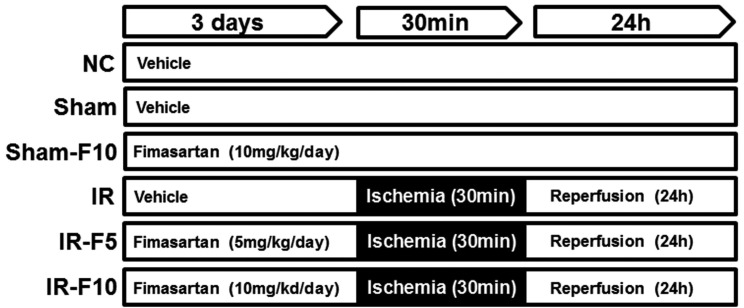
Eight-week-old male C57BL/6 mice weighing 22-25 g (Samtako, Osan, Korea) were used. The animals were housed with free access to standard chow and water, and were kept in a 12 h light/dark cycle. Mice were divided randomly into six groups: normal control (NC, n=5), sham operation (Sham, n=6), sham operation after 10 mg/kg/day of fimasartan (Sham-F10, n=6), ischemiareperfusion (IR, n=8), ischemia-reperfusion after 5 mg/kg/day of fimasartan (IR-F5, n=8), and ischemia-reperfusion after 10 mg/kg/day of fimasartan (IR-F10, n=8). The dosage of fimasartan was determined from the previous studies [2223]. Fimasartan potassium trihydrate (Boryung Pharmaceutical, Seoul, Korea) was dissolved in 0.9% normal saline. Animals were treated by oral gavage with a single daily dose of fimasartan (5 or 10 mg/kg/day) or 0.9% normal saline for 3 days before bilateral IRI (Fig. 1). All mice were sacrificed by cardiac puncture under anesthesia at 24 h after reperfusion. Blood and kidneys were harvested for the analyses. Animal experiments were performed in accordance with the guidelines approved by the Animal Care and Use Committee at the Kyungpook National University (KNU-2017-0013).
Induction of renal IRI
For the induction of ischemia, the renal pedicles were exposed through a minimal flank incision under anesthesia with tribromoethanol (240 mg/kg, 1.2%), and were occluded completely for 30 min using a micro aneurysm clamp. After 30 min of ischemia, the artery clamp was removed to allow reperfusion and the skin was closed. Sham-operated animals underwent identical surgical treatment except for clamping of the renal pedicles. During the operation, animals were maintained at 36.5–37℃ using a temperature-controlled heating device (Harvard Bioscience, Holliston, MA, USA).
Renal function and histopathological studies
Blood urea nitrogen (BUN) and creatinine (Cr) levels were evaluated in mouse serum by a Hitachi 7600 automated biochemistry analyzer (Hitachi, Tokyo, Japan). Kidney tissues from each experimental group were immersion-fixed with 4% paraformaldehyde (pH 7.4) and embedded in paraffin. Two-micrometer tissue sections were prepared and stained with periodic acid-Schiff (PAS) and Masson's trichrome using standard protocols to determine histological changes and collagen deposition, respectively.
Immunohistochemistry
Kidney tissues from each experimental group were prepared with the same method used for histologic studies. Immunohistochemical staining was performed using anti-TNF-α (1:100; Abcam, Cambridge, UK) and anti-F4/80 (1:200; Serotec, Oxford, UK) antibodies, and then detected by the EnVision-HRP kit (Dako, Carpinteria, CA, USA). All sections were counterstained with Mayer's hematoxylin and were examined under a Leica DM IRB inverted microscope (Leica Microsystems, Wetzlar, Germany) equipped with a CoolSNAP HQ camera (Photometrics, Tucson, AZ, USA). Quantitation of the TNF-α staining intensity was measured as a percentage of the total area using Image J software (National Institutes of Health, Bethesda, MD, USA). For quantification of F4/80-positve cells, five non-overlapping per slide at ×400 magnifications were counted and normalized per mm2 of tissue.
Quantification of serum IL-6
Serum IL-6 concentrations were measured using a commercially available enzyme-linked immunosorbent assay kit (R&D Systems, Minneapolis, MN, USA) according to the manufacturer's instructions. Values were calculated using a standard curve.
Quantitative real-time polymerase chain reaction (qRT-PCR)
Total RNA was extracted from kidney tissues using TRIzol reagent (Life Technologies, Carlsbad, CA, USA) according to the manufacturer's instructions. One microgram of total RNA was reverse transcribed to cDNA using the PrimeScript cDNA synthesis kit (TaKaRa, Otsu, Japan). qRT-PCR was performed on the ABI PRISM 7700 Sequence Detection System (Applied Biosystems, Foster City, CA, USA) using the SYBR Green PCR master mix (Life Technologies). The results were analyzed using the comparative Ct method for relative quantification of gene expression. All primers used in the qRT-PCR were designed using Primer Express V1.5 software (Applied Biosystems) and were as follows: Neutrophil gelatinase-associated lipocalin (NGAL) (forward 5′-GCC ACT CCA TCT TTC CTG TTG-3′ and reverse 5′-GGG AGT GCT GGC CAA ATA AG -3′); IL-1β (forward 5′-TCG TGC TGT CGG ACC CAT AT-3′ and reverse 5′-GGT TCTC CTT GTA CAA AGC TCA TG-3′); IL-6 (forward 5′-CCC ACC AAG AAC GAT AGT CAA TT-3′ and reverse 5′-CAC CAG CAT CAG TCC CAA GA-3′); transforming growth factor (TGF)-β(forward 5′-GGC TGT GGC CAT CAA GAA TT-3′ and reverse 5′-GCA GAG GGA AGA GTC AAA CAT GT-3′); TNF-α (forward 5′-GAC TAG CCA GGA GGG AGA ACA G-3′ and reverse 5′-CAG TGA GTG AAA GGG ACA GAA CCT-3′); and β-actin (forward 5′-ACC ACC ATG TAC CCA GGC ATT-3′ and reverse 5′-CCA CAC AGA GTA CTT GCG CTC A-3′).
Terminal deoxynucleotidyl transferase-mediated dUTP nick end labeling (TUNEL) assay
The TUNEL assay was performed using the In situ Cell Death Detection Fluorescein Kit (Roche, Mannheim, Germany) for fluorescence and the Click-iT™ TUNEL colorimetric IHC Detection Kit (Life Technologies, Carlsbad, CA, USA) for immunohistochemistry according to the manufacturer's protocol. Briefly, 2-µm kidney sections were deparaffinized, rehydrated, and permeabilized with proteinase K. For fluorescence staining of TUNEL assay, the sections were then incubated with the TUNEL reagent for 30 min at room temperature and washed with phosphate-buffered saline three times for 5 min. Sections were counterstained with 4′,6-diamidino-2-phenylindole (Sigma-Aldrich, St. Louis, MO, USA) for 1 min to detect the nucleus. Finally, the sections were mounted with Prolong Gold anti-fade reagent (Invitrogen, Carlsbad, CA, USA) and observed under a confocal microscope (Carl Zeiss, Göttingen, Germany). Images were collected and merged using Zeiss LSM Image Examiner software. For immunohistochemistry of TUNEL assay, after treatment with TdT (terminal deoxynucleotidyl transferase) reaction buffer for 10 min at 37℃, the TdT reaction mixture was added for 60 min at 37℃. Streptavidin-peroxidase conjugate solution was incubated for 30 min at room temperature. Then, the sections were washed and developed with 3, 3′-diaminobenzidine (DAB) reaction mixture to produce a brown color, and counterstained with Mayer's hematoxylin.
Measurement of caspase-3 activity
Caspase-3 activity in the kidney homogenates was measured using a colorimetric assay kit (Sigma-Aldrich) according to the manufacturer's protocol. In brief, kidney homogenates were incubated with the fluorometric caspase-3 substrate, Ac-DEVD-pNA, in assay buffer. To account for non-specific hydrolysis of the substrate, a control reaction mixture containing the caspase-3 inhibitor, acetyl-DEVD-CHO, in assay buffer was used. Both mixtures were incubated for 90 min at 37℃, and the absorbance was read at 405 nm.
Immunoblotting of Bcl-2 and Bax
Homogenized kidney tissue proteins were resolved by sodium dodecyl sulfate-polyacrylamide gel electrophoresis and transferred to a nitrocellulose membrane. The membrane was blocked for 1 h and incubated overnight at 4℃ with primary antibodies against Bcl-2 (1:1000; Cell Signaling Technology, Danvers, MA, USA), Bax (1:1000; Cell Signaling Technology), and β-actin (1:5000, Sigma-Aldrich). After washing, the membrane was incubated with horseradish peroxidase-conjugated secondary antibodies (1:2000; Dako, Glostup, Denmark) for 1 h and detected using ECL Advanced Detection (GE Healthcare, Little Chalfont, UK). The intensity of the bands was quantified using Scion Image software (Scion, Frederick, MD, USA).
Statistical analysis
Data are presented as means±standard error of the mean. Experiments were repeated at least three independent times. All statistical analyses were performed by one-way analysis of variance with Tukey's post hoc test using GraphPad prism 5.01 software (GraphPad Software, La Jolla, CA, USA). p<0.05 was considered statistically significant.
Go to :
RESULTS
Fimasartan attenuated the IRI-stimulated increase in serum BUN and Cr levels
To assess renal function after IRI, serum BUN and Cr levels were determined. The IR group showed significantly increased BUN and Cr levels compared to the control groups (NC, Sham, and Sham-F10). However, the IR-F10 group exhibited significantly attenuated levels of both BUN and Cr compared to the IR group. The increased level of NGAL, known as tubular injury marker, after IRI also significantly decreased in the IR-F10 group. The IR-F5 group showed a tendency to attenuate the increase of BUN, Cr, and NGAL after IRI (Fig. 2).
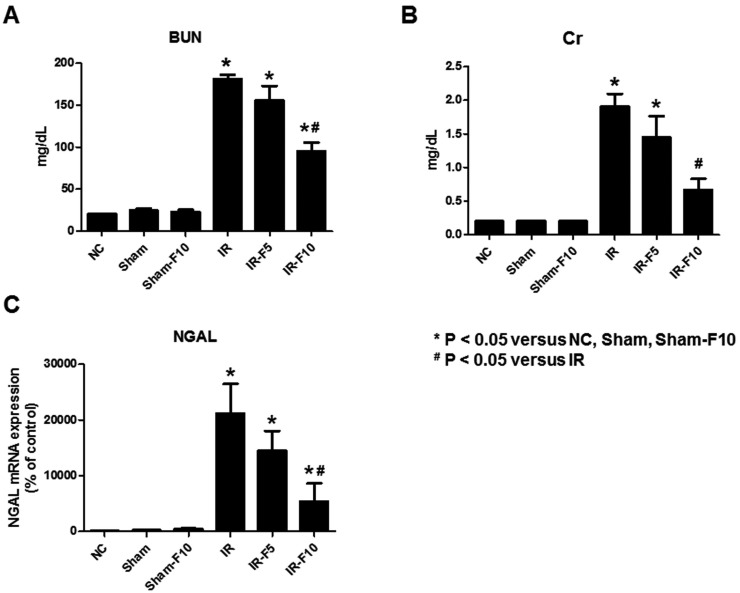 | Fig. 2Serum blood urea nitrogen (BUN), creatinine (Cr), and Neutrophil gelatinase-associated lipocalin (NGAL) levels in mice.Ischemia-reperfusion injury (IRI)-induces increases of (A) BUN, (B) Cr and (C) NGAL compared to control groups. Pretreatment with 10 mg/kg/day fimasartan attenuates the increase of BUN and Cr levels after IRI. The increased level of NGAL after IRI also significantly decreased after fimasartan treatment. Data are expressed as means±SEM (normal control, NC, n=5; sham operation, Sham, n=6; sham operation with 10 mg/kg/day fimasartan, Sham-F10, n=6; IR, n=8; IR with 5 mg/kg/day fimasartan, IR-F5, n=8; IR with 10 mg/kg/day fimasartan, IR-F10, n=8).
|
Fimasartan protected against IRI-induced renal injury
To investigate the histological changes in kidneys following pretreatment with fimasartan in the IRI model, PAS and Masson's trichrome staining were performed. PAS staining showed that NC and Sham mice, with or without fimasartan, did not exhibit tubular injury. Tubular damage, loss of the brush border, and cast formation was significantly increased in the IR compared to the NC, Sham, and Sham-F10 groups, whereas the damages were decreased in the fimasartan-treated groups (Figs. 3A–F). Decreased interstitial fibrosis following fimasartan treatment was confirmed by Masson trichrome staining. Specifically, the IR group exhibited an increased quantity of collagen deposition in the renal interstitium compared to the NC, Sham, and Sham-F10 groups (Figs. 3G–M).
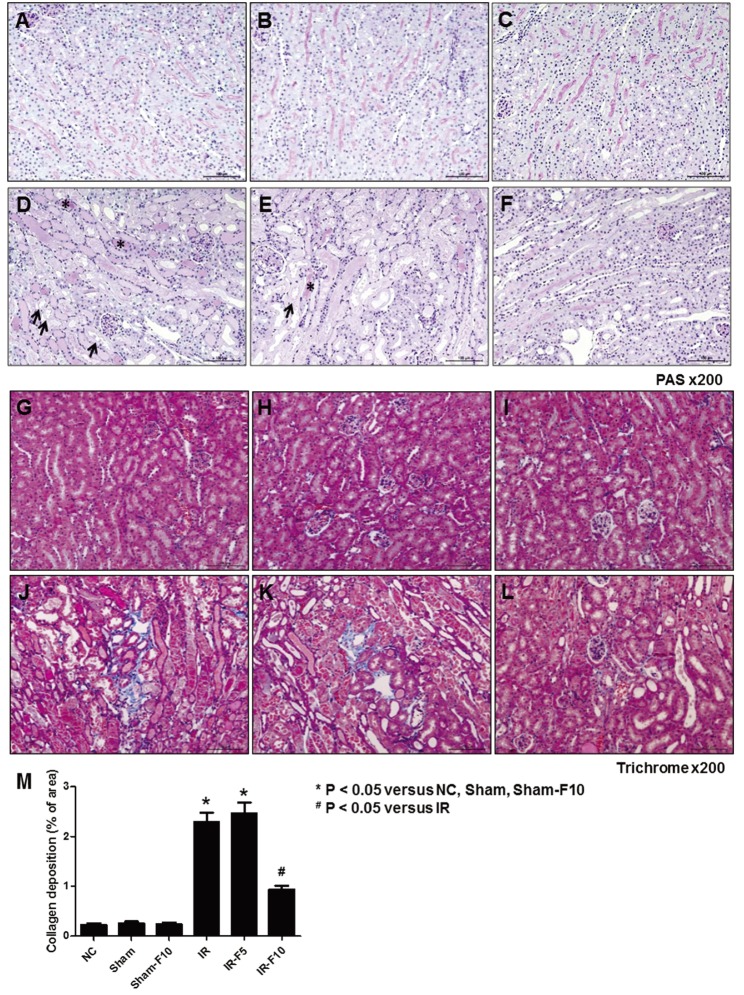 | Fig. 3Periodic acid-Schiff (PAS) and Masson's trichrome staining after ischemia-reperfusion injury (IRI).(A and G) Normal control (NC). (B and H) Sham operation (Sham). (C and I) Sham operation with 10 mg/kg/day fimasartan (Sham-F10). (D and J) IRI (IR). (E and K) IRI with 5 mg/kg/day fimasartan (IR-F5). (F and L) IRI with 10 mg/kg/day fimasartan (IR-F10). (M) Semi-quantitative assessment of the renal fibrosis area. Data are expressed as means±SEM. Tubular damage, loss of the brush border, and cast formation was significantly increased in the IR compared to the NC, Sham, and Sham-F10 groups, whereas the damages were decreased in the fimasartan-treated groups. Arrows indicate injured tubules and loss of brush border, and asterisks point to cast formation (NC, n=5; Sham, n=6; Sham-F10, n=6; IR, n=8; IR-F5, n=8; IR-F10, n=8).
|
Fimasartan attenuated the increased expression of pro-inflammatory cytokines following renal IRI
To investigate the inflammatory response after renal IRI, we evaluated the expression of F4/80 and TNF-α in kidney tissues using immunohistochemistry. F4/80, a macrophage infiltration marker (Figs. 4A–F), and TNF-α expression (Figs. 4G–L), were increased in the IR compared to the Sham and Sham-F10 groups. Treatment with fimasartan before IRI decreased the changes in labeling intensities of F4/80 and TNF-α (Figs. 4M and N).
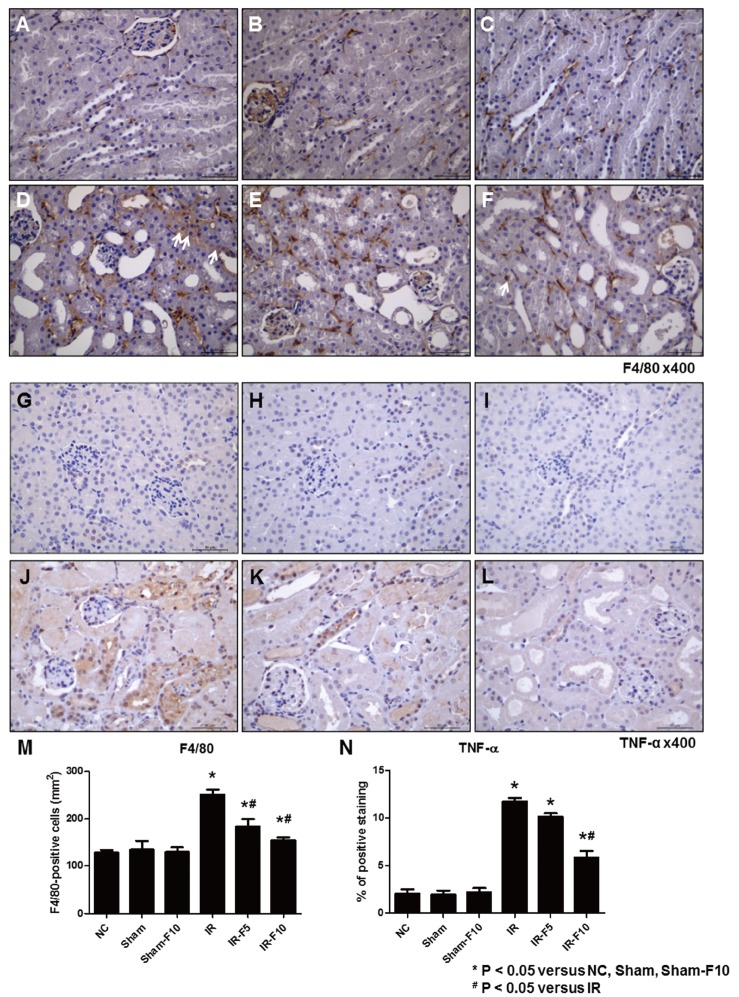 | Fig. 4Immunohistochemistry staining after ischemia-reperfusion injury (IRI).(A and G) Normal control (NC). (B and H) Sham operation (Sham). (C and I) Sham operation with 10 mg/kg/day fimasartan (Sham-F10). (D and J) IRI (IR). (E and K) IRI with 5 mg/kg/day fimasartan (IR-F5). (F and L) IRI with 10 mg/kg/day fimasartan (IR-F10). Immunohistochemistry shows increased labeling intensity of F4/80 and tumor necrosis factor (TNF)-α at the interstitial area after IRI (D and J) compared to NC (A and G), Sham (B and H), and Sham-F10 (C and I). Fimasartan treatment reverses the changes in labeling intensities of F4/80 and TNF-α in the IRI groups (F and L). (M and N) Semi-quantitative assessment of F4/80-positive cells and TNF-α-positive areas. Arrows indicate F4/80 positive cells. Data are expressed as means±SEM. (NC, n=5; Sham, n=6; Sham-F10, n=6; IR, n=8; IR with 5 mg/kg/day fimasartan, IR-F5, n=8; IR with 5 mg/kg/day fimasartan, IR-F10, n=8).
|
We assessed serum IL-6 levels using an enzyme-linked immunosorbent assay. The results showed that serum IL-6 was significantly increased after IRI compared to control groups, while pretreatment with fimasartan attenuated the IRI-induced change in IL-6 (Fig. 5). Investigating mRNA levels of the inflammatory cytokines TNF-α, IL-1β, IL-6, and TGF-β using qRT-PCR showed that they were dramatically increased by IR compared to the control groups. Treatment with fimasartan before IRI diminished these increases (Fig. 6).
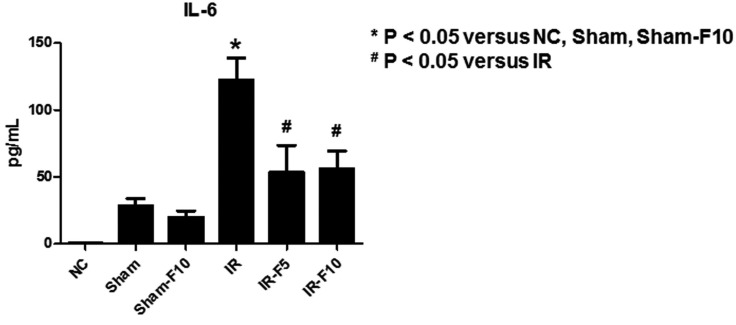 | Fig. 5Enzyme-linked immunosorbent assay results of serum interleukin (IL)-6 levels.IL-6 is significantly increased after renal ischemia-reperfusion injury (IRI) compared to the control groups. Pretreatment with fimasartan (5 mg/kg/day, IR-F5; 10 mg/kg/day, IR-F10) before IRI attenuates the change in IL-6. Data are expressed as means±SEM (normal control. NC, n=5; sham operation, Sham, n=6; sham operation with 10 mg/kg/day fimasartan, Sham-F10, n=6; IR, n=8; IR-F5, n=8; IR-F10, n=8).
|
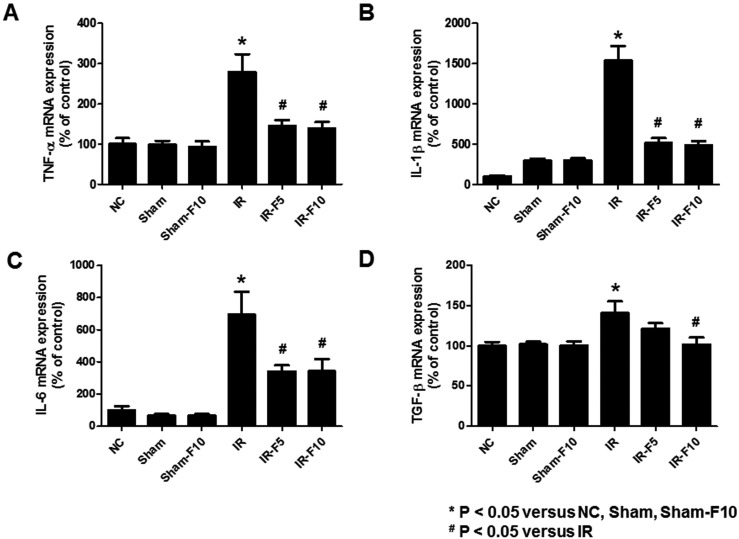 | Fig. 6mRNA levels of tumor necrosis factor (TNF)-α, interleukin (IL)-1β, IL-6, and transforming growth factor (TGF)-β in mouse kidney tissue.Quantitative real-time polymerase chain reaction analyses revealed significant increases in the expression of (A) TNF-α, (B) IL-1β, (C) IL-6, and (D) TGF-β mRNA in the ischemia-reperfusion (IR) compared to control groups. Fimasartan treatment (5 mg/kg/day, IR-F5; 10 mg/kg/day, IR-F10) significantly inhibits the upregulation of TNF-α, IL-1β, IL-6, and TGF-β levels compared to the IR group. Data are expressed as means±SEM (normal control, NC, n=5; sham operation, Sham, n=6; sham operation with 10 mg/kg/day fimasartan, Sham-F10, n=6; IR, n=8; IR-F5, n=8; IR-F10, n=8).
|
Fimasartan attenuated apoptosis in renal IRI
To confirm the effect of fimasartan on apoptosis, we investigated the level of apoptotic cell death in the Sham and IR groups, with and without fimasartan pretreatment, using the TUNEL assay (Figs. 7 and 8). The IR group exhibited more TUNEL-positive renal tubular epithelial cells than the Sham group. Fimasartan pretreatment (IR-F5 and IR-F10 groups) attenuated the IR-induced increase of apoptosis in tubule cells.
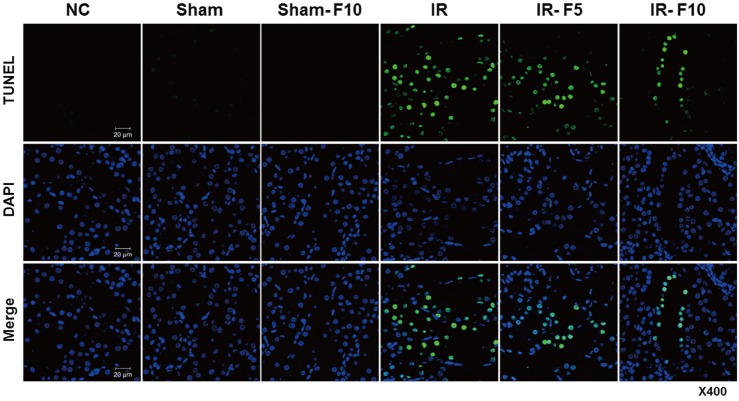 | Fig. 7Apoptosis of renal tubular epithelial cells.The TUNEL assay reveals that apoptosis induced in the ischemia-reperfusion (IR) group is significantly increased compared to that in the control groups. Apoptosis of renal tubule cells is decreased in the fimasartan-pretreated groups (5 mg/kg/day, IR-F5; 10 mg/kg/day, IR-F10) compared to the IR group.
|
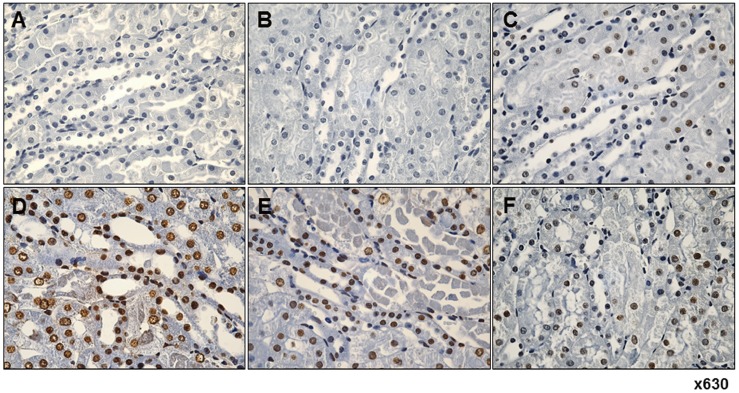 | Fig. 8Immunohistochemistry reveals fimasartan pretreatment suppresses ischemia-reperfusion injury (IRI)-induced apoptosis in tubular epithelial cells.(A) Normal control. (B) Sham operation. (C) Sham operation with 10 mg/kg/day fimasartan. (D) IRI. (E) IRI with 5 mg/kg/day fimasartan. (F) IRI with 10 mg/kg/day fimasartan. IR significantly increased the number of apoptotic cells compared with that in the sham group, which was significantly reduced by fimasartan. Arrows indicate TUNEL-positive cells in renal tubule.
|
The activity of caspase-3 in renal homogenates was measured (Fig. 9A). Caspase-3 activity was dramatically increased in the IR compared to control groups, while fimasartan-treatment diminished the increase of caspase-3 activity.
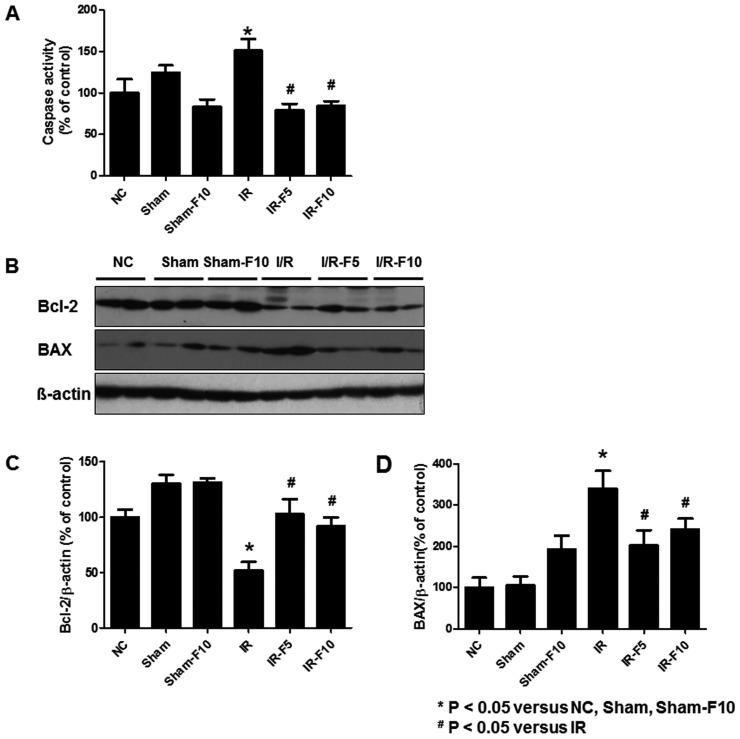 | Fig. 9Activity of caspase-3, and expression of Bcl-2 and Bax in renal tubular cells following ischemia-reperfusion injury (IRI).(A) Caspase-3 activity is significantly increased in the IR compared to the normal control (NC), sham operation (Sham), and sham operation with 10 mg/kg/day fimasartan (Sham-F10) groups. Fimasartan-treatment after IR (5 mg/kg/day fimasartan, IR-F5, and 10 mg/kg/day fimasartan, IR-F10) diminishes the increases of caspase-3. (B) Immunoblotting shows significantly decreased Bcl-2 and increased Bax levels in IR compared to NC, Sham, and Sham-F10. Quantitation of (C) Bcl-2 and (D) Bax levels. Pretreatment with fimasartan reverses the changes in Bcl-2 and Bax expression. Data are expressed as means±SEM.
|
Two important proteins associated with apoptosis, Bcl-2 and Bax, were analyzed by western blotting. In the IR group, Bcl-2 expression was decreased while Bax expression was increased, compared to the control groups. These results were attenuated by pretreatment with fimasartan (Figs. 9B–D).
Go to :
DISCUSSION
The present study demonstrated that fimasartan attenuated renal IRI injury in a mouse model. Treatment with fimasartan improved serum BUN and Cr levels compared to the untreated group. Kidneys from IR mice treated with fimasartan showed less tubular necrosis and interstitial fibrosis than untreated mice. High-dose fimasartan also attenuated the IR-induced upregulation of inflammatory cytokines and decreased apoptosis of tubular cells. These results suggest that the renoprotective effects of fimasartan are mediated by modulating inflammation-related apoptosis. This is the first study to investigate the protective effect of fimasartan on kidneys with IRI, making it a candidate for treating patients with acute renal ischemic injury.
Kim et al showed that nuclear factor erythroid 2-related factor 2 (Nrf2), antioxidant genes known to regulate cellular oxidative stress, was related with fimasartan-mediated antioxidant effects in unilateral ureteral obstruction mouse model [24]. However, whether fimasartan could modulate tubular injury, especially after IR, was not known. Our results indicate that a renal ischemic insult contributes to upregulation of TNF-α, IL-1β, and IL-6 mRNA. An increased level of TNF-α is associated with deterioration of renal blood flow and the glomerular filtration rate by enhancing various vasoactive mediators [25]. TNF-α is also a major cytokine that recruits macrophages, thereby initiating tissue inflammation [2627]. IL-1β and IL-6 also contribute to inflammation and tissue injury, which leads to cellular dysfunction and apoptosis [2829]. Because Ang II increases the generation of reactive oxygen species and pro-inflammatory mediators, particularly TNF-α [3031], and blocking Ang II downregulates many pro-inflammatory cytokines [13], we investigated the effect of fimasartan on the pro-inflammatory pathway in IRI. The protective effects of fimasartan were seen by its ability to inhibit the upregulation of pro-inflammatory cytokines and decrease tubular cell apoptosis. This suggests that fimasartan could be responsible for the improvement in tissue damage by modulating inflammation-related IRI injury.
Pro-inflammatory cytokines such as TNF-α and oxygen-derived free radicals are well-known inducers of apoptosis by activating the caspase family of proteases [32]. The sequential cleavage of procaspases activates caspase-3, which degrades other intracellular proteins, leading to cell death [33]. Therefore, caspase inhibition has remarkable effects on renal injury by preventing apoptosis after renal ischemia [3435]. We investigated the effect of fimasartan on apoptosis by determining caspase-3 activity and using the TUNEL assay in a mouse model of kidney IRI. Caspase-3 activity was significantly increased in the IRI group compared with control, whereas fimasartan treatment before IRI significantly decreased caspase-3 activity compared with the IRI group. Increased caspase-3 activity was associated with TUNEL-positive renal tubular epithelial cells, suggesting renal tubular cell apoptosis after IR. This is in agreement with a previous study with caspase-inhibiting drugs where fimasartan prevented the activation of renal caspase-3 and thus inhibited subsequent renal tubular cell apoptosis [363738].
We also investigated the possible mechanisms by which fimasartan prevented apoptosis. Among several apoptosis-regulating genes, BCL-2 family genes play a pivotal role in preserving mitochondrial integrity, suppressing tubular cell apoptosis, and ameliorating renal dysfunction [33]. Expression of Bcl-2 and Bax proteins, that interact as anti- and pro-apoptotic BCL-2 members, has a direct effect on renal tubular cells at the mitochondrial level [3739]. Our results suggest that the cytoprotective effects of fimasartan are mediated via the downregulation of caspase-3 activity and Bax expression, and the upregulation of Bcl-2.
Although many ARBs show renoprotective effects to IRI, and the suppression of apoptosis by fimasartan may be achieved by blocking the AT1 receptor, the underlying mechanisms whereby they reduce IRI differ and are controversial because of the pleiotropic effects of individual ARBs. Previous studies with ARBs suggested that mitochondrial dysfunction was prevented by reducing myeloperoxidase activity, homocysteine accumulation, or oxygen consumption [131440]. Our study demonstrated that pretreatment with fimasartan modulated the Bax/Bcl-2 balance during IRI. This might stabilize mitochondrial membrane permeability and mitigate cell death [41], and can be considered as another possible mechanism for the protective effect of ARB classes against renal tubular apoptosis.
It is difficult to ascertain whether modulation of the TNF-α-related inflammatory pathway is the sole mechanism underlying the ability of fimasartan to reduce renal injury. Fibrosis following an ischemic insult is a common pathologic feature of IRI and is related to various fibrosis-mediating cytokines including TGF-β1 [4243]. We showed that fimasartan attenuated the progression of renal fibrosis after IRI. In addition, TGF-β1 mRNA was upregulated after IRI and downregulated by fimasartan treatment. Although we did not evaluate other fibrogenic mediators such as α-smooth muscle actin or collagen in the present study, it is essential to investigate the cross talk between the anti-inflammatory and anti-fibrotic effects of fimasartan.
The renoprotective effect of AT1 blockade is strongly dose-dependent and independent of its effect on systemic arterial pressure [4445]. Although a lower dose of fimasartan decreased expression of some pro-inflammatory cytokines such as IL-1β and IL-6, the low dose fimasartan group did not show functional or histological differences compared to the non-treated group. This discrepancy in our study might be explained by a dose-dependent response to intrarenal acute inflammation, or availability of the drug in the kidney that would be necessary to counteract IRI more effectively.
In conclusion, fimasartan treatment preserved renal function and tubular architecture following reperfusion in a mouse model of ischemic renal injury. Renoprotection at the high dose of fimasartan was mainly mediated by its anti-inflammatory effects. Our results indicate that fimasartan inhibited the process of tubular injury through the prevention of apoptosis induced by the inflammatory pathway.
Go to :
 XML Download