

 PDF
PDF ePub
ePub Citation
 Print
Print


INTRODUCTION
Ischemic penumbra (IP) is defined as non-functional but living brain tissue at risk of infarct following large vessel occlusion (1). This critical area of the ischemic zone, as opposed to the dead infarct core (IC), has long been the therapeutic target since the early trials with intravenous thrombolytic therapies (23). It remains controversial whether imaging-defined IP should also include benign oligemia-which is hypoperfused, functionally normal, and not at risk of infarct-as the target of intervention (4). In the era of intra-arterial thrombectomy with a longer therapeutic time window, the need for improved discrimination of oligemia from true “at-risk” penumbra (TP) by non-invasive imaging methods has increased as the outcome of clinical stroke trials can be quantitatively measured (5).
With non-invasive magnetic resonance imaging (MRI), IP can be assessed by the mismatch between the diffusion-weighted imaging hyperintensity (IC) and the perfusion-weighted imaging (PWI) deficit (reduced cerebral blood flow) (6). While this method is clinically practical, there are inherent conceptual and technical flaws in perfusion measures (7). First, perfusion imaging does not reflect metabolic states of IP, which evolve dynamically. Second, the technical assumption for perfusion imaging, particularly deconvolution-based approaches, requires correct arterial input function and flows, without significant delay or dispersion. Furthermore, perfusion measures such as mean transit time and time to peak have not been standardized, and can easily be affected by delayed collaterals and flow dispersion. Therefore, rather than pursuing a mismatch concept, a direct measurement of microstructure injury of the brain to differentiate ischemic tissue such as IC, penumbra at risk, and benign oligemia is desirable.
Diffusion tensor imaging (DTI) is a relatively new technique for non-invasive delineation of cerebral micro-structural changes. It measures tensor metrics, including eigenvalue magnitudes and anisotropy (8). Recent investigations have shown the feasibility of DTI in assessing the microstructure of the ischemic brain tissue (910). DTI metrics, such as fractional anisotropy (FA), can be employed as surrogate markers in studying cell membrane integrity over time after injuries (7). Furthermore, a recent study reported the utility of DTI in determining the onset time of ischemic stroke by hours in a rat model with hyperoxygenation treatment (11). The purpose of this study was to investigate diffusion tensor (DT)-derived properties of benign oligemia, TP, and the IC during the first 3 hours of stroke onset under room air.
MATERIALS AND METHODS
Animal Preparations
This study was approved by the local institutional animal care and use committee. Fourteen male Sprague-Dawley rats (weight, 270–350 g; Taipei Medical University Animal Center, Taiwan) were used in this study. They were housed in a humidity- and temperature-controlled environment and placed under a 12:12-hour light:dark cycle, with free access to sterile food and water. All rats underwent permanent left middle cerebral artery occlusion (pMCAO) via an intra-luminal suture method based on the modified Zea Longa approach.
MRI
All animal imaging sessions were performed using a 7T scanner (PharmaScan 70/16; Bruker Biospin, Ettlingen, Germany). The rats were maintained under anesthesia using 1.5–2% isoflurane and kept under regular room air during image acquisition. Rectal temperature was maintained at 37℃ using a warm water bath with continuous circulation through a water-bath temperature controller set outside the magnet. DTI was performed with six non-collinear diffusion-encoding gradients with a b factor of 1200 s/mm2 plus one b = 0 s/mm2. Multi-shot echo-planar imaging (repetition time [TR] = 3000 ms, echo time [TE] = 37 ms, number of excitations = 6) with navigator-echo correction technique was used as the signal readout module. The longitudinal evolutions of DTI metrics of the rat brain were obtained by performing six sequential DTI scans for every rat, with the first scan performed at 30 minutes post-pMCAO, and then every 30 minutes up to 3 hours. PWI was performed at 30 minutes post-pMCAO using a dynamic susceptibility contrast (DSC) technique. A series of gradient-echo echo-planar, coronal images with TR/TE of 1000/20 ms and 300 repetitions were acquired. A bolus of the susceptibility contrast agent gadolinium-diethylenetriamine penta-acetic acid (0.25 mmol/kg; Magnevist, Bayer Schering Pharma, Berlin, Germany) was injected manually via the rat tail vein about 30 seconds after the start of image acquisition. The perfusion deficits were measured only once to calculate the perfusion/diffusion mismatch at 30 minutes and at the five follow-up time points. All image matrices were zero-filled to 128 × 128 for further analyses.
Data Analysis
Calculation of Relative Cerebral Blood Flow (rCBF) and DTI Metrics
The rCBF and DTI metrics were calculated and compared with those of the contralateral normal brain using in-house algorithms in MATLAB (MathWorks, Natick, MA, USA). For rCBF, the concentration-time curves were first obtained from signal-time curves of DSC perfusion imaging, with the recirculation effect being minimized via gamma-variate fitting (1213). The relative cerebral blood volume (rCBV) and relative mean transit time (rMTT) were then determined by the integral and the normalized first moment of the gamma variate fitting, respectively, as follows (1415)
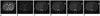
where ΔR2 is the change in transverse relaxation rate and t is the time after bolus arrival. Using the central volume principle, rCBF is derived as the quotient of CBV divided by MTT (16). For DTI metrics, the eigenvalues (λ1, λ2, λ3) of each image voxel were computed, and then applied to derive the mean diffusivity (MD), FA, pure anisotropy (q), diffusion magnitude (L), axial diffusivity (AD), and radial diffusivity (RD) (1017181920) (Fig. 1). The equations are illustrated as follows:


Delineation of TP, IC, and Oligemia
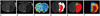
Infarct core was defined as a hypodense area in the apparent diffusion coefficient (ADC) map at 30 minutes post-pMCAO (Fig. 2A) while IC3h was the same growing hypodense area at 3 hours (Fig. 2B). Perfusion deficit was first defined at 30 minutes post-pMCAO (Fig. 2C). Regions ipsilateral to pMCAO with reduction in rCBF below 63% of the contralateral homologous brain were considered as CBF deficits (21). The rCBF map was then co-registered to the ADC maps of each follow-up time point to delineate the perfusion-diffusion mismatch, with the threshold of abnormal ADC change set at 70% of the normal contralateral cerebral hemisphere (1922). Based on the results, IC was defined as regions showing rCBF values < 63% and ADC < 70%, while TP and oligemic tissues were delineated together as regions showing rCBF values < 63% and ADC > 70% (Fig. 2D). Regions without CBF deficit within the ipsilateral brain were defined as normal tissue (NT). To differentiate benign oligemia from TP, we compared the initial extent of CBF deficit at 30 minutes post-pMCAO (CBF0.5h) with the region of IC at 3 hours (IC3h) (Fig. 2E), which was previously shown to be equivalent to the final infarct area at 24 hours post-pMCAO (23) (Fig. 2D). Based on the notion that TP will irreversibly progress to IC in the absence of timely reperfusion while oligemic tissue will not, the region of oligemia was hence extracted by excluding the region of IC3h from that of CBF0.5h after image co-registration, i.e., CBF0.5h–IC3h mismatch (Fig. 2F). This method was repeated at each following time point to obtain the respective regions of IC, TP, and oligemic tissue in all rats. Finally, once the regions of interest (ROIs) of TP, IC, NT, and oligemia were depicted by the mismatches, the relative DTI metrics, including relative MD (rMD), rAD, rRD, rFA, rL, and rq values, were derived and expressed as percentages of the corresponding values in the homologous contralateral brain as follows: rX = (Xipsilateral − Xcontralateral) / Xcontralateral, where X indicates the value of the particular index. In addition, all ROIs were transposed onto DT maps at each time point for testing regional differences and time-courses analyses.
Statistical Analysis
Statistical tests were performed using SPSS® for Windows software (Version 18.0; SPSS Inc., Chicago, IL, USA) to determine whether the pMCAO DTI metrics can be used to discriminate TP from IC, oligemia, and NT, regardless of the time effect. ANOVA with post hoc analysis was employed to evaluate whether the means of DTI metrics were significantly different between the TP, IC, oligemia, and NT regions at each imaging time point. Receiver operating characteristic (ROC) curve analyses were performed to determine the discriminative capability of the diffusion metrics to differentiate NT, oligemia, TP, and IC at each time point. A p value < 0.05 was considered statistically significant.
RESULTS
Temporal Evolutions of DTI Metrics among Tissue Types
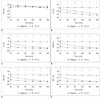
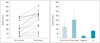
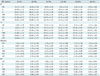
Figure 1 illustrates the maps of DTI metrics at 30 minutes post-pMCAO. The q, L, MD, AD, and RD maps demonstrate initial hypointensity changes in the ischemic areas while the FA map exhibits symmetrical signal intensity. Figure 3 shows the temporal evolutions of DTI metrics in IC, TP, and oligemia from 30 minutes post pMCAO to 3 hours. All the metrics among different tissue types showed a trend of decline with time, with the exception of rFA, which displayed a paradoxical 10% increase in IC and TP in the first 60 minutes, followed by a subtle steady decrease to close to zero (i.e., nearly identical to the contralateral normal tissue [NT]). The rL and rq that compose the rFA exhibited reductions in both TP and IC during the period of pMCAO (Fig. 3A–C, Table 1). The rq showed changes from −6.94% at 30 minutes to −36.98% at 3 hours in TP, and from −24.08% at 30 minutes to −45.35% at 3 hours in IC (Table 1). The rL showed a relatively larger reduction as compared to rq in both TP and IC within 3 hours (Table 1). rMD in TP0.5–3.0h showed a monotonic decrease from a reduction of −11.88% at 30 minutes to −41.37% at 3 hours (Table 1), while in IC0.5–3.0h, rMD had a reduction of 33.97% at 30 minutes and remained steady (Fig. 3D, Table 1). The evolutions of rq, rAD, and rRD (Fig. 3E, F) followed the profile of rMD. Significant differences (p < 0.05) in all DTI metrics except rFA were found between TP and oligemia, and between TP and IC before 2.5 hours (Fig. 3). The rFA showed significant differences between TP and oligemia at 60 minutes (p = 0.016) and 90 minutes (p = 0.010). All DTI metrics for oligemia and NT remained steady with no significant difference across different time points (NT not shown in Fig. 3).
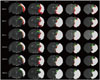
Topographic Distributions of the IC, TP, and Oligemia as Ischemia Progressed in the First 3 Hours
Figure 4 shows the representative topographic maps of the IC, TP, and oligemia in each slice at different time points. Both oligemia and TP are small in areas at the margin of a larger IC. Oligemia was smaller than TP and located at the outermost margin of TP. As time evolved, TP showed a progressive decrease in volume within the first 2.5 hours and ultimately progressed to IC at 3 hours. Infarct volumes of all rats (n = 14) at the 30-minute and 3-hour time points are plotted in Figure 5 shows the mean volumes of IC0.5h (123.0 ± 85.2 mm3), IC3.0h (204.3 ± 104.2 mm3), oligemia (24.7 ± 14.1 mm3), and TP (81.3 ± 62.6 mm3).
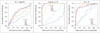
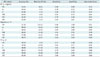
Discrimination of TP from Oligemia, IC, and NT by DTI Metrics
Significant differences (p < 0.05) in rq, rL, rMD, rAD, and rRD values were found between tissue subtypes at time points before 150 minutes (Fig. 3). ROC analysis for discriminating between oligemia and TP, as well as between TP and IC, showed good performance for all metrics, except rFA. Representative ROC curves and the best cutoff values for discriminating tissue subtypes at 90 minutes post-pMCAO are shown in Figure 6 and Table 2, respectively (see Appendix for ROC curves at 30, 60, and 90 minutes; Supplementary Tables 1, 2, 3, Supplementary Figs. 1, 2, 3 in the online-only Data Supplement), and show that all metrics except rFA had excellent performance in discriminating TP from IC, as well as in discriminating TP from oligemia (average accuracy > 90%). The rq had the best overall performance in discriminating TP from IC (accuracy = 92.6%, area under curve = 0.93) and the optimal cutoff value was −33.90% (Table 2). For discrimination of TP from oligemia, the rL, rMD, rAD, and rRD values all exhibited accuracies larger than 97.8%. Oligemia and NT were indiscriminative at all time points.
DISCUSSION
In this study, we characterized the temporal evolution of DTI metrics within different brain tissue subtypes, such as IC, TP, oligemia, and NT during the first 3 hours after pMCAO. Our findings were three-fold: First, the volume of oligemia was small. Its tensor properties were similar to those of normal brain tissue, and completely different from those of TP and IC. Second, rFA, the most frequently investigated DTI parameter, exhibited a paradoxical increase in TP and IC during the first hour post-pMCAO, and did not appear to be useful in discriminating ischemic tissue subtypes. Third, the evolution of DTI metrics such as rL, rq, rMD, rAD, and rRD in TP was distinct from that in IC and oligemia until 2.5 hours post-pMCAO. After 2.5 hours, the features became insignificant as the TP progressed to IC. These findings are in line with those of a previous study that used a histology-validated stroke model (23).
Kuo et al. (11) used DTI metrics to characterize IP in a normobaric hyperoxygenation stroke model up to 6.5 hours post-pMCAO. The prolonged IP was successfully differentiated from that of IC by the selected tensor metrics. In our study, not only was the utility of DTI metrics in delineating IP validated, but DTI was also shown to further discriminate IP into benign oligemia and TP, thus allowing for full visualization and assessment of the four tissue subtypes, which is in alignment with the “four tissue compartments concept” proposed by Lee et al. (24). Our current study was performed in regular room air instead of normobaric hyperoxia, and thus allowed us to assess the natural time course of penumbra development without manual intervention in temporal dynamics. Additionally, we adopted the infarct volume at 3 hours post-pMCAO as the cut-off point to define the final infarct volume. This design was based on an earlier animal study by Meng et al. (23), which demonstrated that the infarct volume at 3 hours post-stroke was highly correlated with that at 24 hours through histological validation. Thus, we were able to investigate the evolution of benign oligemia and true at-risk penumbra using DTI metrics every 30 minutes, for 6 time points, within the first 3 hours after pMCAO.
Among the various DT parameters, FA has been examined extensively in both human stroke studies and animal models as a potential imaging biomarker (89111725262728293031323334353637383940). However, the evolution of FA during hyperacute stroke has not yielded consistent results, with studies reporting both increases and decreases in FA during the initial hours, as well as findings showing no significant changes at all (16252627282930313233). Nevertheless, our results are in agreement with those of a recent study by Kuo et al. (11) in that rFA was paradoxically elevated in IC during the first hour post-pMCAO, regardless of its cortical or subcortical involvement. As rFA is proportional to the ratio of rq to rL, the increase in rFA was due to a larger reduction in rL value relative to a smaller reduction in rq. During the first 60 minutes post-pMCAO, a larger reduction in rL values (from −33.21% to −38.45%) relative to a smaller reduction in rq (from −24.08% to −30.46%) was observed in the IC (Table 1), resulting in an approximate 10% increase in rFA. After 60 minutes, the reduction of rq became greater with time than rL, leading to a slight decrease below the baseline in rFA at 3 hours. The subsequent progressive decline in rFA at 3 hours post-pMCAO was also observed previously in animal studies (30). Intriguingly, this overall trend may also be observed in TP but not in oligemia, which resembles its NT counterpart. Finally, based on our ROC analyses, the discriminative power of FA in separating TP from IC and benign oligemia was poor overall, unlike the other DTI metrics studied which showed high accuracy in the differentiation of tissue subtypes.
Pathophysiologically, ischemic stroke is a complex neuronal condition that involves transmembrane ionic disequilibrium, oxidative stress, axonal disruption, and neuronal swelling, ultimately leading to irreversible neuronal damage and cell death (34). In particular, intracellular glucose and oxygen deprivation because of Na+/K+ ATPase ion pump dysfunction may induce osmotic shift, thus causing cytotoxic edema and neurite beading-processes that can be detected and quantitatively measured via DTI (253536). Previous studies have shown that DTI metrics can reflect regional differences in pathophysiologic response towards neuronal ischemia during hyperacute stroke (11). For example, elevations of FA within the region of IC in both grey and white matter have been considered early indicators of ischemic microstructural injury during hyperacute stroke, including axonal damage, disruption of membrane permeability, myelin fiber swelling, and cytotoxic edema with increased tortuosity of the axoplasmic environment (1328373839). The subsequent reductions in FA during acute and subacute stages have been found to be linked to progressive loss of neuronal integrity (39). While the current study demonstrated an initial 10% increase in FA within the IC and TP, this was actually a result of anisotropy/magnitude ratio dependence (40). In our analysis, q and L appear independently to be more informative than FA in characterizing tissue diffusion changes in hyperacute stroke (11). As to the other DT metrics, the monotonic decreases in MD, AD, and RD in TP were similar to those of q and L, indicative of continuous degradation of cell membrane integrity, leading to loss of directional diffusivity. Conversely, as benign oligemia is characterized by regional neuronal metabolic and electrical disruption in the absence of significant neuron damage, the presentation of relatively stable DTI metrics, coupled with decreased CBF and sustained ADC value, likely reflects protective compensatory neurovascular autoregulation that helps maintain ionic homeostasis while ameliorating the development of cytotoxic edema (41424344).
There are several limitations in our study. First, our methodology for delineating the region of oligemia in the rat stroke model was based on a modified perfusion-diffusion mismatch approach that has inherent limitations due to the deconvolution model employed, thus potentially leading to over-estimation of the size of IP and oligemia. However, CBF values obtained from perfusion MRI have previously demonstrated excellent correlation with those generated from quantitative positron-emission tomography (PET) in terms of penumbra detection in stroke studies (45). Thus, MR-derived perfusion parameters remain valuable in assessing tissue perfusion. Future studies that involve penumbra or oligemia assessment should ideally incorporate quantitative metabolic measures that reflect true underlying metabolic condition, preferably with PET imaging (21). Second, the regions of oligemia we obtained were relatively small as compared to the regions of TP and IC (Fig. 5); therefore, the limited image pixels may lead to increased vulnerability in terms of metric calculation and accuracy of analyses. Third, the correlation between microstructural injury and DTI metric alternations is still unknown. Therefore, region-wise histopathological correlation may be a desirable next step to provide further proof of the value of DTI as a useful imaging biomarker for stroke studies.
In conclusion, our results suggest that DTI holds promise in discriminating oligemia from TP and IC in the first 3 hours of stroke through direct assessment of the microstructural changes over time. Oligemia is small in size in hyperacute stroke, and thus, it could be of minimal concern when stroke trials require quantitative measurements of IP.
 XML Download