

 PDF
PDF ePub
ePub Citation
 Print
Print


INTRODUCTION
Computed tomography urography (CTU) is one of the primary diagnostic techniques for evaluating patients with flank pain and hematuria (1). However, a major drawback of CTU is that the radiation dose is high owing to its multi-phasic imaging protocol, including precontrast, corticomedullary, and excretory phases (12). Thus, investigators have evaluated different protocols that could potentially reduce the radiation dose without compromising diagnostic performance, such as low-tube-voltage protocols with or without the use of iterative reconstruction (IR) algorithms and reduced scan phases with split-bolus contrast injection (345).
Reducing tube voltage is a popular method for decreasing radiation exposure (6). Recent advances in IR techniques have been shown to overcome image degradation due to low-tube-voltage (789). The benefits of lowering tube voltage include the possibility of reducing the iodine load (1011). This is because, at a low-tube-voltage close to the K-edge of iodine (33.2 keV), similar enhancement can be acquired by using less contrast medium since iodine attenuation is increased. Moreover, reducing the iodine concentration and total iodine load might help prevent contrast-induced nephropathy (CIN). This is because the risk factors of CIN include high osmolality and high volume of iodinated contrast medium (1213).
A previous randomized controlled study demonstrated that modified CTU performed with a combination of low-tube-voltage (80 kVp), a low-iodine-concentration-contrast-medium (240 mgI/mL), and an IR algorithm was not inferior to conventional CTU in terms of diagnostic acceptability (14). However, it is uncertain whether these results are generalizable, as this previous study was performed at a single institution using a CT scanner from a single vendor in a small number of patients (n = 63).
Therefore, we aimed to compare the image quality of CTU involving low-tube-voltage (80 kVp) and low-iodine-concentration-contrast-medium (240 mgI/mL) (LVLC-CTU) with that of conventional CTU (120 kVp and 350 mgI/mL) using various CT scanners and IR algorithms in multiple institutions.
MATERIALS AND METHODS
Patients
This prospective study was approved by the Institutional Review Board of each of the 16 participating institutions (Supplementary Table 1 in the online-only Data Supplement), and informed consent was obtained from all patients. Initially, 338 patients who were scheduled to undergo CTU for the evaluation of urinary tract symptoms at the 16 participating institutions between November 2015 and March 2016 were recruited. Figure 1 summarizes the inclusion and exclusion criteria and the flowchart for enrollment in the study. After the exclusion of 39 patients, 299 patients were enrolled in this study (mean ± standard deviation [SD] age: 50.0 ± 12.8 years).
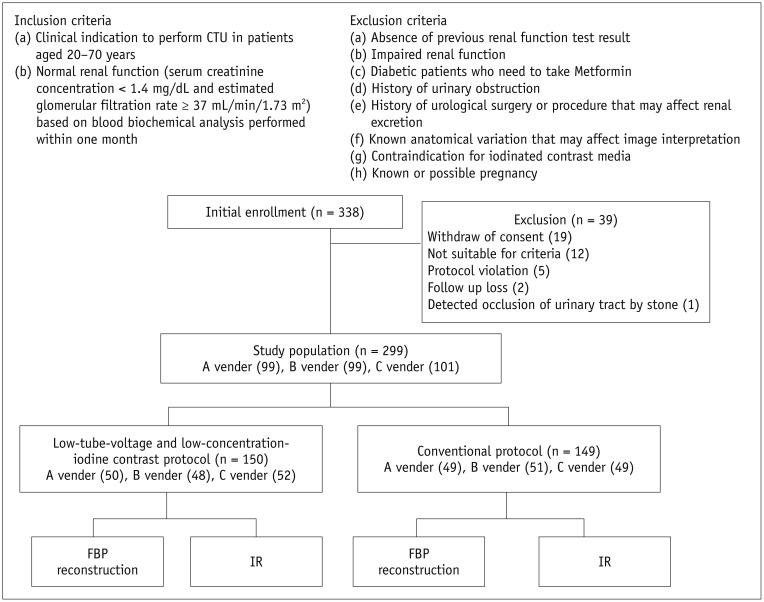
Fig. 1
Inclusion criteria, exclusion criteria, and flowchart for enrollment of study population.
Nineteen patients withdrew consent prior to CTU. Twelve patients were excluded for following reasons: 1) age > 70 years (n = 4); 2) abnormal renal function test results (n = 3); 3) metformin usage (n = 3); and 4) history of urinary tract obstruction (n = 2). Additionally, 8 patients were excluded for following reasons: 1) protocol violation (n = 5); 2) follow-up loss (n = 2); and 3) limitation of image assessment owing to incidental detection of urinary tract obstruction by urinary stone (n = 1). CTU = computed tomography urography, FBP = filtered-back projection, IR = iterative reconstruction
![]()
Patients were randomly assigned in a 1:1 ratio to the LVLC-CTU (n = 150) and conventional CTU (n = 149) groups using random number generators. Randomized stratification was used for even distribution of body mass index (BMI) > 25 kg/m2 and ≤ 25 kg/m2. An independent statistical company (Seoul CRO, Seoul, Korea) performed the permuted stratified block randomization (block size 4 or 2) using SAS® 9.2 (SAS Institute Inc., Cary, NC, USA) for sequence generation with stratification for the BMI and participating centers. Patients and assessors were blinded to the allocation.
CT Image Acquisition and Reconstruction
The CTU protocol consisted of precontrast, corticomedullary, and excretory phase scans. Images were acquired using commercially available multi-detector CT scanners with 64 or more channels capable of IR. CT scans were performed in the supine position with a scan range from the top of the diaphragm to the inferior margin of the symphysis pubis. All scans were acquired in a single breath-hold to minimize motion and misregistration artifacts.
Precontrast and corticomedullary phase scans were performed at a tube voltage of 100 kVp. The tube voltage for the corticomedullary phase scan was increased to 120 kVp in patients with BMI > 25 kg/m2 in order to increase X-ray penetration. The acquisition parameters were as follows: rotation time: 0.5 seconds; detector collimation: 64 × 0.625 mm, 64 × 0.6 mm, or 128 × 0.6 mm; pitch: 0.891 or 0.65; and scan field of view: 50 cm.
Using a power injector, 1.5 mL/kg (range: 78–144 mL) of iohexol (Iobrix 240 or Iobrix 350, Taejoon Pharm, Seoul, Korea), followed by 50 mL of normal saline, was administered via the right antecubital vein. The mean injection rate was 3.4 (range: 2.3–4.5) mL/s. In the conventional CTU protocol, 741 mg/mL (350 mgI/mL) of iohexol was used, and in the LVLC-CTU protocol, 509 mg/mL (240 mgI/mL) of iohexol was used. The total reduction in the amount of iodine was 31.4%.
Excretory phase images were obtained 480 seconds after contrast administration. The tube voltages were 120 kVp for conventional CTU and 80 kVp for LVLC-CTU, according to a previous study (11). The automatic tube current modulation technology available for each vendor (Care Dose 4D, Siemens Medical Solutions, Erlangen, Germany; Dose Right and Tube Current Modulation, Philips Medical Systems, Best, The Netherlands; or AutomA, GE Medical Systems, Milwaukee, WI, USA) was applied.
Excretory phase images were reconstructed at slice thicknesses of 5 mm and 3 mm in the axial and coronal/sagittal planes, respectively. Images acquired using the conventional CTU and LVLC-CTU protocols were reconstructed using a filtered-back projection (FBP) algorithm with a sharp convolution kernel and various IR algorithms available with each vendor's CT scanner for analysis. The IR level was set as follows to minimize noise and image degradation even when the radiation dose was reduced by 40%: 1) Hybrid IR algorithm (iDose4; Philips Healthcare): level 4; 2) Adaptive Statistical Iterative Reconstruction (ASIR; GE Healthcare) algorithm: level 40%; and 3) Sinogram Affirmed Iterative Reconstruction (SAFIRE; Siemens Healthineers) algorithm: level 2. Images were reconstructed with a field of view of 25–40 cm depending on the body habitus of the patient.
Image Analyses
Excretory phase images reconstructed using FBP and IR algorithms were analyzed. For qualitative analyses, three independent radiologists blinded to the protocol evaluated the diagnostic acceptability of CTU images on a PACS workstation monitor (Maroview, Infinitt Healthcare, Seoul, Korea). The readers were allowed to re-adjust the window width and level without pre-specified values. The image sharpness, noise, and overall diagnostic acceptability were determined on 3-, 3-, and 5-point scales, respectively (Table 1). The mean scores provided by the three radiologists were used for statistical analysis.
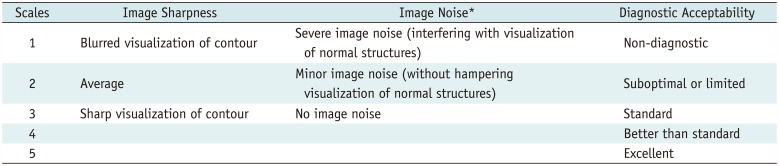
Table 1
Quantitative Scales of Image Sharpness, Noise, and Overall Diagnostic Acceptability
![]()
Quantitative image analysis was performed by radiologists present at each institution using the PACS system at the institution. Each radiologist was blinded to the CTU protocol. The attenuation values in Hounsfield units (HU) were measured in the contrast-filled pelvocalyces, upper and lower ureters, renal parenchyma, psoas muscle, and urinary bladder with manually drawn circular regions of interest (Fig. 2). All measurements were performed twice under identical window width and level settings (400 HU and 40 HU, respectively), and the mean value was used for analysis. The signal-to-noise ratio (SNR), contrast-to-noise ratio (CNR), and figure of merit (FOM) were calculated in both the urinary tract segments and urinary bladder. The SNR was calculated as follows: SNR = mean attenuation value / image noise. Image noise was defined as the SD of the attenuation measured in the ipsilateral renal parenchyma or psoas muscle for the calyx and renal pelvis or ureter and urinary bladder, respectively. The CNR was calculated as follows: CNR = (mean attenuation value - mean attenuation of reference tissue) / image noise. We calculated the FOM to compare the CNR independent of the effective dose, and it was determined as follows: FOM = CNR2 / effective dose (15).
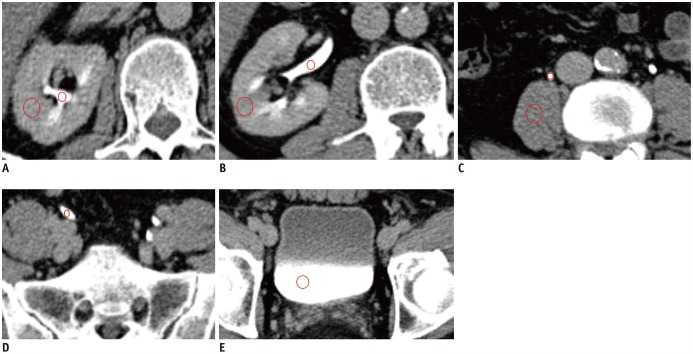
Fig. 2
Quantitative measurements of urinary tract, renal parenchyma, and psoas muscle.
Mean attenuation values (HU) were measured in contrast-filled regions of urinary tract including major calyx (A), renal pelvis and parenchyma (B), upper ureter and psoas muscle (C), lower ureter (D), and urinary bladder (E) with manually drawn circular ROIs (red circles). Sizes of ROIs for contrast-filled pelvocalyces and ureters were approximately 10–20 mm2 in axial or coronal images that better visualized urinary tract. Sizes of ROIs for renal parenchyma, psoas muscle, and bladder were approximately 40–100 mm2. Care was taken to avoid vessels, prominent artifacts (i.e., streak artifacts), and heterogeneous enhancing areas in renal parenchyma (i.e., focal scarring) and to place ROI in most homogeneous area. Urinary tract was measured on both sides separately (only right side was shown). HU = Hounsfield unit, ROIs = regions of interest
![]()
Radiation Dose Measurement
The volume CT dose index (CTDIvol) and dose length product (DLP) provided by each CT scanner workstation were saved as Digital Imaging and Communications in Medicine files. The DLP was converted to effective dose using age-, sex-, and tube voltage-specific conversion factors (0.0132–0.017) reported in publication 103 of the International Commission on Radiological Protection 3 (16).
Statistical Analysis
The primary endpoints were diagnostic acceptability and radiation dose. The secondary endpoints were image sharpness, image noise, SNR, CNR, and FOM. The chi-square test, Student's t test, and paired t test were used to compare the image qualities between LVLC-CTU with IR and conventional CTU with FBP groups.
A non-inferiority statistical test was performed for diagnostic acceptability between the LVLC-CTU with IR and conventional CTU with FBP groups. We defined a −0.74 score difference as a non-inferior margin to ensure that the diagnostic acceptability was greater than a score of 4 when compared with the conventional protocol score through consensus among participating radiologists according to a previous study. In the aforementioned study, the mean grades assigned by the more experienced radiologist of the two independent evaluators for the quality of images were 4.34 (± 0.65) (mean ± SD) for the LVLC-CTU protocol and 4.74 (± 0.44) for the conventional protocol (14). A sample size of 43 patients in each group could achieve 80% power to detect a non-inferiority margin difference between group means of −0.4, assuming a one-sided significance level of 2.5%. We assumed a conservative dropout rate of 10% for sample size calculation, which resulted in 48 patients in each group. We arrived at a final sample size of 288 patients considering enrollment of 96 patients for each CT vendor. For administrative reasons, the enrollment of a maximum of 305 patients was allowed (100 for two CT vendors and 105 for one CT vendor).
All statistical analyses were performed using SAS® 9.2. A p value < 0.05 was considered statistically significant.
RESULTS
Demographics
Patient demographics are summarized in Table 2. In the LVLC-CTU and conventional CTU groups, the mean patient ages were 50.7 years (range: 22–70 years) and 49.3 years (range: 20–70 years), respectively (p = 0.358), and the mean BMI values were 23.88 ± 3.37 kg/m2 (range: 15.5–35.2 kg/m2) and 23.50 ± 3.59 kg/m2 (range: 16.4–37.7 kg/m2), respectively (p = 0.352).
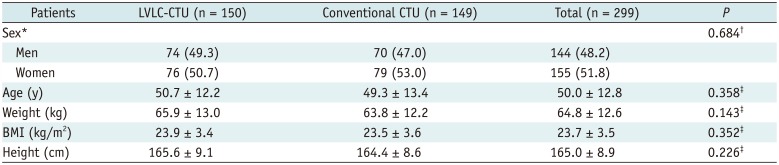
Table 2
Comparison of Demographic Data between Patients in LVLC-CTU and Conventional CTU Groups
Data are presented as mean ± standard deviation unless otherwise specified. *Data are presented as number (percentage). Comparison using †chi-square test and ‡Student's t test. BMI = body mass index, CTU = computed tomography urography, LVLC = low-tube-voltage and low-iodine-concentration-contrast-medium
![]()
Qualitative Image Analyses
The noise and sharpness scores of the LVLC-CTU with IR (2.55 ± 0.24) were significantly lower than those of the conventional CTU with FBP (2.66 ± 0.17, p < 0.001). However, the LVLC-CTU with IR showed, at least, an acceptable noise and average sharpness (score of 2) (Fig. 3).
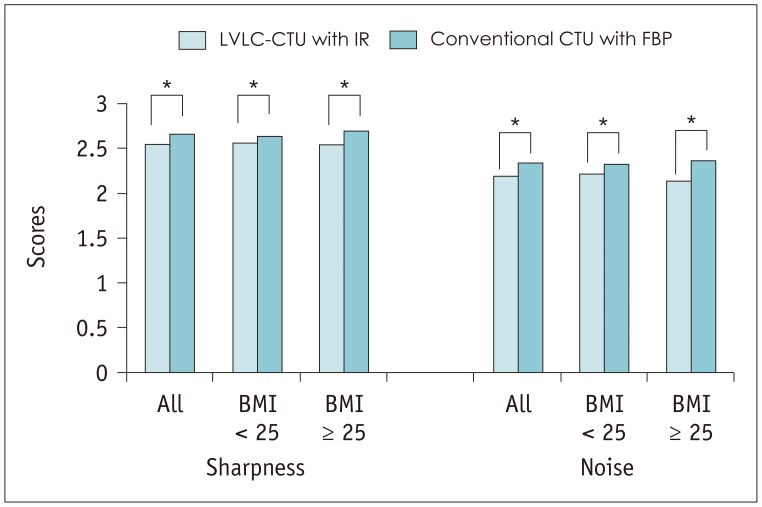
Fig. 3
Image sharpness and image noise for LVLC-CTU with IR and conventional CTU with FBP.
Noise and sharpness scores for LVLC-CTU with IR (2.55 ± 0.24) were significantly lower than those for conventional CTU with FBP (2.66 ± 0.17, p < 0.001). However, LVLC-CTU with IR showed at least acceptable noise and average sharpness (score of 2). BMI = body mass index, LVLC = low-tube-voltage and low-iodine-concentration-contrast-medium
![]()
The diagnostic acceptability of the LVLC-CTU with IR (3.88 ± 0.46) was significantly lower than that of the conventional CTU with FBP (4.02 ± 0.36, p = 0.004) (Table 3). In patients with BMI ≤ 25 kg/m2, the diagnostic acceptability of the LVLC-CTU with IR was not significantly different from that of the conventional CTU with FBP (p = 0.288). However, in patients with BMI > 25 kg/m2, the diagnostic acceptability of the LVLC-CTU with IR was significantly lower than that of the conventional CTU with FBP (p < 0.001). Both the LVLC-CTU and conventional CTU showed at least standard image quality with regard to diagnostic acceptability (score ≥ 3) using both FBP and IR algorithms.
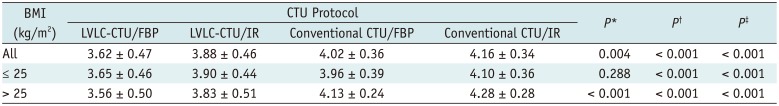
Table 3
Comparison of Diagnostic Acceptability Scores among CTU Protocols
Larger values represent better diagnostic acceptability. *Student's t test for comparisons between LVLC-CTU/IR and conventional CTU/FBP, †Paired t test for comparisons between LVLC-CTU/IR and LVLC-CTU/FBP, ‡Paired t test for comparisons between conventional CTU/IR and conventional CTU/FBP. FBP = filtered-back projection, IR = iterative reconstruction
![]()
The difference in the score for diagnostic acceptability between the LVLC-CTU with IR and the conventional CTU with FBP was −0.14 (95% confidence interval = −0.23, −0.05). As the lower boundary of the confidence interval of the mean score difference (−0.23) was above the pre-defined non-inferiority margin of −0.74, the non-inferiority of the LVLC-CTU with IR was established after comparison with the conventional CTU with FBP.
Quantitative Image Analyses
The results of the quantitative analyses are summarized in Table 4. The mean attenuation value was significantly higher for the LVLC-CTU with IR than that for the conventional CTU with FBP in all pre-defined segments of the urinary tract, including the bilateral pelvocalyces and urinary bladder (Fig. 4). The mean SNR, CNR, and FOM values in all anatomical structures were higher for the LVLC-CTU with IR than those for the conventional CTU with FBP. However, the differences were not statistically significant except for the left upper ureter. Representative images for both protocols are shown in Figure 5.
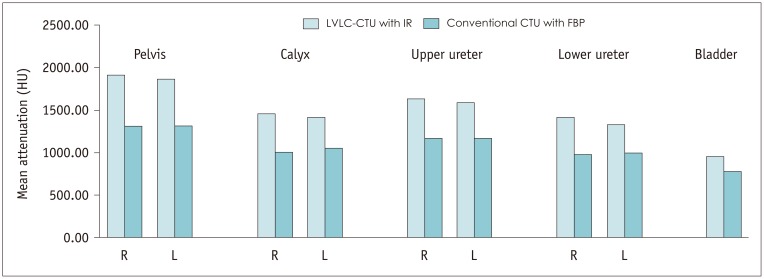
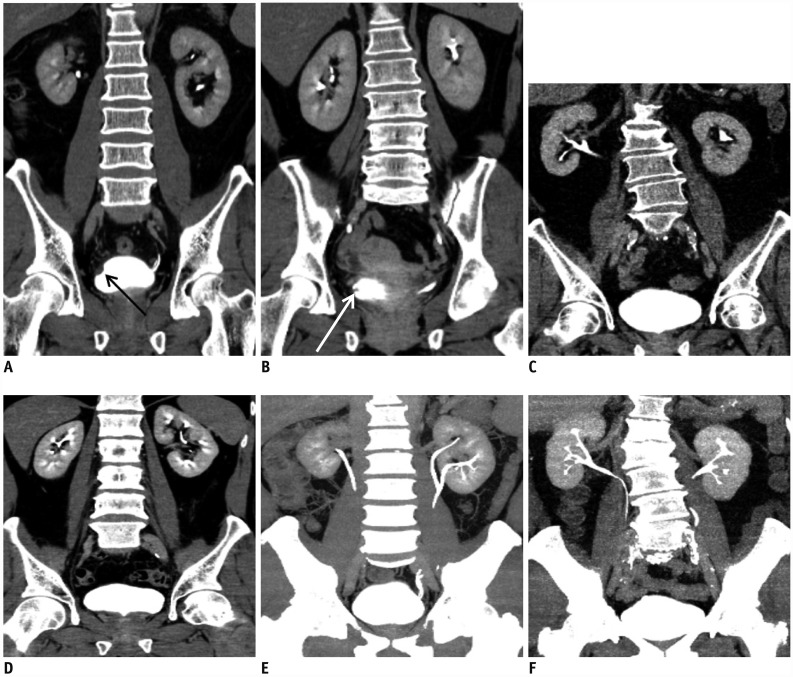
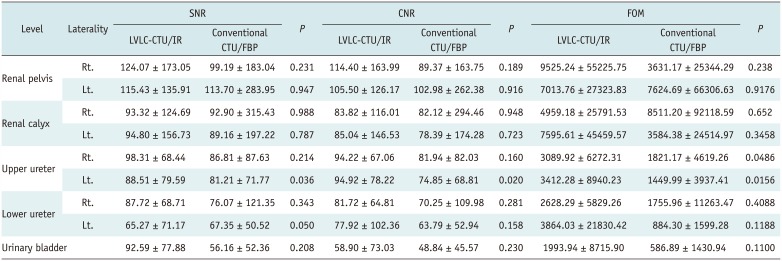
Fig. 4
Mean attenuation measured using LVLC-CTU with IR and conventional CTU with FBP.
Mean attenuation value for LVLC-CTU with IR was significantly higher than that for conventional CTU with FBP in all pre-defined segments of urinary tract including pelvocalyces on both sides and urinary bladder.
![]()
Fig. 5
Multi-planar reconstructed images of excretory phase in CTU.
In conventional CTU with FBP images acquired from patients with high BMI (A) and low BMI (B), filling defects due to polypoid tumor (arrow) (A) or trabeculated muscle (arrow) (B) were well visualized with high contrast-to-noise ratio. In LVLC-CTU with IR images acquired from patients with high BMI (C) and low BMI (D), collecting systems, including calyces and urinary bladder, showed high attenuation. Diagnostic acceptability scores were comparable between two protocols. In maximum intensity projection images of urinary tract involving LVLC with IR (E) or conventional CTU with FBP (F), urinary tract was well visualized with LVLC-CTU compared to conventional CTU, despite injection of iodine contrast with low osmolality.
![]()
Table 4
Comparison of Results of Quantitative Analysis between LVLC-CTU with IR and Conventional CTU with FBP
![]()
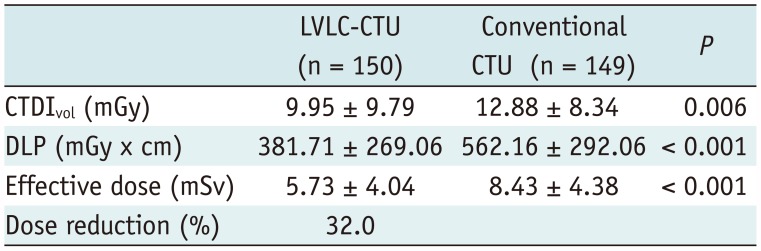
Estimation of Radiation Dose
The CTDIvol, DLP, and effective dose for the LVLC-CTU and conventional CTU protocols during the excretory phase are summarized in Table 5. The radiation dose was significantly lower with the LVLC-CTU than with the conventional CTU (p < 0.01, all variables), with a 32.0% reduction in the effective dose.
DISCUSSION
The present study was conducted to expand on the results of a previous single-institution study (14). The results of the present study could be considered more generalizable and may support the clinical validity of LVLC-CTU.
In this study, LVLC-CTU showed a 32.0% reduction in the radiation dose in the excretory phase scan when compared to the dose with conventional CTU. LVLC-CTU with IR showed slightly lower image noise and image sharpness scores. However, the diagnostic acceptability scores were comparable between the two protocols according to a non-inferiority test. Furthermore, there was no statistical difference in objective diagnostic values (SNR, CNR, and FOM) between the two protocols. It is important to establish a CTU protocol with a low radiation dose for the following reasons. First, CTU is strongly recommended as a preoperative imaging technique for the evaluation of upper tract urothelial malignancy in high-risk patients. Second, CTU plays an important role in the identification of urothelial tumor recurrence (i.e., contralateral recurrence after nephroureterectomy or nephron sparing procedures) and urinary complications after urinary tract surgery (i.e., urine leakage or stricture at anastomotic site after urinary diversion) and therefore, clinically indicated patients might need to undergo repeated CTU examinations. Third, CTU is one of the CT protocols with a high radiation dose because of wide scan coverage (from the kidney to the bladder neck) and multiple phases (171819). Therefore, LVLC-CTU with IR demonstrating a comparable diagnostic acceptability despite a significant dose reduction is in line with the “As Low As Reasonably Achievable” principle.
Although CT, at a low-tube-voltage, is an emerging technique for radiation dose optimization, reducing tube voltage may eventually degrade image quality (20). There have been remarkable advances in IR technology over the past few years, and several studies have shown that the use of IR can help overcome such an issue to some degree (92122). In this study, although the image sharpness and noise scores were statistically lower for LVLC-CTU with IR than for conventional CTU with FBP, the overall diagnostic acceptability was not inferior.
A patient's body habitus is one of the factors that should be considered in low-tube-voltage imaging. In obese patients, photon penetration decreases and image quality degrades because of the photon starvation effect (23). In our study, there was no statistically significant difference in the diagnostic acceptability scores between the two assessed protocols in the subgroup of patients with BMI ≤ 25 kg/m2. This finding indicates that patients with a small body habitus can undergo low-tube-voltage CTU. Some investigators have advocated that patients with BMI < 25 kg/m2 can undergo abdominal CT at 100 kVp (62425). We speculate that CTU at 80 kVp is possible, in contrast to general abdominal imaging; this is because the primary task of the excretory phase of CTU is to assess filling defects within urinary tracts filled with iodinated contrast medium. This may allow image noise to be tolerable to radiologists owing to a high CNR (2627).
We observed higher mean attenuation values across different urinary tract segments in LVLC-CTU with IR when compared to conventional CTU with FBP, despite a 31.4% reduction in the total injected iodine dose. Our results suggest that 240 mgI/mL or lower concentrated contrast media could be appropriate for 80 kVp CTU. Lowering the concentration of the contrast medium might affect bolus hemodynamics, which is an important aspect of dynamic contrast-enhanced CT studies (28). However, the excretory phase of CTU is relatively free from contrast medium dynamics because image acquisition is performed much later after the achievement of an equilibrium state (29).
A potential advantage of using low-iodine-concentration-contrast-medium is that the risk of CIN might be reduced, since the high osmolality and high volume of iodinated contrast media are well-known risk factors of CIN (1213). However, presently, there is limited evidence showing that low-osmolar iodinated contrast medium is a risk factor for CIN in patients with relatively good kidney function (estimated glomerular filtration rate > 45 mL/min/1.73 m2) (30). Although the current study was performed in patients with normal kidney function, we believe that LVLC-CTU with IR will help reduce the risk of CIN in patients with impaired kidney function.
The present study has several limitations. First, we did not evaluate corticomedullary and urothelial phase images. The degree of contrast enhancement can be altered by a reduction in the iodine concentration in LVLC-CTU. The lowering of tube voltage might change the CT attenuation number and enhancement, and might result in a diagnostic error with regard to detected focal lesions (31). Therefore, we used conventional CT parameters with conventional tube voltage for corticomedullary scanning. We also did not acquire the urothelial phase image. If the urothelial phase data had been collected at the time of the study, it would have been possible to deepen the meaning of our results. In a previous study, CT renal angiography using 80 kVp tube voltage and a moderately-concentrated contrast medium showed better diagnostic acceptability (32). In the perfusion study of VX tumors using modified hepatic CT with a combination of low-tube-voltage (80 kVp), low-iodine-concentration-contrast-medium (270 mgI/mL), and IR algorithm, there was no significant difference in tumor perfusion and CNR during arterial and portal venous phases compared with the conventional protocol (33). The corticomedullary phase scan can also be performed using the LVLC protocol without diminishing sufficient contrast enhancement. Further study is needed to validate the low-tube-voltage protocol for corticomedullary phase scanning. Second, we did not describe diagnostic outcomes, such as sensitivity/specificity for focal lesion detection, and clinical outcomes. In our study, 31 focal lesions were detected on CTU. We analyzed the mean attenuation difference (HU) between the detected focal lesions and adjacent contrast-filled collecting systems to evaluate the CNR and SNR. The mean attenuation difference for lesions detected on LVLC-CTU with IR was not significantly different from that for lesions detected on conventional CTU with FBP. However, the analysis was difficult, because the sample size was too small for comparison and some focal lesions were found in only one group. Further study is needed to evaluate the diagnostic and clinical outcomes for wide application of LVLC-CTU with IR. Third, we did not compare image quality among the three CT vendors. The technical consideration of the used IR algorithm may vary depending on the vendor, and this could have affected image quality in our study (34). However, the evaluation of differences among images obtained from the scanners of various vendors was beyond the scope of this study. The reason for using scanners from various vendors was to ensure that LVLC-CTU could be widely performed by a variety of CT scanners. To minimize bias according to differences among the CT scanners, the same number of patients was assigned to each group in each institution.
In conclusion, in this prospective, multi-institutional, randomized controlled trial, the diagnostic acceptability and quantitative image quality of LVLC-CTU (80 kVp and 240 mgI/mL) with IR were not inferior to those of conventional CTU. Additionally, LVLC-CTU is beneficial because radiation exposure and the total iodine load are reduced, especially in patients with BMI ≤ 25 kg/m2.
 XML Download