

 PDF
PDF ePub
ePub Citation
 Print
Print


INTRODUCTION
Crohn's disease (CD) is an idiopathic, chronic inflammatory bowel disease characterized by transmural and segmental inflammation of the intestinal wall. The incidence and prevalence of CD continues to rise in low-incidence areas, such as southern Europe, Asia, and developing countries, despite its stabilization in high-incidence areas, such as Northern Europe and North America (1).
Due to lifelong relapse-and-remission characteristics of CD, various radiological examinations play an important role in the diagnosis of CD and evaluation of its activity, in addition to the presence of extra-enteric complications (23456). Assessment of activity with stratification for CD patients is crucial for determination of a therapeutic strategy and prediction of prognosis (7). Various indices exist to evaluate CD activity, such as the Crohn's disease activity index (CDAI), Crohn's disease endoscopic index of severity (CDEIS), and Magnetic Resonance Index of Activity score (789). Due to the complexity and lack of objectivity of CDAI, inconvenience associated with the invasiveness of endoscopy, and reduced availability and high cost of magnetic resonance enterography, CT enterography (CTE) has become an accepted non-invasive imaging technique to evaluate CD activity or postoperative recurrence in an easy and semi-quantitative manner (10111213).
The degree of enhancement on CTE strongly correlates with CD activity (14151617). Applying region-of-interest (ROI) analysis to diseased bowel loops by using conventional CTE is a simple method to assess the degree of enhancement. However, the presence of intramural fat or hemorrhage may underestimate or overestimate the degree of enhancement, respectively. The recent development of dual-energy CT (DECT) has renewed interest for iodine quantification with CT (18). High-energy X-ray photons are differentiated from low-energy X-ray photons in DECT because the attenuation of materials and tissues differs at various photon energies (567). DECT allows for the quantification of materials and tissues. Quantifying iodinated contrast media allows the DECT technique to provide an estimate of contrast distribution across diseased bowel loops at a single point in time, and to serve as a quantitative biomarker for bowel perfusion (1920). A novel DECT technique, which uses a single tube with a dual-layer detector capable of differentiating between low- and high-energy X-ray photons, has recently become commercially available. To the best of our knowledge, there have been no reports regarding the usefulness of spectral detector-based DECT to evaluate CD activity or create a scoring system based on dual-energy CT enterography (DECTE), in contrast to reports involving endoscopic examination or magnetic resonance imaging (789). Therefore, the purposes of this study were to correlate CT features that include iodine concentration from spectral detector-based DECTE with CDAI and to externally validate quantitative CT parameters.
Go to : 
MATERIALS AND METHODS
The Institutional Review Board of our institution approved this retrospective study and the requirement for informed consent was waived.
Derivation Study for DECTE Index
Patient Data
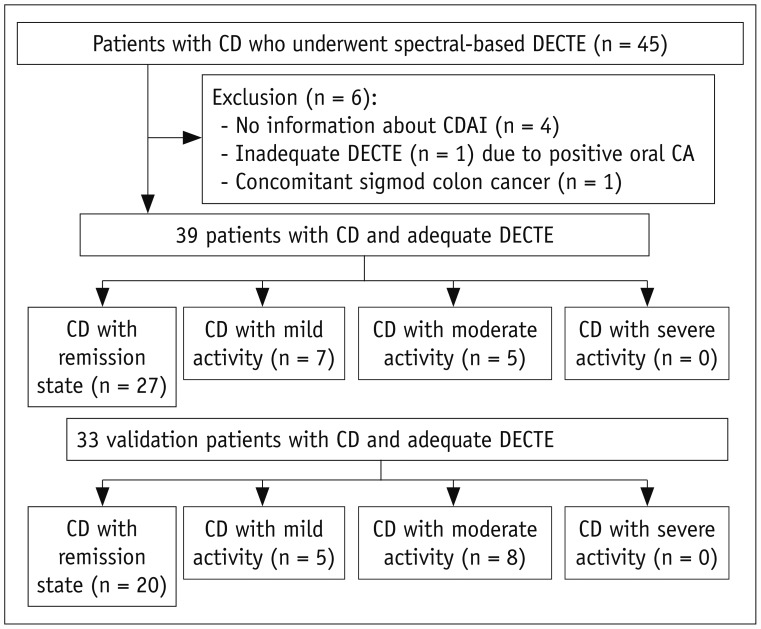
Between June 2016 and May 2017, a total of 45 consecutive patients with CD who underwent spectral detector-based DECTE were enrolled by using a text search function in our picture archiving and communication system (PACS). Of 45 patients, six were excluded on the basis of the following exclusion criteria: four patients without information regarding CDAI, or in whom CDAI was calculated more than 30 days from the CT examination; one patient whose bowel wall was unable to be evaluated due to remnant positive contrast material in bowel loops; one patient with underlying CD who was diagnosed with concomitant sigmoid colon cancer. Finally, 39 patients with CD were enrolled in this retrospective study (Fig. 1). They were 25 men and 14 women with a mean age of 33.9 years (range, 20–68 years).
Clinical Parameters for CD Activity
Crohn's disease activity flow sheets from electronic medical records of our institution were used to assess CD activity. CDAI scores that had been evaluated within 30 days from the dates of CTE examinations were recorded. Upon examination by experienced gastroenterologists, CDAI score was determined by the sum of eight variables after adjustment with each weighting factor. CDAI scores ranged from 0 to approximately 600 points. On the basis of previous studies, the state of CD activity was subdivided into four groups: remission of disease (CDAI scores less than 150), mild (CDAI scores of 150–219), moderate (CDAI scores of 220–450), and severe (CDAI scores > 450) (21). Thereafter, the patients were divided into two groups: remission (CDAI < 150) and active (CDAI ≥ 150) groups. The assessed CDAI scores were those closest to the examination dates of the DECT. The mean interval between the date of CDAI and the date of DECT examination was 11 days (range, 10–21 days). Assessments of white blood cell count, platelet, hemoglobin, hematocrit, inflammatory markers (e.g., erythrocyte sedimentation rate), C-reactive protein (CRP), and serum levels of total protein and albumin were also performed.
CT Scanning
All patients were asked to ingest 1350 mL of a low Hounsfield unit (HU) enteric contrast agent (Easymark, Taejoon Pharmaceutical Co. Ltd., Seoul, Korea) 1 hour prior to CT scanning. All spectral detector-based DECTE examinations were performed by using a spectral detector-based DECT scanner (IQon Spectral CT, Philips Healthcare, Cleveland, OH, USA) with a tube voltage of 120 kVp. Automated tube current modulation (DoseRight, Philips Healthcare) was applied. An intravenous contrast agent (iohexol; Bonorex 350, Central Medical Service, Seoul, Korea) with a total amount of 1.6 mL/kg of body weight was administered at a rate of 3–5 mL/sec for a fixed 30 seconds by using a power injector system. Saline chase was performed at the same rate for 10 seconds. Triphasic CT consisting of precontrast, enteric phase, and portal venous phase was performed for all patients. For the enteric phase, a 35-second delay was used after the aorta reached 100 HU by using the bolus-tracking method. For the portal phase, a fixed 70-second delay was used after contrast administration. Portal-phase images were scanned in the conventional polychromatic mode; enteric-phase images were scanned in the spectral mode, in which spectral-based images (SBIs) can be generated. The SBIs contained the raw data of both detector layers and were used to reconstruct any dual-energy images, such as virtual monoenergetic images or virtual noncontrast images, and to perform spectral analysis, such as iodine concentration calculation.
For enteric phase images, conventional polychromatic images were reconstructed at 120 kVp by using an iterative reconstruction algorithm, iDose4 (Philips Healthcare). In addition, virtual monoenergetic images were reconstructed at 40 keV. All conventional and virtual monoenergetic images were reconstructed on both axial and coronal planes with 3-mm slice thickness and 3-mm reconstruction interval. For the measurement of the iodine concentration, iodine concentration maps were generated by using dedicated software (IntelliSpace Portal, Philips Healthcare) networked with a PACS workstation. Polychromatic enteric phase images reconstructed with iDose4 and iodine concentration maps were used for further image analysis.
CT dose index volume (CTDIvol) and dose length product (DLP) were recorded for each CT examination to analyze the radiation exposure of spectral detector-based DECTE. The effective radiation dose was calculated by multiplying DLP by the conversion factor (0.015 mSv/mGy·cm) (22).
CT Image Analysis and Iodine Quantification
Two radiologists, blinded to the clinical and endoscopic findings, reviewed all DECTE images by consensus. The analyzed CT items were location and number of involved bowels; wall thickness (mm); enhancement pattern of involved bowels; subjective degree of enhancement; presence and degree of mesenteric fat infiltration, comb sign, lymphadenopathy, fistula, and obstruction; and presence of fibrofatty proliferation, mesenteric abscess, or gallstone. The enhancement pattern was divided into three subtypes: single homogeneous, bilaminar, or tri-laminar patterns. The degree of mesenteric fat infiltration was assessed with a 4-point scale: 0, absent; 1, mild; 2, moderate; 3, severe. The degree of comb sign was assessed with a 4-point scale: 0, absent; 1, minimal; 2, segmental dilatation with mild tortuosity; 3, diffuse dilatation with severe tortuosity. The presence of fibrofatty proliferation was evaluated. The degree of lymphadenopathy was graded by using a 4-point scale: 0, absent; 1, regional; 2, distant; 3, diffuse. When lymph nodes enlarged greater than 1 cm in long-axis diameter and were detected only around the involved segment, we considered them as regional lymphadenopathy. If enlarged lymph nodes were found in a distant area not in a regional area, distant lymphadenopathy was recorded. If lymph node enlargements were shown in both regional and distant areas, diffuse lymphadenopathy was considered. The degree of fistula was graded with a 4-point scale: 0, absent; 1, perianal; 2, enteric; 3, both. The degree of obstruction was assessed by using a 4-point scale: 0, absent; 1, partial low-grade obstruction-mild dilatation with occasional air-fluid levels and some colonic gas; 2, partial high-grade obstruction-moderate small bowel dilatation more than air-fluid levels and colonic gas; 3, complete obstruction-marked dilated loops of small bowel with air-fluid levels and little or no colonic gas (23). Fibrofatty proliferation was considered present when there was mesenteric fat proliferation around the involved bowel that resulted in a widening of the interloopal space. The degree of bowel enhancement was assessed both qualitatively and quantitatively. For the qualitative assessment, bowel wall enhancement was graded by using a 4-point scale: 0, normal; 1, minor enhancement, bowel wall attenuation greater than normal small bowel but significantly less than nearby vascular structures; 2, moderate enhancement, bowel wall attenuation increased but somewhat less than nearby vascular structures; 3, marked enhancement, bowel wall signal approached that of nearby vascular structures (24). For the quantitative analysis, two radiologists independently applied ROIs to the diseased bowel wall that showed the strongest enhancement in the most conspicuous part of small and large bowels on iodine concentration maps generated from enteric-phase CT (Fig. 2). Then, they measured attenuation and iodine amount (mg·I/mL) on conventional polychromatic images and iodine quantification maps, respectively. Free-hand ROIs were drawn as large as possible on the diseased bowel to avoid intraluminal air or fluid and perienteric fat. The mean size of ROIs was 5 mm2 (range, 3–10 mm2). ROI analysis was also applied to precontrast images by using the “copy and paste” function for the measurement of relative enhancement. Relative enhancement on conventional polychromatic image was calculated by using the formula:
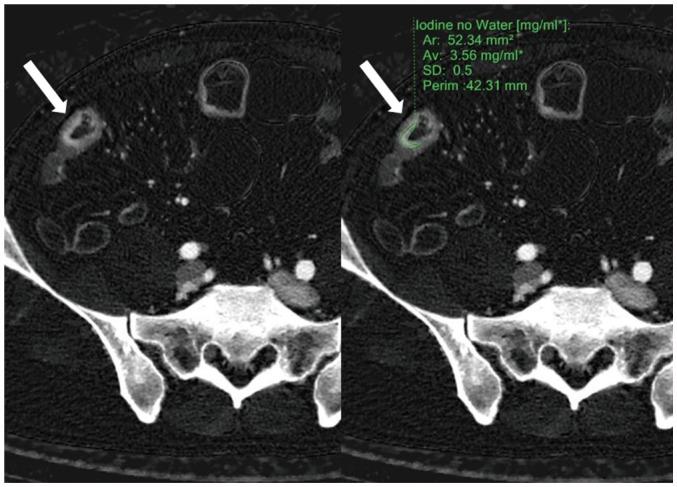 | Fig. 2ROI application.Radiologists applied ROI (green line, right image) to diseased bowel wall (arrows) that showed strongest enhancement in most conspicuous part of small and large bowels on iodine concentration maps generated from enteric phase CT. In this particular patient, iodine concentration measured 3.56 mg·I/mL. Ar = area, Av= average, ROI = region-of-interest, SD = standard deviation
|
Relative enhancement = [(HUent − HUpre) / HUpre] × 100, where HUent indicates HU on enteric-phase images and HUpre indicates HU on precontrast images.
Statistical Analysis
Clinical and CT imaging characteristics were evaluated by the Kolmogorov-Smirnov test for normal distribution. Univariate statistical tests were used to evaluate if there was a significant difference of CTE features between remission and active groups. The chi-squared test or Fisher's exact test were used for discontinuous variables; Student's t test was used for continuous variables. In addition, Pearson's correlation test was used analyze inter-observer agreement for the degree of enhancement by two radiologists, as well as to analyze correlations between quantitative DECT parameters and CDAI. Finally, to find the most discriminant CT features, stepwise multiple linear regressions analyses were performed by using CT variables that showed significant correlations with CDAI on univariate analysis. p < 0.05 was considered to indicate statistical significance; a 95% confidence interval was reported for each variable. Statistical analysis used SPSS version 22.0 (IBM Corp., Armonk, NY, USA) and MedCalc for Windows (version 8.0.0.1, MedCalc Software, Mariakerke, Belgium).
Validation Study for DECTE Index
To provide external validation of the DECTE index obtained from the derivation study, we recruited 33 consecutive patients who were diagnosed with CD from June 2017 to March 2018. They were 24 men and 9 women; their mean age was 36.4 years (range, 16–73 years). For these patients, the CDAI scoring system, CT acquisition protocol, and diagnostic tool were the same as in the derivation study. The mean interval between the date of CDAI and the date of DECT examination was 12.5 days (range, 0–56 days). To test the scoring performance of the linear regression equation obtained from the derivation study, Pearson's correlation test and the Bland-Altman test were used. Concordant rate of disease activity between estimated and real CDAI was also calculated. Statistical analysis for the validation test used SPSS version 22.0.
Go to :
RESULTS
Derivation Study
Clinical Findings
Table 1 shows the demographic and clinical findings. Median duration of CD diagnosis was 3.84 years (range, 0.95–8.81 years). Treatments for each patient at the CT examination date were: three on 5-aminosalicyclic acid (5-ASA), 11 on steroids, 5 on an immunosuppressant, 16 on combination treatment of 5-ASA or steroids or immunosuppressant, and 4 on infliximab therapy. Five patients had undergone operations previously: four had undergone right hemicolectomy and one had undergone small bowel segmental resection. The mean CDAI scores were 86.6 with a range of 12.0–305.64. Based on CDAI score, 27 (69.3%) patients were classified as remission group, seven as CD with mild activity, and five as CD with moderate activity. Therefore, 27 patients were placed in the remission group and 12 were in the active group. The mean CRP concentration was 1.60 mg/dL (range, 0.88–2.31 mg/dL).
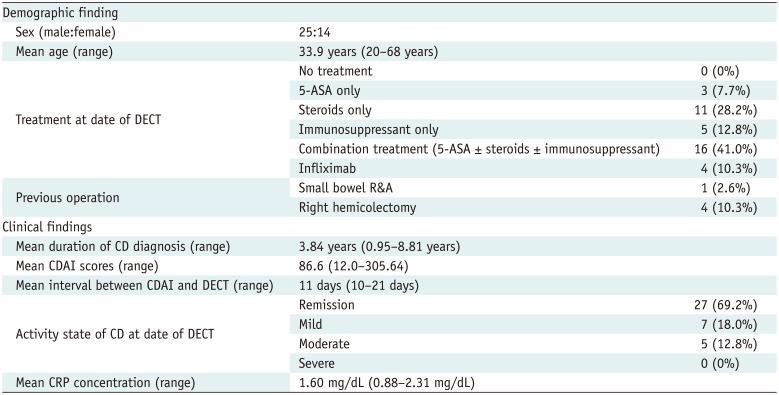
Table 1
Demographic and Clinical Characteristics of 39 Patients in Derivation Study
![]()
Radiation Dose
The mean CTDIvol, DLP, and effective radiation dose for precontrast images were 2.59 mGy (range, 2.38–2.80 mGy), 139.13 mGy·cm (range, 126.11–152.14 mGy·cm), and 2.11 mSv (range, 1.17–3.77 mSv), respectively. The mean CTDIvol, DLP, and effective radiation dose for each enteric and portal venous phase were 9.89 mGy (range, 9.03–10.74 mGy), 534.13 mGy·cm (range, 480.91–587.35 mGy·cm), and 8.00 mSv (range, 1.18–14.37 mSv), respectively. Therefore, the mean effective dose for all three phases was 18.11 mSv (range, 16.45–20.04 mSv).
DECTE Findings
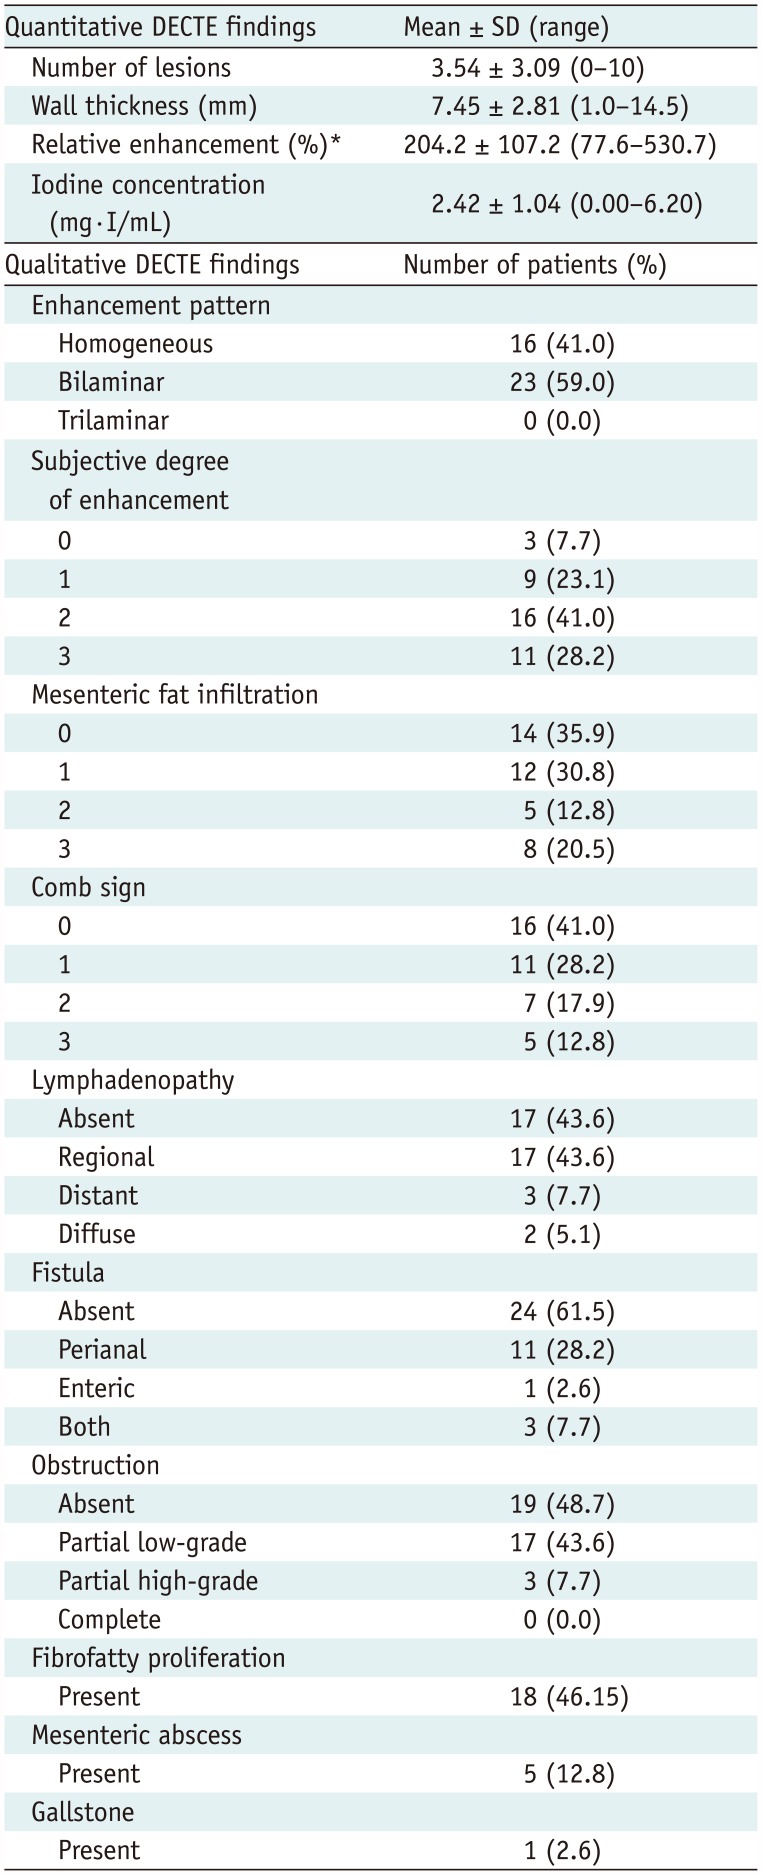
Table 2 shows the overall DECTE findings in 39 patients. The mean number of lesions and wall thickness were 3.54 mm and 7.45 mm, respectively. Mean relative enhancement and iodine concentration of the lesions were 204.19% and 2.42 mg·I/mL, respectively. The inter-reader agreement for the measurement of quantitative iodine concentration was very good (correlation coefficient = 0.838) (Fig. 3). Approximately 50% (16/39, 41.0%) of the patients showed homogeneous enhancement of the diseased bowel, while the remaining half (23/39, 59.0%) showed a bilaminar pattern of enhancement. Moderate (n = 5) to severe (n = 8) mesenteric fat infiltration was observed in 13 patients. The comb sign was positive in 23 patients (58.9%). In terms of lymphadenopathy, there was no involvement in 17 patients, regional involvement in 17, distant involvement in 3, and diffuse involvement in 2. Fifteen patients had perianal (n = 11), enteric (n = 1), or both (n = 3) fistulas. Partial low-grade (n = 17) or high-grade (n = 3) obstruction was found in 20 patients. None of the 3 patients with high-grade obstruction underwent surgery for the treatment of obstruction. They all recovered from obstruction with conservative medical treatment. Fibrofatty proliferation, mesenteric abscess, and gallstone were present in 18 (46.15%), 5 (12.8%), and 1 (2.6%) patient, respectively. Table 3 shows the results of statistical comparisons between remission and active groups.
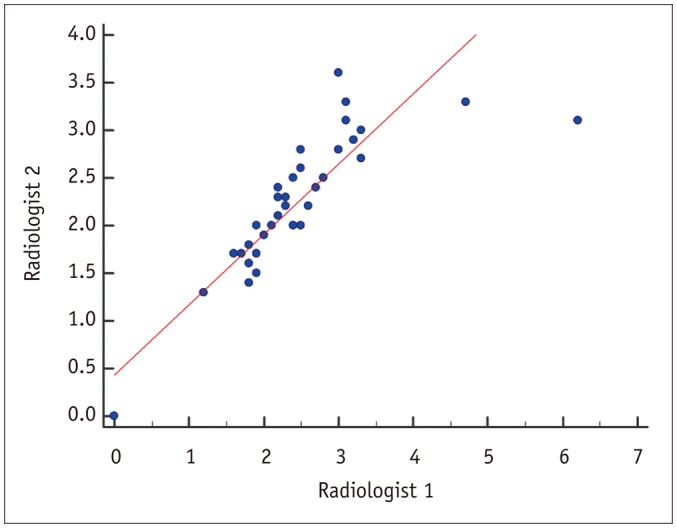 | Fig. 3Scatter diagram of iodine quantification by two radiologists.Inter-reader agreement was very good, with correlation coefficient of 0.838 (p < 0.001).
|
Table 2
Results of Spectral Detector-Based DECTE Findings
![]()
Table 3
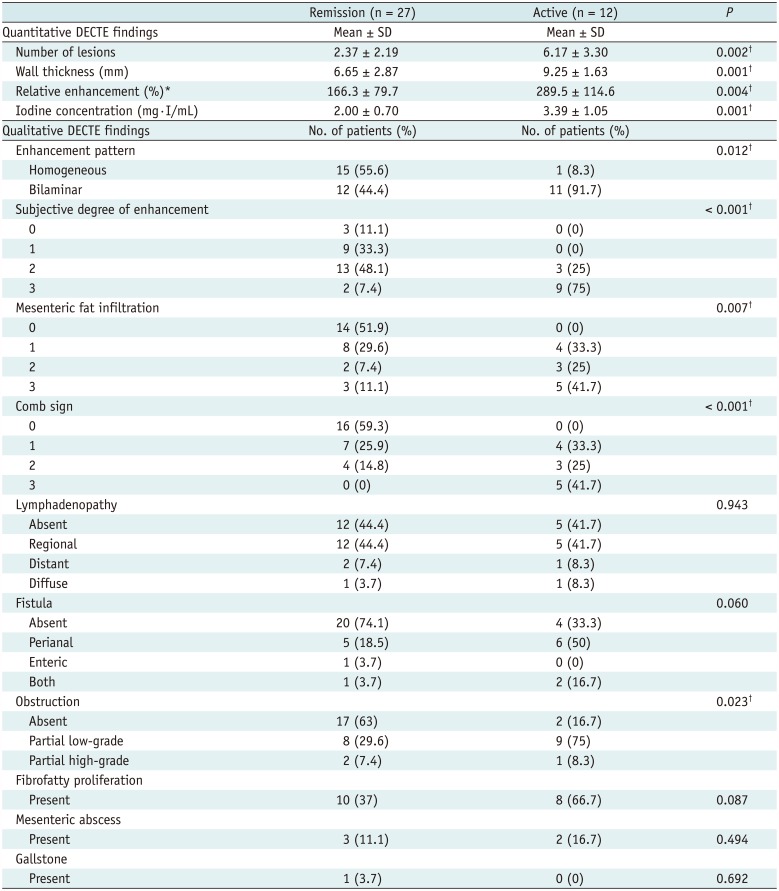
Statistical Results of DECTE Features between Remission and Active Groups in Derivation Study
![]()
DECTE Findings and CDAI
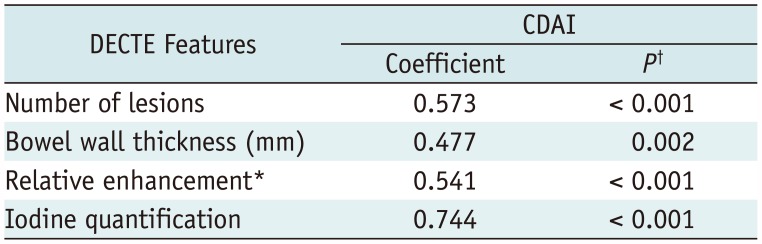
Table 3 shows the results of univariate analyses of DECTE findings between remission and active groups. For qualitative CTE findings, there were significant differences between remission and active groups in terms of enhancement pattern (p = 0.012), subjective degree of enhancement (p < 0.001), mesenteric fat infiltration (p = 0.007), comb sign (p < 0.001), and obstruction (p = 0.023). For quantitative CTE features, patients in the active group showed a significantly larger number of lesions (p = 0.002), thicker bowel wall (p = 0.001), stronger relative enhancement (p = 0.004), and higher iodine concentration (p = 0.001) in the involved bowel, compared with those in the remission group. Table 4 shows the results of correlation analyses between quantitative DECTE findings and CDAI. First, there was no significant correlation between CDAI and CRP concentration (p = 0.112). There were significant correlations between CDAI and all quantitative CT parameters, such as numbers of lesions (correlation coefficient r = 0.573, p < 0.001), bowel wall thickness (r = 0.477, p = 0.002), relative degree of enhancement (r = 0.541, p < 0.001), and iodine concentration (r = 0.744, p < 0.001). Representative examples are shown in Figures 4,5,6,7.
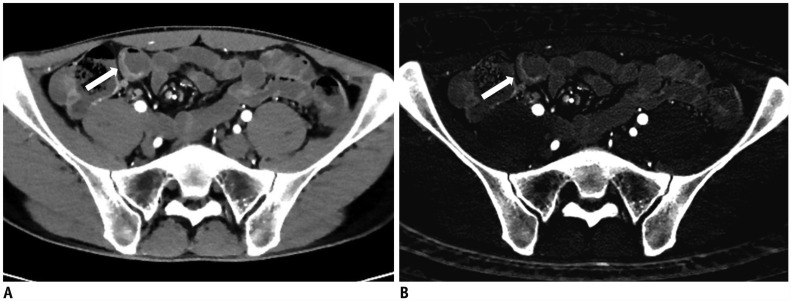 | Fig. 428-year-old male with known CD.
A. On DECTE enteric-phase image, subtly-enhancing eccentric wall thickening (arrow) is visible in distal ileum. Relative enhancement of this lesion measured 131%. B. On iodine map of DECTE, iodine concentration of lesion (arrow) was 1.6 mg·I/mL. Therefore, estimated CDAI with linear regression equation (CDAI = 53.549 × iodine concentration + 55.111) was 141, which was score for remission (CDAI < 150). Patient's real CDAI score was 24, which also indicated remission state.
|
 | Fig. 541-year-old female with known CD.
A. On DECTE enteric-phase image, focal enhancing and concentric wall thickening (arrow) is visible in terminal ileum. Relative enhancement of this lesion was 201%. B. On iodine map of DECTE, iodine concentration of lesion (arrow) measured 2.5 mg·I/mL. Therefore, estimated CDAI with linear regression equation (CDAI = 53.549 × iodine concentration + 55.111) was 189.0, which was score for mild activity (CDAI: 150–219). Patient's real CDAI score was 164, which also indicated mildly active state of CD.
|
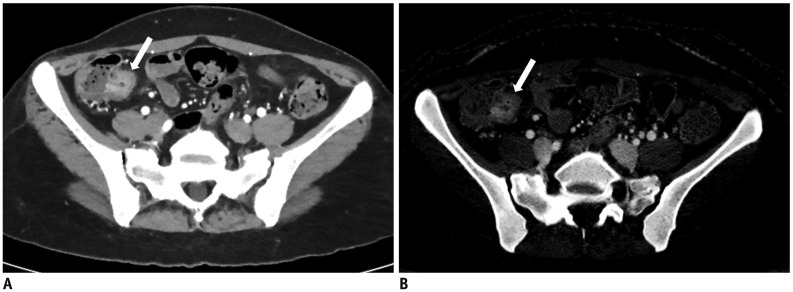
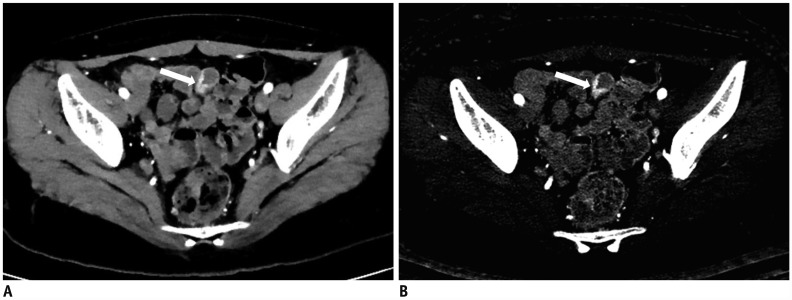 | Fig. 617-year-old female with known CD.
A. On DECTE enteric-phase image, focal enhancing and eccentric wall thickening (arrow) is clearly visible in distal ileum. Relative enhancement of this lesion was 310%. B. On iodine map of DECTE, iodine concentration of lesion (arrow) measured 3.3 mgI/mL. Therefore, estimated CDAI with linear regression equation (CDAI = 53.549 × iodine concentration + 55.111) was 231.8, which was score for moderate activity (CDAI: 220–450). Patient's real CDAI score was 262, which also indicated moderately active state of CD.
|
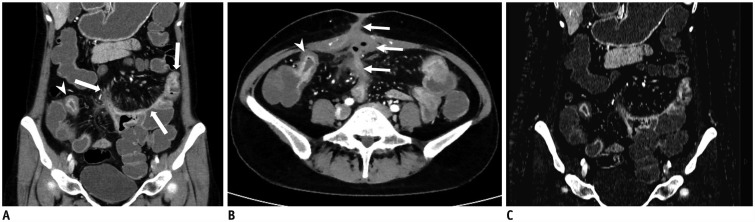 | Fig. 736-year-old female with known CD.
A, B. On coronal (A) and axial (B) images of DECTE obtained during enteric phase, multifocal, asymmetrically enhanced bowel wall thickenings (arrows) are prominently visible in ileum. Bilaminar pattern of enhancement (arrowheads) is also demonstrated on involved bowel. Note enterocutaneous fistula (thin arrows) between distal ileum and periumbilical area. Comb signs showing mild venous dilation (grade 2) and severe perienteric fat infiltration (grade 3) were also depicted. Relative enhancement of lesion showing strongest enhancement was 247%. C. On iodine map of DECTE, iodine concentration of involved bowel wall measured 4.7 mg·I/mL. Therefore, estimated CDAI with linear regression equation (CDAI = 53.549 × iodine concentration + 55.111) was 306.8, which was score for moderate activity (CDAI: 220–450). Patient's real CDAI score was 305, which also indicated moderately active state of CD.
|
Multiple Linear Regression Analysis
Multivariate linear regression analyses included the following variables: number of lesions, bowel wall thickness, pattern of bowel wall enhancement, degree of enhancement, mesenteric fat infiltration, comb sign, fistula, relative degree of enhancement, and iodine concentration. Among these variables, iodine concentration measured on the iodine map of spectral detector-based DECTE remained the sole independent variable associated with CDAI after adjustment for other confounders in multivariate analysis (p = 0.001). The linear regression equation for CDAI (y) and iodine concentration (x) was y = 53.549x + 55.111, with R2 = 0.726.
Validation Study
For 33 patients in the validation study, the mean CDAI score was 142.63 with a range of 6.63–399.39. Based on the real CDAI score, 20 (60.6%) patients were classified as the remission group, five (15.2%) as CD with mild activity, and eight (24.2%) as CD with moderate activity.
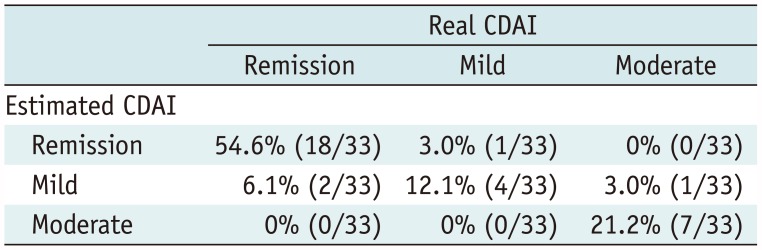
On DECTE, the mean iodine concentration of these patients was 1.95 mg·I/mL (range, 0.70–4.80). Using a linear regression equation of y = 53.549x + 55.111, the mean estimated CDAI score was 159.27 with a range of 92.60–312.15. There was a significant correlation (r = 0.925) between real and estimated CDAI scores (p < 0.001). These scoring methods had a mean measurement bias of −16.6 and limits of agreement ranging from −150.7 to 117.4 in the corresponding Bland-Altman analysis (Fig. 8). Based on the estimated CDAI score of the 33 patients, 19 (57.6%) were classified as the remission group, 7 (21.2%) as CD with mild activity, and 7 (21.2%) as CD with moderate activity. The concordance rate between the two scoring methods (real and estimated CDAI) for stratifying disease activity was 87.9% (29/33) (Table 5).
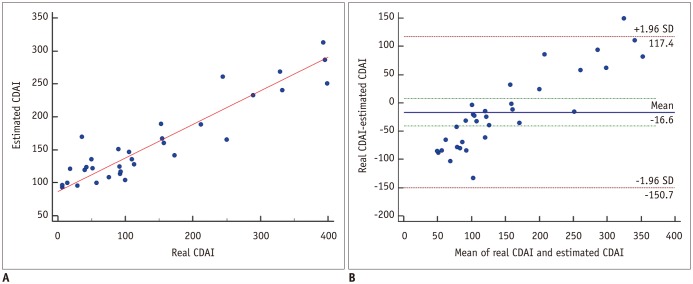 | Fig. 8Scatter-plots between real and estimated CDAI in 33 validation patients.
A. On Pearson's correlation test, there was significant correlation (r = 0.925) between real and estimated CDAI scores (p < 0.001). B. In Bland-Altman test, these scoring methods had mean measurement bias of −16.6 and limits of agreement ranging from −150.7 to 117.4.
|
Go to :
DISCUSSION
Our study found that the iodine concentration measured on the iodine map of spectral detector-based DECTE was the sole independent variable associated with CDAI; in addition, the linear regression equation for CDAI and iodine concentration was y = 53.549x + 55.111. This result was expected, because iodine concentration on DECTE provides indirect information regarding blood flow by quantifying the estimated contrast material distribution across the diseased bowel wall at a single point in time. However, contrary to expectations, the relative enhancement of diseased bowel wall calculated on conventional polychromatic images was not an independent variable associated with CDAI. We suspect that microscopic fat or hemorrhage in the diseased bowel may affect CT attenuation measurement by overestimation or underestimation of bowel wall enhancement. In addition, the direct quantification of iodine in the diseased bowel may overcome the inherent ambiguous nature of attenuation in CT imaging due to scanner technology, scanning methods, and reconstruction techniques (20252627). On the basis of our study results, we believe that an exact quantification of iodine concentration may be useful for the estimation of CD activity and guidance of disease management. Furthermore, the inter-reader agreement for the measurement of quantitative CT parameters was very good (correlation coefficient = 0.838), which suggests that iodine quantification is a reproducible method to predict CD activity (1928).
More importantly, we validated the usefulness of iodine concentration measured on DECTE by using a different dataset of 33 patients. We found that there was a significant correlation (r = 0.925) between real and estimated CDAI scores (p < 0.001). Furthermore, the concordance rate between the two scoring methods (real and estimated CDAI) for stratifying disease activity was 87.9% (29/33). Mis-stratification was found in four patients. Moreover, one patient with moderately active CD who should have been advised to undergo steroid therapy was incorrectly categorized as a mildly active patient, and therefore received an anti-inflammatory drug, such as 5-ASA.
Many other DECTE features were also significantly different between remission and active groups. Among them, the comb sign and subjective degree of enhancement showed a very low p value (p < 0.001) on chi-squared analysis. These two blood flow-related CT features were significantly different between remission and active groups because angiogenesis is closely and commonly related to CD activity. However, there was no significant correlation between the two clinical parameters of CDAI and CRP (p = 0.112). The insignificant correlation was not surprising, because CRP is an inaccurate measurement of mucosal inflammation and CRP expression is related to certain genetic polymorphisms in several diseases (293031).
This study quantified iodine concentration on a PACS monitor through networking between PACS and IQon server; therefore, there was no additional need for a separate standalone workstation for iodine quantification. This networking makes DECT application easy and clinically viable in daily routine practice. Another advantage of spectral detector-based DECT is the absence of requirements for upfront decision-making to perform DECT for spectral information. IQon spectral CT is the first and only CT scanner designed specifically for spectral detector-based imaging; therefore, upfront decision-making was not necessary to obtain spectral information, due to the ability to handle X-ray photons at the detector level.
Considering the chronic nature of CD and its peak age of 15–20 years, CTE might not be the best option for the surveillance of CD because of the required radiation exposure. Therefore, minimizing radiation dose is critically important. The mean CTDIvol (9.89 mGy) of the enteric phase in our study was smaller than that of previous DECT studies (14.2–15.0 mGy) and of previous single-energy CT studies (13.1–16.2 mGy) (32333435). We believe that such low radiation exposure in our study is mainly due to the unique hardware design of the dual-layer spectral CT scanner. To generalize this result, however, further studies regarding radiation doses should be performed by using a phantom on different DECT scanners.
Our study has several limitations. First, the number of patients in the study population was relatively small. Therefore, further studies with a larger sample size should be conducted to generalize the study results. Second, the study results might not be generalized to other DECT machines, due to the use of a specific DECT scanner (IQon Spectral CT). Thus, further comparative studies with different CT scanners are warranted to investigate the advantages and disadvantages of each setting. Third, histological confirmation was not performed in all patients. However, this limitation may not be serious, because CD is occasionally diagnosed with a combination of clinical, endoscopic, laboratory, and imaging findings. In addition, we thoroughly investigated the clinical, endoscopic, and laboratory findings to confirm the patients' final diagnosis. Fourth, we used CDAI as the reference standard. Therefore, we believe that our study results should be validated by using more robust references, such as CDEIS or simple endoscopic score-CD. Fifth, there is a potential limitation related to the interpretation of iodine quantification in DECT. Because we did not consider individual variances in physiologic factors, such as cardiac output or body mass index (19), further studies are strongly warranted to address this issue. Finally, we used a manual method for ROI analysis of the diseased bowel segments. However, automated or semi-automated segmentation and measurement for diseased bowels should be further developed to enhance the usefulness of iodine quantification, because manually applied ROIs for involved bowels can be vulnerable to inter-reader or intra-reader variabilities.
In conclusion, iodine concentration measured on spectral detector-based DECTE represents an accurate, convenient, and reproducible biomarker for monitoring disease activity in CD.
Go to :
 XML Download