

 PDF
PDF ePub
ePub Citation
 Print
Print


INTRODUCTION
In this era of rapid anticancer drug development, accurate tumor burden assessment is an essential component of clinical trials of both new drugs and routine anticancer treatments. Tumor burden, which is based on tumor size, is generally assessed on contrast-enhanced computed tomography (CT) images according to the Response Evaluation Criteria in Solid Tumors (RECIST) (12). RECIST 1.1 is essentially based on unidimensional assessment of the tumor burden on cross-sectional imaging modalities (2). However, size measurements might be inconsistent and are not always reproducible among different readers and in different measurement sessions (3).
Neuroendocrine tumors (NETs) are primarily hypervascular tumors that mainly metastasize to the liver (4). In several previous studies of NET liver metastasis, the hepatic arterial phase (AP) was considered the most relevant phase to visualize liver metastasis due to its strong arterial enhancement (56). Indeed, one study found that the hepatic AP revealed the greatest number of metastases of NETs (5). However, these liver metastases frequently exhibit peripheral rim enhancement in the AP or portal venous phase (PVP) of dynamic CT (78). This phenomenon might hinder precise and reliable tumor size measurement, and thus affect assessments of treatment response.
In general, pre-contrast CT images are not used for tumor size measurement for RECIST 1.1, mainly because the visual conspicuity of the tumor is lower in pre-contrast CT images when compared to AP or PVP images (5). However, if a tumor is clearly visualized on pre-contrast CT, the tumor size measurement is not affected by contrast enhancement (4). Therefore, we hypothesized that pre-contrast CT might facilitate reliable tumor measurement in patients with NET liver metastases. We aimed to compare pre- and post-contrast CT scans in terms of reliability in tumor size measurement.
MATERIALS AND METHODS
Our Institutional Review Board approved this retrospective observational study and waived the requirement for informed consent. We followed the Strengthening of the Reporting of Observational Studies in Epidemiology recommendations for the performance and reporting this study (9).
Patients
We performed a systematic computerized search of our hospital's data warehouse (Asan BiomedicaL research Environment) from January 2005 to December 2014. We used the pathological diagnosis search terms “neuroendocrine OR endocrine OR carcinoid” and the procedure codes for “liver biopsy” OR “hepatectomy.” Through our search strategy, we identified 101 patients with pathologically confirmed liver metastases of NETs. We then selected patients who met the following inclusion criteria: 1) pathologically confirmed liver metastases from NETs; 2) dynamic abdominal CT prior to any kind of treatment for liver metastases, including chemotherapy, surgery, radiofrequency ablation, or transarterial chemoembolization; and 3) the presence of measurable (tumor size > 1 cm in long diameter) metastatic lesions in the liver according to RECIST 1.1. Of these 101 patients, 57 were excluded for the following reasons: 52 did not undergo appropriate dynamic abdominal CT at our institution prior to treatment for liver metastasis, and five had no measurable lesions > 1 cm in diameter. Finally, 44 patients with 79 target lesions were included in this study.
Imaging Acquisition
All CT examinations were performed using a Somatom Sensation 16 (Siemens Healthineers, Erlangen, Germany), Somatom Definition (Siemens Healthineers), LightSpeed 16 (GE Healthcare; Milwaukee, WI, USA), or LightSpeed VCT (GE Healthcare) scanner. Dynamic CT scans comprising non-enhanced, arterial, and PVP images were obtained for all patients.
The scan parameters for the Somatom Sensation 16 and Definition scanners were as follows: beam collimation of 16 × 0.75 mm, and 64 × 0.6 mm, respectively; beam pitch of 1; gantry rotation time of 0.5 seconds; 120 kV; and automated dose modulation (CareDose 4D, Siemens Healthineers) using the maximum allowable tube current (200 mA). The scan parameters for the LightSpeed 16 and VCT scanners were as follows: beam collimation of 16 × 1.25 mm, and 64 × 0.625 mm, respectively; beam pitch of 0.984; gantry rotation time of 0.5 seconds; 120 kV; and automated dose modulation (automA and smartmA, GE Healthcare) primarily modulated based on a noise index of 12.81. The same scan settings were used for the different scan phases.
For dynamic multiphasic CT, 100–120 mL of iopromide (Ultravist 370 or Ultravist 300; Bayer Schering Pharma; Berlin, Germany) were administered intravenously at a rate of 3 mL/sec using an automatic power injector. Bolus tracking was used to determine the timing of the arterial and PVP. AP images were obtained with a 10-second delay on the Sensation 16 and LightSpeed 16 scanners and with a 15-second delay on the Somatom Definition and LightSpeed VCT scanners after aortic attenuation at the thoracolumbar junction had reached a pre-defined threshold of an increase of 100 Hounsfield units (HUs) above baseline, i.e., pre-contrast attenuation. PVP images were obtained using a fixed 75-second delay. Axial CT images were reconstructed with a section thickness of 2.5–5 mm.
Image Analysis
The study coordinator (a cancer imaging and abdominal radiology specialist with 9 years of clinical experience) anonymized the subjects' dynamic abdominal CT scans to ensure that the readers were blinded to the subjects' clinical information. Per RECIST 1.1, the study coordinator selected up to two target liver metastatic lesions and provided the target lesion information as thumbnail pictures to the readers to ensure target lesion consistency. In the target lesion selection process, the study coordinator selected the best-defined and most reproducibly measurable lesions on contrast-enhanced CT according to RECIST 1.1. He selected the target lesions without any preference for rim enhancement while being blinded to the pre-contrast CT findings.
Two readers with considerable experience with RECIST 1.1 in clinical trials (an abdominal radiologist with 8 years of clinical experience and an image analyst with 7 years of experience) participated in the tumor measurement process. On the basis of information regarding the predefined target lesions, both readers measured the unidimensional longest diameters of the target lesions on the pre-contrast phase, AP, and PVP CT images. Tumor sizes were measured using electronic calipers on a picture archiving and communication system (PACS). The readers repeated the tumor measurements twice, with a 4-week interval between the first and second measurement sessions to minimize recall bias. No annotation markers were left in the PACS between measurement sessions.
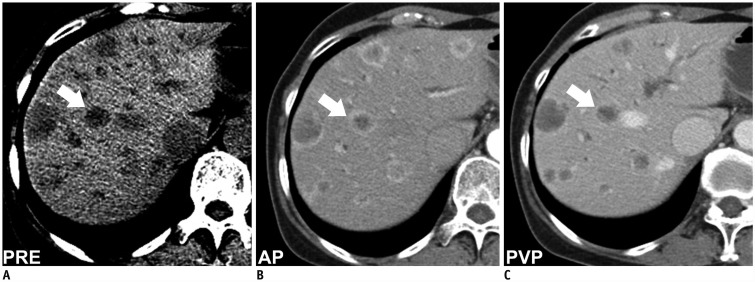
When there was a peripheral enhancing rim in the tumor, the readers were instructed to measure tumor size by including the peripheral enhancing rim. The peripheral enhancing rim was defined as an enhancing rim-like structure surrounding the tumor that had higher enhancement than the tumor center.
While measuring the tumor diameter in the pre-contrast phase, AP, and PVP, the readers were allowed to refer to the three phase images from the same study subject during the same measurement session. However, they were blinded to the results from the other measurement session and to each other's measurement results.
To evaluate CT image noise, we placed five regions of interest (ROIs) outside the subjects and measured CT values in HU in the ROIs. The mean standard deviation (SD) of the five ROIs was considered the CT image noise (10). The radiation doses of the CT scans were evaluated using the volume of the CT dose index (11).
Statistical Analysis
Mean and SD values were determined for all measurements. Repeated-measures analyses of variance (RMANOVAs) and post hoc tests with Bonferroni correction were used to compare the mean values of these measurements. For the RMANOVAs, the degrees of freedom were corrected using Greenhouse-Geisser estimates of sphericity.
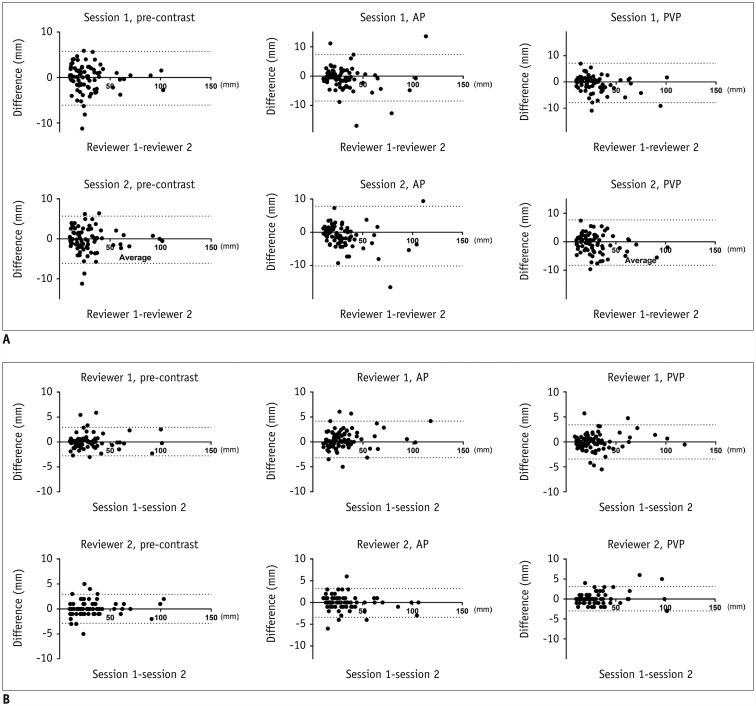
Inter-observer agreement and intra-observer agreement were evaluated using Bland-Altman plots with the mean difference and 95% limit of agreement (LOA) (12). Agreement between two measurements was visually assessed using Bland-Altman plots in which the differences were plotted against the average values of the two size measurements. The difference between two measurements was defined as M1–M2, where M1 = measurement 1 and M2 = measurement 2, and the mean difference was the average value of the differences between all tumors. The 95% LOA was the range of the mean difference ± 1.96 × SD of the mean difference. The RMANOVA and Bland-Altman plot calculations were performed using GraphPad Prism 7 (GraphPad Software, La Jolla, CA, USA).
The repeatability coefficient (RC) was calculated using a web-based calculator used to compute the RC for two repeated measurements of a continuous parameter (available at http://datasharing.aim-aicro.com/reliability), as described elsewhere (131415).
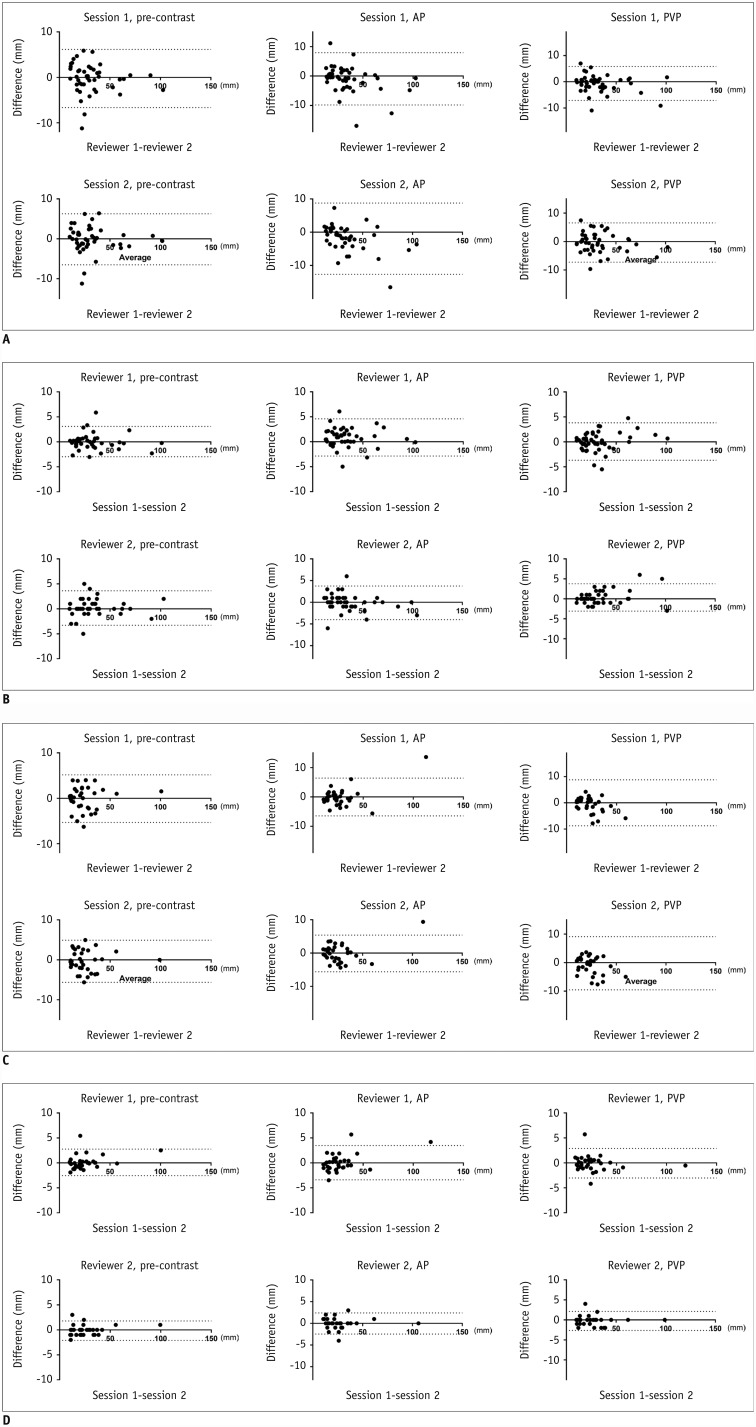
To identify the effects of peripheral rim enhancement of the target lesions on tumor measurements, we performed a subgroup analysis by dividing subjects into groups with and without peripheral rim enhancement.
RESULTS
Patients
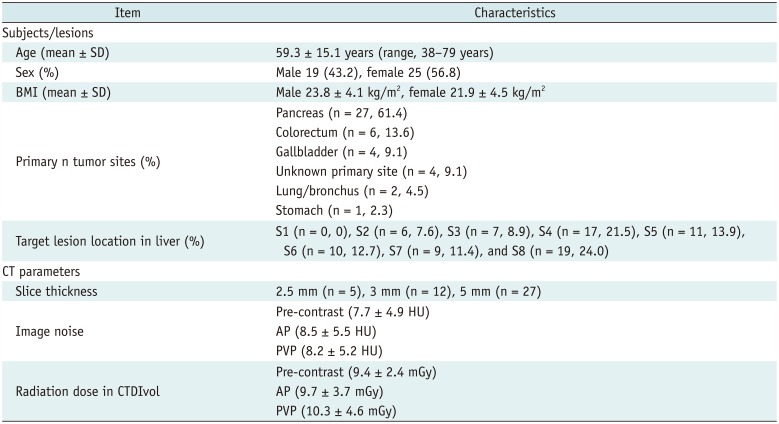
The characteristics of the study subjects and the CT parameters are summarized in Table 1. Of the 44 patients, 35 had multiple liver metastases and 9 had single liver metastases, yielding a total of 79 target lesions. Peripheral rim enhancement was independently observed in 45 of the 79 (56.9%) lesions by reader 1 and in 42 of the 79 (53.1%) lesions by reader 2. The study coordinator reviewed the discrepant cases and confirmed that there were 45 (56.9%) lesions with peripheral rim enhancement. In all of these cases, peripheral rim enhancement was more prominent in AP images than in PVP images. Of the 79 target lesions, six target lesions (7.6%) with a mean tumor size of 28.3 mm on the pre-contrast images were subtle on pre-contrast CT, as assessed by both readers.
Tumor Size Measurement
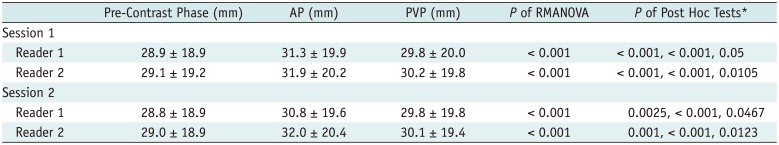
The mean diameters of the target lesions measured by readers 1 and 2 during the first and second measurement sessions, and the resulting inter- and intra-observer mean differences and 95% LOAs are summarized in Tables 2 and 3, respectively. The mean tumor diameters measured by readers 1 and 2 were the largest in the AP (31.3 mm and 31.9 mm, respectively, in session 1; and 30.8 mm and 32.0 mm, respectively, in session 2), followed by the PVP (29.8 mm and 30.2 mm, respectively, in session 1; and 29.8 mm and 30.1 mm, respectively, in session 2) and the pre-contrast phase (28.9 mm and 29.1 mm, respectively, in session 1; and 28.8 mm and 29.0 mm, respectively, in session 2).
Inter-Observer and Intra-Observer Agreement
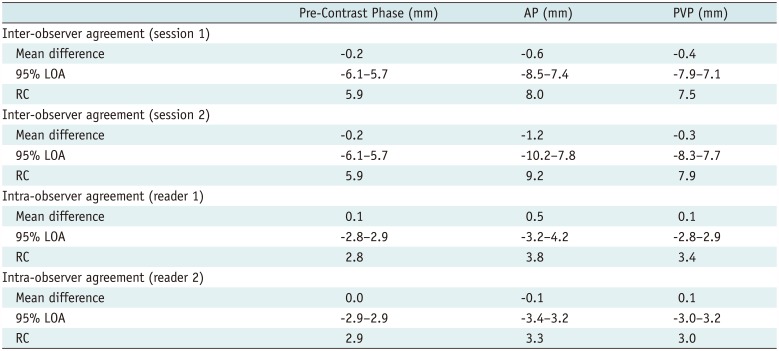
Table 3 and Figure 1 present Bland-Altman analysis results and plots. RCs are also presented in Table 3. Pre-contrast CT yielded the best inter-observer agreement, as assessed using 95% LOAs, in both the first and second measurement sessions (−6.1–5.7 mm in both sessions). This was followed by the PVP (−7.9–7.1 mm and −8.3–7.7 mm, respectively) and AP (−8.5–7.4 mm and −10.2–7.8 mm, respectively). Pre-contrast CT also yielded the best intra-observer agreement, as assessed using 95% LOAs, for both readers 1 and 2 (−2.8–2.9 mm and −2.9–2.9 mm, respectively). This was followed by the PVP (−2.8–2.9 mm and −3.0–3.2 mm, respectively) and the AP (−3.2–4.2 mm and −3.4–3.2 mm, respectively). In all CT phases, intra-observer agreement was better than inter-observer agreement for both readers.
Subgroup Analysis
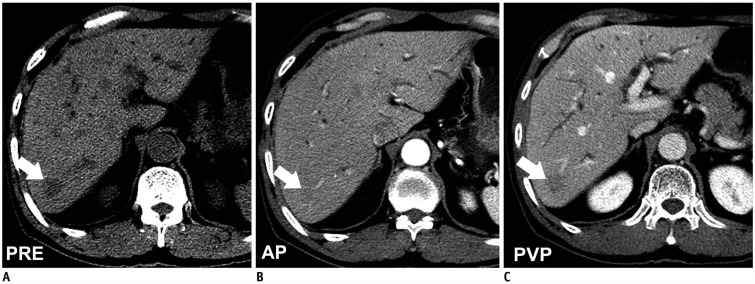
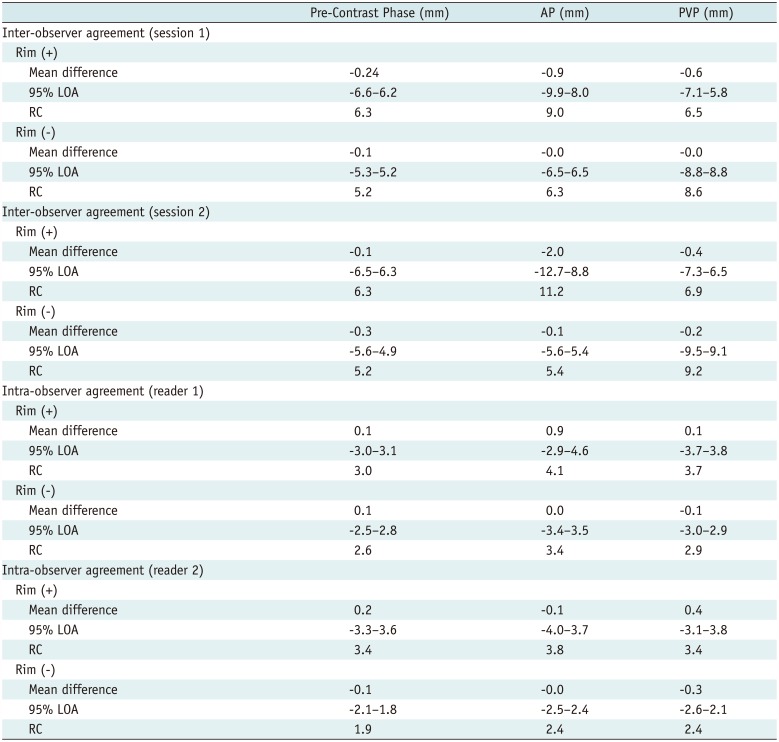
A subgroup analysis based on the presence of peripheral rim enhancement on target lesions revealed that ratings of tumors lacking rim enhancement exhibited better inter-observer and intra-observer agreement when compared to those of tumors with peripheral rim enhancement (Table 4, Fig. 2). This tendency was obvious in the AP and PVP rather than in the pre-contrast phase. These results indicate that peripheral rim enhancement in AP and PVP images may frequently obscure the tumor margin and thus increase inter-observer and intra-observer variability (Fig. 3). However, even in tumors without peripheral rim enhancement, inter-observer agreement and intra-observer agreement were better in pre-contrast images than in AP and PVP images (Fig. 4).
DISCUSSION
We began our study with the hypothesis that pre-contrast CT might facilitate reliable tumor measurement. Our results demonstrate that the measured tumor size varied with the CT phase and that pre-contrast CT yielded the best inter-observer and intra-observer agreements, thus supporting our hypothesis.
CT is primarily used to detect, characterize, and measure hepatic metastases of NETs, as reported in a recent study (4). When performing tumor response assessments with RECIST 1.1, consistent tumor size measurements may be the most important issue. Our study results indicate that pre-contrast CT may be the most reliable phase for tumor size measurement in lesions with good conspicuity on pre-contrast images.
It is important to note the advantages and drawbacks of pre-contrast imaging of NET liver metastases. We postulated that one advantage of pre-contrast imaging to AP or PVP imaging would be the ability to clearly visualize the boundary between a liver metastasis and the adjacent liver parenchyma, wherein the tumor periphery is sometimes obscured by rim enhancement. The readers experienced difficulty drawing clear margins on all tumors with peripheral rim enhancement. Accordingly, our subgroup analysis revealed poorer inter-observer and intra-observer agreement in tumors with peripheral rim enhancement when compared to those without this feature, especially on the AP.
Only one prior study has investigated observer agreement in patients with NET liver metastases (4). The authors of that study explored the effects of various magnetic resonance (MR) sequences on the size measurements of NET liver metastases. In that study, contrast-enhanced MR images in the AP obtained 60 and 120 seconds after the injection of Gd-ethoxybenzyl diethylenetriamine pentaacetic acid (Primovist or Eovist, Bayer AG, Berlin, Germany) frequently exhibited blurred tumor margins that hindered accurate tumor size measurements and reduced inter-observer/intra-observer agreement. In contrast, the 20-minute delayed phase (i.e., hepatobiliary phase) displayed clear tumor margins and was the best sequence for reliable tumor size measurement (4). These prior study results obtained using MR imaging are concordant with those of our study, which were obtained using CT.
One disadvantage of using pre-contrast CT for tumor size measurement is that the liver metastasis detection rate is generally lower when using pre-contrast CT than when using contrast-enhanced CT (516). In our study, the readers identified target lesions on pre-contrast CT with the aid of AP and PVP CT images. Six of the 79 target lesions (7.6%), which had a mean tumor size of 28.3 mm, were subtle on pre-contrast CT. In such cases, readers should adjust the window level and width setting to identify the tumor margin. Without referring to contrast-enhanced CT images, however, the diagnostic confidence to distinguish the tumor on pre-contrast CT alone might be low. Therefore, pre-contrast CT alone cannot be used for tumor size measurements or treatment response assessments.
Currently, the RECIST 1.1 criteria emphasize the importance of intravenous contrast injection and define contrast injection as a mandatory process (217). RECIST 1.1 recommends using multiphasic (at least triphasic) CT scans, especially for the assessment of NETs. We generally agree with these recommendations. However, it should be noted that the enhancement patterns and morphologies of hypervascular liver metastases from NETs may vary based on the contrast injection protocol and scan timing (46818). The original description of RECIST 1.1 did not describe the manner in which peripheral enhancing rims should be measured. Although review papers generally suggest that peripheral enhancing rims should be included in the tumor size measurements (817), our study results indicate that peripheral rim enhancement is a source of inter-observer and intra-observer variability in patients with NET liver metastases. In our study, the average tumor size was approximately 3 cm. In this setting, if there is only one target lesion, an increase in size of only 6 mm would lead to exceeding the 20% cut-off for tumor progression. Considering the RCs of inter-observer agreement (5.9 mm for pre-contrast CT, 8.0–9.2 mm for AP, and 7.5–7.9 mm for PVP), the measurement variability derived from the peripheral enhancing rim may change the RECIST response criteria.
On the basis of our observations, we propose that pre-contrast CT might be a good option to decrease variability of tumor size measurement. However, it might be helpful only when the lesion has good conspicuity on pre-contrast images. Further validation to incorporate tumor size measurement on pre-contrast images into the RECIST 1.1 guidelines is required.
Our study had limitations. One of the limitations of our study was its retrospective nature. We controlled the target lesions used for tumor size measurements in our study, which may have led to overestimation of inter-observer/intra-observer agreement. However, as our study aimed to evaluate the influence of peripheral rim enhancement on tumor size measurement, we were required to predefine the target lesions. In this study, the target lesions were selected by a study coordinator according to RECIST 1.1 criteria without any preference to peripheral rim enhancement. In real practice, observer variability might derive from differences in selected measurable target lesions or image slices, as well as differences in caliper placement on the target lesion. Second, two readers measured the tumor size twice 4 weeks apart without randomization of case order. This might have introduced bias due to the readers' memory. Third, we used various CT scanners with different CT parameters. This might have influenced lesion conspicuity. Fourth, this study was conducted in a retrospective manner in a relatively small number of patients. A large-scale prospective validation study is thus warranted.
In conclusion, inter-observer agreement and intra-observer agreement for size measurements of NET liver metastases on CT were better on pre-contrast scans than on AP or PVP scans. Pre-contrast CT may be the optimal phase for measuring NET liver metastases with good conspicuity if the accuracy of this approach is proven.
 XML Download