

 PDF
PDF ePub
ePub Citation
 Print
Print


INTRODUCTION
Radiofrequency ablation (RFA) has been widely used for the treatment of hepatocellular carcinomas (HCCs) as well as liver metastases from colorectal cancer, breast cancer, and pancreatic neuroendocrine tumors (12). RFA has demonstrated overall survival comparable to that of surgery in patients with early HCCs, and RFA is also more cost-effective (34). However, controversy remains as to whether RFA can be considered a primary therapeutic option for HCC with curative intent, especially in patients with maintained liver function (4). This controversy is mainly owing to its high rate of local tumor progression (LTP) relative to surgery, varying from 10% to 39.1% within 5 years depending on the tumor type, size, and number of tumors (56). Indeed, previous studies have demonstrated that tumor size (> 3 cm) and minimal ablation margins of < 2–5 mm were independent predictors of LTP after RFA for liver malignancies (7891011). To this end, many efforts have been made to reduce the LTP rate after RFA in patients with HCCs, aiming to achieve a satisfactorily sufficient three-dimensional (3D) safety margin around the index tumor. These include the use of more efficient thermal ablation devices such as microwave antennas or multiple RF electrodes (121314). Additionally, increased precision in the evaluation of safety margins has been explored, with second-look RFA used in patients with insufficient margins (67810).
Currently, the assessment of the ablative margin around the index tumor after RFA is usually performed through visual inspection of immediate follow-up computed tomography (CT) and pre-RFA imaging data (715). However, visual inspection is not always as effective as it could be, as ablation can result in anatomical deformation in surrounding tissues (8), and respiration can induce deformation of the liver (16). If the pre-RFA imaging modality was magnetic resonance imaging (MRI), visual assessment of the ablation margin on post-RFA CT can be even more challenging, as MRI is acquired during inspiration whereas CT is usually acquired during expiration. Furthermore, differences in spatial resolution between CT and MRI as well as different arm positions could further complicate accurate assessment (17). Several recent studies already demonstrated that the addition of follow-up registration of CT images before and after RFA using registration software resulted in the significantly improved assessment of safety margins and reduced LTP of HCCs after RFA (1116). However, recent studies demonstrated that MRI using hepatocyte-specific contrast agents has demonstrated higher sensitivity in the detection of small HCCs compared to multidetector CT and has become more widely used for the diagnosis and staging of HCC (1819). Thus, in clinical practice, it is becoming more common for ablationists to encounter cases in which the depiction of small (< 2 cm) HCCs is only available on MRI in patients referred for RFA. Therefore, it would be of clinical value if the spatial alignment of pre- and post-RFA images could be provided in patients with pre-RFA MRI. Previous reports have already introduced CT and MR registration for RFA using software (2021), but none have prospectively compared the value of ablative margin assessment using this software with conventional visual inspection on long-term outcomes.
Therefore, the purpose of this study is to evaluate the clinical impact of software-assisted ablative margin assessment using registration of different pre- and post-RFA modalities compared with the conventional method of side-by-side MR-CT comparison in patients with HCCs.
Go to : 
MATERIALS AND METHODS
For our study, an employee of Siemens Healthcare provided technical support for software implementation. However, authors not associated with Siemens Healthcare maintained full control of the data at all times.
This prospective study was approved by our Institutional Review Board, and informed consent was obtained from all patients. The eligibility criteria were as follows: 1) patients (≥ 18 years) who were referred to our radiology department for liver tumor RFA, 2) patients who had liver MR images of sufficient quality for pre-RFA evaluation within 30 days of RFA, and 3) patients with 1–3 tumors (< 5 cm). We excluded patients who had the following: 1) Child-Pugh class C, 2) any uncorrected coagulopathy, and 3) hypersensitivity to iodine or other reasons that prevented the performance of post-RFA contrast-enhanced CT. From October 2010 to September 2011, 77 consecutive patients with 99 liver tumors (HCC [n = 88], cholangiocarcinoma [n = 1], metastases [n = 10]) who had undergone liver MRI before RFA were enrolled. Among them, 68 patients with 88 HCCs (male:female = 55:13; mean age 63.2 ± 9.5 years; age range, 39–87 years) were included in this analysis. HCC was diagnosed according to American Association for the Study of Liver Diseases guidelines (22) or the Liver Imaging-Reporting and Data System if gadoxetic acid-enhanced MRI was used (23).
Average index tumor size was 1.6 ± 0.6 cm (range, 0.6–3.2 cm). Prior to the procedure, tumor locations were identified according to Couinaud segment, depth from the surface (central or peripheral, defined as the tumor's lateral border being located within 10 mm of the capsule), and the relative level of the tumor with respect to the portal hilum (higher than the hilum, at the hilar level, and below the hilum). In addition, the presence of landmarks around the tumor (vessels or benign hepatic lesions such as cysts) was recorded. Index tumors were classified as treatment-naïve (1.7 ± 0.7 cm; range, 1.0–3.2 cm) or treatment-refractory (1.4 ± 0.7 cm; range, 0.6–2.2 cm), with recurrence indicating local progression after variable local treatment of that tumor. Treatment-refractory tumor size was measured in a presumed viable enhancing portion on arterial phase images, according to modified Response Evaluation Criteria in Solid Tumors (mRECIST) assessment for HCC (24). Detailed characteristics of the patients are summarized in Table 1.
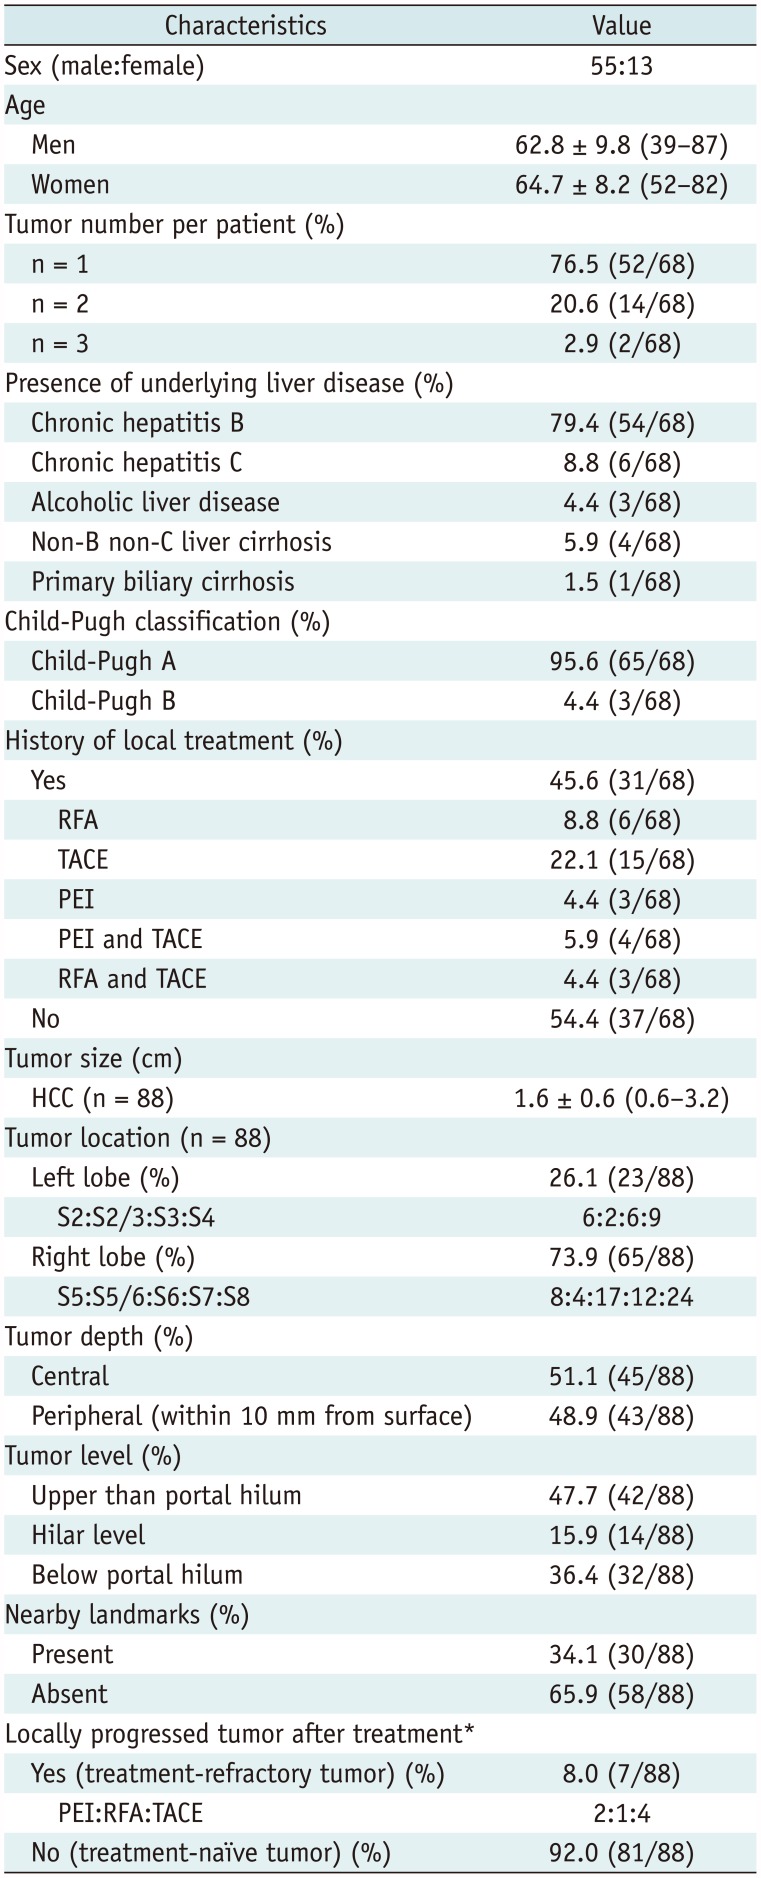
Table 1
Characteristics of 68 Patients with 88 HCCs
![]()
Pre-RFA MRI Acquisition
In 68 patients with HCC, gadoxetic acid-enhanced liver MRI was performed at 1.5T (n = 31; Signa HDxt, GE Healthcare, Milwaukee, WI, USA) or 3T (n = 37; Magnetom Verio and Magnetom Trio, Siemens Healthcare, Erlangen, Germany). Routine MR sequences consisted of a heavily T2-weighted image (T2WI), fat-suppressed T2WI, dual echo images, diffusion-weighted image, precontrast T1-weighted image (T1WI), and post-contrast T1WI including arterial, portal, transitional, and hepatobiliary phases using 3D gradient echo sequence. The hepatobiliary phase obtained 20 minutes after contrast media administration was used for fusion with post-RFA CT images, as it provided excellent contrast between the tumor, vessel, and liver parenchyma. Scan parameters of the hepatobiliary phase were as follows: at 1.5T, repitition time/echo time (TR/TE) = 4.6/2.2 msec; flip angle = 12°; 64–72 partitions with a partition thickness of 2.5–3 mm; no interslice gap; field of view = 350 × 350; matrix 320 × 224; parallel imaging reduction factor of two; and number of excitations = 0.7. At 3T, TR/TE = 3.6/1.3 msec; flip angle = 11°; 64–72 partitions with a partition thickness of 3 mm; no interslice gap; field of view = 380 × 310; matrix 384 × 250; parallel imaging reduction factor of two; number of excitations = 1.0.
RFA
Radiofrequency ablation sessions were performed by one operator who had 17 years of experience in liver tumor RFA. Conscious sedation was induced using an intravenous injection of fentanyl (50–200 µg), midazolam (2–5 mg), and ketamine (1.5 mg/kg). After identifying index tumors on ultrasound, RFA was performed under ultrasound guidance and monitoring. A multi-channel generator system with three channels and three RF generators (VIVA multi RF Generator, Starmed Co. Ltd., Goyang, Korea) was used for all patients. Internally cooled tip electrodes (Well-point, Starmed Co., Ltd. [n = 61], Octopus, Starmed Co., Ltd. [n = 5], and Cool-tip, Covidien, Mansfield, MA, USA [n = 2]) with a 2 cm (n = 29) or 3 cm (n = 39) active tip were used depending on the index tumor size and location. One to three needles were used for ablation (one [n = 2], two [n = 15], and three [n = 51]), and the overlapping technique or multiple applications of RF energy with multiple electrodes were performed if necessary, especially for tumors larger than 2 cm, in order to create a sufficient safety margin. Mean ablation time was 17.2 ± 10.5 minutes (range, 6–60 minutes) and mean delivered energy was 7.8 ± 6.6 kcal (range, 1.4–34.2 kcal). Artificial ascites was used in 29.4% (20/68) of patients to avoid adjacent organ injury or to improve visualization of the index tumor (25). During the procedure, the vital signs of patients including blood pressure, cardiac rhythm, cardiac beat, respiratory rate, and oxygen saturation were continuously monitored and recorded.
Post-RFA CT Acquisition
After RFA, patients were referred to the CT unit located next to the RFA unit and underwent contrast-enhanced CT at a 16-channel scanner (Somatom Sensation 16, Siemens Healthcare, Forchheim, Germany). Arterial and portal venous phases were obtained after intravenous contrast media injection (1.5 mL/kg; iopromide, Ultravist 370, Bayer Healthcare, Berlin, Germany). Contrast media was injected for 30 seconds followed by a 30–40 mL saline chaser. The arterial phase was obtained 19 seconds after attenuation of the descending aorta reached 100 HU, and the portal venous phase was scanned 70 seconds after contrast media injection. The scanning parameters were 120 kVp, 200 mAs, 16 × 0.75 section collimation, 0.5 second gantry rotation time and a pitch of 1.0. 3 mm slices were reconstructed with 1 mm overlap, a matrix size of 512 × 512, and a 35 cm field of view. For software-based image registration, the portal venous phase was used.
Immediate Technical Success Assessment
Immediate technical success assessment was performed using both visual assessment and software-assisted assessment on the same day as the RFA procedure in accordance with routine procedure in our institution. The technique success of RFAs was defined as complete coverage of the index tumor with a non-enhancing area on the portal phase of immediate post-RFA CT, according to the standardized terminology of the International Working Group on Image-Guided Tumor Ablation (26). Post-RFA CT was used to assess the immediate treatment success of the RFA procedure. The ablative margin was scored on a four-point scale for visual assessment and for fusion imaging analysis as follows (1116): score 1, presence of gross residual tumor; score 2, ablation zone without gross residual tumor and an ablative margin < 3 mm; score 3, ablation zone without gross residual tumor and an ablative margin ≤ 3 mm to < 5 mm (borderline ablation); and score 4, ablation zone with an ablative margin ≥ 5 mm (complete ablation). Scores of 1 and 2 were regarded as an insufficient ablative margin (< 3 mm) while scores of 3 and 4 were regarded as a sufficient ablative margin (≥ 3 mm) in all tumors except subcapsular tumors. The ablative margin of tumors with adjacent portal or hepatic veins was also evaluated in the same manner. For tumors in the subcapsular location (27), an ablative margin on the capsular side was regarded as a complete ablative margin because there was no sufficient intervening parenchyma. Visual assessment was performed and scored by the operator and one assistant (board-certified abdominal radiologist in fellowship training) in consensus after post-RFA CT acquisition.
Thereafter, the portal venous phase of post-RFA CT and the hepatobiliary phase of pre-RFA MRI were registered for additional assessment of immediate treatment success of the procedure using dedicated liver registration software (Hepacare, Siemens Healthcare). Details regarding the registration procedure are as described in a previous study (16). In brief, first, Digital Imaging and Communications in Medicine files were transferred to a 3D workstation (Leonardo; Siemens Healthcare) with the registration software. Then, the hepatobiliary phase images of pre-RFA MRI and portal venous phase images of post-RFA CT were registered using a non-rigid registration technique guided by landmark-based constraints selected on the segmental or subsegmental level of the portal or hepatic vein on both MR and CT images. After registration, MR and CT images were anatomically synchronized. The non-rigid registration technique allowed the portal phase CT to be deformed to that of pre-RFA MRI in order to accommodate the complex deformation of the shape of the liver related to different phases of respiration (16). The appropriateness of the registration was assessed by board-certified radiologists, and the registration process was repeated using different landmarks when pre- and post-RFA images were not matched; the registration process took less than 20 seconds after selecting landmarks. After registration, a region of interest (ROI) was drawn around the index tumor on the hepatobiliary phase at pre-RFA MRI, and the tumor outline was automatically extended by a “virtual sufficient ablative zone” of 5 mm on the portal venous phase at post-RFA CT (Fig. 1). Finally, the radiologist assessed the ablative margin around the index tumor in a similar manner to visual assessment on the fusion image and checked whether the extended ROI including the index tumor was within the non-enhancing ablative zone. The results of registration software-assisted assessment were immediately open to the operator to determine the need for second-round RFA.
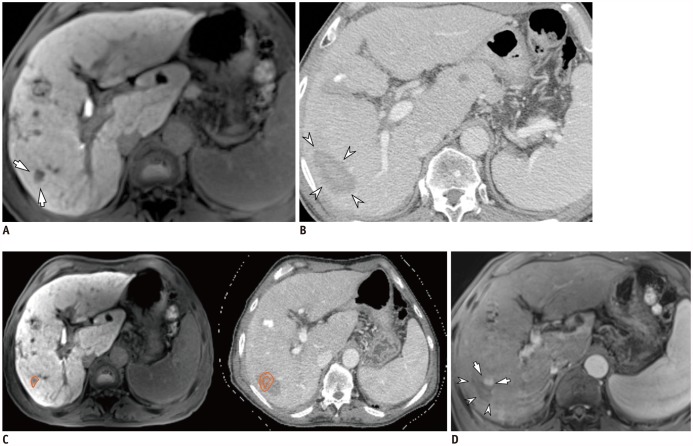 | Fig. 169-year-old man with HCC and hepatitis C-related cirrhosis showing discrepancy between two inspection methods.
A. On hepatobiliary phase, 12-mm HCC was seen in S6 (arrows). B. On portal venous phase of post-RFA CT, 52-mm ablative zone was observed in corresponding area (arrowheads). Ablative margin was considered to be sufficient on visual inspection. C. After non-rigid, deformable registration of pre-RFA MRI (left) and post-RFA CT (right) using software, ROI was drawn around index tumor manually on pre-RFA MRI (left, orange circle), and ROI was simultaneously copied on post-RFA CT (right, inner circle) with 5-mm ablative margin (right, outer circle). In software-assisted inspection, ablative margin was determined to be insufficient. However, second-look RFA did not proceed due to unstable vital signs under conscious sedation. D. On ten-month follow-up MRI, LTP (arrows) was observed along mediosuperior margin of ablative zone (arrowheads), and was considered insufficient on software-assisted inspection. CT = computed tomography, HCC = hepatocellular carcinoma, LTP = local tumor progression, MRI = magnetic resonance imaging, RFA = radiofrequency ablation, ROI = region of interest
|
Follow-Up after Treatment
After initial technical success assessment at immediate follow-up CT, patients who showed a residual tumor (score 1) or an insufficient ablative margin < 3 mm (score 2) on at least one assessment were considered to have an indication for a second-look RFA. If RFA was not repeated in these patients, the reasons for this and the information regarding the performance of additional treatment including resection, percutaneous ethanol injection, or transarterial chemoembolization (TACE) were recorded. Technique efficacy of RFA including second-look treatment was determined based on whether complete ablation of the index tumor was achieved on contrast-enhanced CT or MRI one month after treatment (30 days) (1526).
Statistical Analysis
Unweighted kappa (k) values were obtained to evaluate the degree of agreement between visual assessment and registration software (κ = 0, no agreement; 0–0.20, slight agreement; 0.2–0.4, fair; 0.4–0.6, moderate; 0.6–0.8, substantial; 0.8–1, excellent) (28). Statistical differences in demographics, characteristic features of tumors, and complication rates between the two groups were determined using the Student t test and chi-square test. Comparison of the cumulative incidences of LTP between the sufficient margin group and insufficient margin group according to visual inspection or registration software was made using Kaplan-Meier analysis. Patients who underwent surgical resection or transplantation before LTP development were censored from LTP evaluation on the operation day.
Cox proportional hazards regression was performed to identify parameters associated with LTP. All parameters showing a p value ≤ 0.2 on univariate analysis were included in multivariate analysis using Cox proportional hazard regression analysis in a stepwise manner. A p value < 0.05 was considered to indicate a statistically significant difference. Commercially available software (SPSS version 21, IBM Corp., Armonk, NY, USA; Medcalc version 12, Medcalc Software, Mariakerke, Belgium) was used to analyze all data.
Go to :
RESULTS
Initial Technical Success of RFA Assessment Using both Inspection Methods
All tumors (n = 88) of the 68 patients were prospectively evaluated by both visual and software-assisted inspection, and there were no cases of registration failure. According to conventional visual assessment, 84.1% of tumors (74/88) were assessed as having a sufficient ablative margin (score ≥ 3). With software-assisted inspection, 80.7% of tumors (71/88) were classified as having been treated with sufficient ablative margins (score ≥ 3). The two methods of inspection showed 85.2% (75/88) concordance in estimating sufficient ablative margins at initial evaluation, indicating a discrepancy in 14.8% (13/88) of tumors. The unweighted kappa was 0.26 (95% confidence interval: −0.04, 0.56) between the two methods. Tumors located above the hilum showed a higher incidence of discordance between the two inspection methods than tumors at the hilar level or below (23.8% [10/42] vs. 6.5% [3/46], p = 0.047). However, tumor depth from the capsule (central vs. peripheral), Couinaud segment, and presence of adjacent landmarks were not significantly different between the concordant and discordant groups (Table 2).
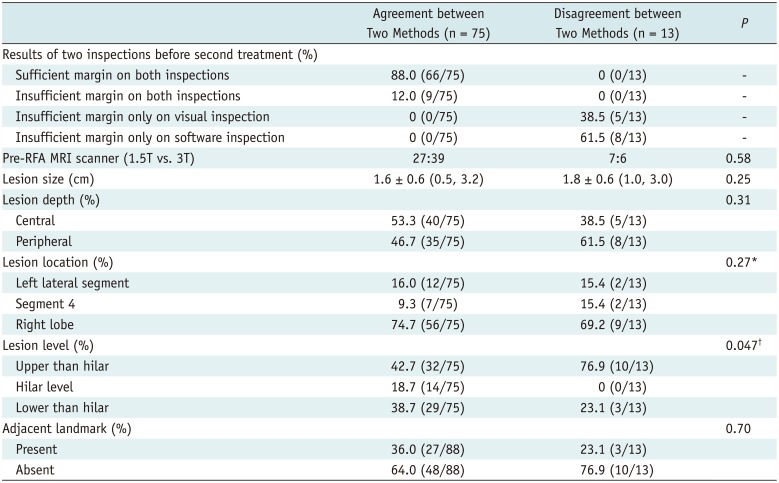
Table 2
Per Nodule Comparison of Assessed Ablation Zones between Concordant and Discordant Groups Using Visual and Software-Assisted Initial Inspection in 88 HCCs
![]()
Follow-Up Treatment in Patients with Insufficient Ablative Margins
Twenty-one patients showed insufficient ablative margins (score ≤ 2) in 22 tumors in at least one inspection (Fig. 2). Those 21 patients with 22 tumors were indicated for second-look RFA. Among them, there were six patients with score 1 (residual tumor) and three tumors (13.6%, 3/22) in three patients who showed insufficient ablative margins in both examinations. Five patients with residual tumor underwent second-look RFA on the same day, including one patient who had two tumors with a residual tumor on both inspection and an insufficient ablative margin on software-assisted inspection, only the residual tumor was treated with second-look RFA due to a concern of thoracic injury were the other tumor treated. In the remaining 16 tumors (72.7%, 16/22) of 16 patients, second-look RFA was not performed for the following reasons: 1) nearby hepatic vessels (n = 6), 2) concerns of thoracic or cardiac injury (n = 5), 3) concerns of central bile duct injury (n = 2), 4) patients' intolerance to additional RFA or unstable vital signs for additional conscious sedation (n = 2), and 5) concerns of gallbladder perforation (n = 1). For these patients, TACE or close follow-up was recommended instead given the condition of the patients. One patient with residual tumor underwent immediate TACE on the day following RFA, and the remaining 15 patients were followed-up without immediate additional treatment as decided by physicians. For the five patients who underwent second-look RFA, re-assessment revealed that all treated lesions showed sufficient ablative margins on both visual assessment and registration software-assisted assessment. The patient who received immediate TACE showed compact lipiodol uptake on immediate post-TACE non-contrast CT assessed according to our institutional protocol, and did not show viable tumor on one-month follow-up contrast-enhanced CT according to mRECIST criteria (24). The patient was classified as having a sufficient ablative margin in both visual and software-assisted assessments.
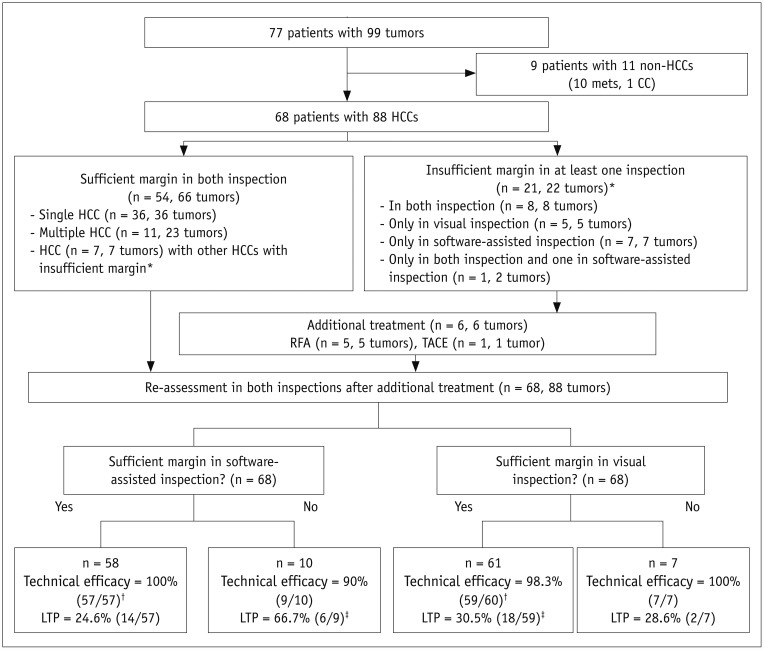 | Fig. 2Flow chart of study.
*These seven patients were included in both groups due to presence of sufficient and insufficient ablative margins for multiple tumors, †One patient was excluded due to follow-up loss before one-month follow-up CT scan for confirming technical efficacy, ‡One patient was excluded due to failure of achieving technical efficacy on one-month follow-up CT scan. n = number of patients, TACE = transarterial chemoembolization
|
Technique Efficacy of RFA
One patient (1.5%, 1/68) was lost to follow-up without cross-sectional imaging. The remaining 67 patients (98.5%, 67/68) underwent one-month follow-up contrast-enhanced CT or MRI (median interval, 28 days; range, 23–37 days). Among them, one patient's (1/67, 1.5%) examination revealed a viable tumor on the edge of the ablative margin at one-month follow-up CT, and the others (66/67, 98.5%) did not show any evidence of residual viable tumor. The patient with viable tumor at one-month follow-up CT showed an insufficient ablative margin only on the registration software-assisted inspection but not on visual assessment at immediate follow-up CT after RFA.
LTP after RFA
Median follow-up interval was 48.0 months (range 0.9–72.6 months). During the follow-up period, LTP developed in 30.3% (20/66) of 66 patients with technique efficacy. The cumulative incidence of LTP was estimated as 7.9%, 21.1%, 28.6%, 30.5%, and 32.9% at 1-, 2-, 3-, 4-, and 5-year follow-up, respectively (Fig. 3). Specifically for treatment-naïve tumors, the LTP rate was 25.4% (15/59) and was 71.4% (5/7) for treatment-refractory tumors (p = 0.002). The estimated cumulative incidence of LTP in patients with treatment-naïve tumors (n = 59) at 1-, 2-, 3-, 4-, and 5-year follow-up was 7.2%, 16.4%, 22.6%, 24.7%, and 27.2%, respectively (Fig. 3).
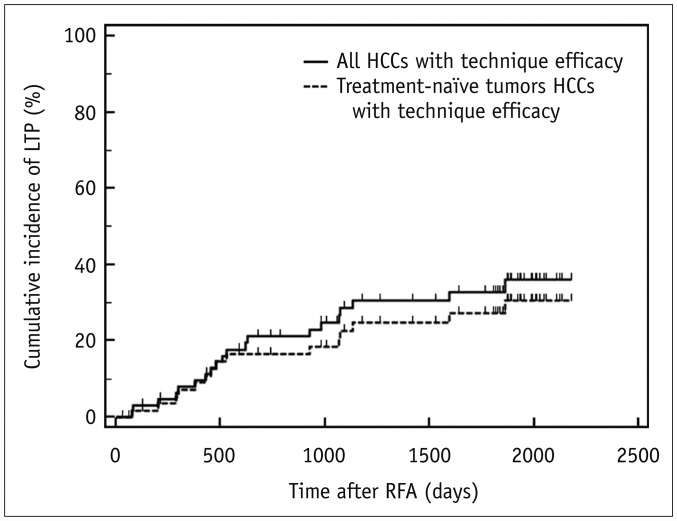 | Fig. 3Cumulative incidence of LTP in all tumors and treatment-naïve tumors with technique efficacy.Cumulative incidence of LTP was estimated as 7.9%, 28.6%, and 32.5% at 1-, 3-, and 5-year follow-up, respectively, in all 66 patients (solid line), and 7.2%, 22.6%, and 27.2% at 1-, 3-, and 5-year follow-up, respectively, in 59 patients with treatment-naïve tumors (dotted line).
|
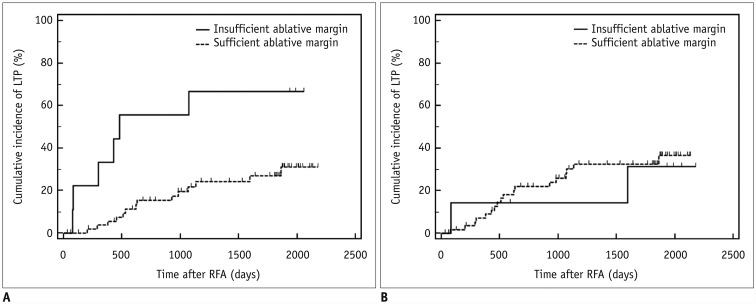
Patients with sufficient ablative margins on software-assisted inspection showed a significantly lower cumulative incidence of LTP than patients with insufficient ablative margins (66.7% [6/9] vs. 24.6% [14/57], p = 0.004). The estimated cumulative incidence of LTP after software inspection was 3.7%, 15.3%, 21.9%, 24.2%, and 27.0% in patients with sufficient margins and 33.3%, 55.6%, 66.7%, 66.7%, and 66.7% in patients with insufficient margins at 1-, 2-, 3-, 4-, and 5-year follow-up, respectively (Fig. 4A). On visual assessment, however, no significant differences were observed in cumulative LTP rates between patients with insufficient ablative margins and those with sufficient ablative margins in all patients (28.6% [2/7] vs. 30.5% [18/59], p = 0.79) (Fig. 4B) and in patients with treatment-naïve tumors (16.7% [1/6] vs. 26.4% [14/53], p = 0.47).
According to univariate analysis, insufficient ablative margins on registration software-assisted assessment were significantly associated with the development of LTP (Table 3). Software-assisted margin evaluation, index tumor size, treatment-refractory tumors, and history of local liver tumor treatment, which all showed p values ≤ 0.2 on univariate analysis, were included for assessment on multivariate analysis. As a result, registration software-assisted margin evaluation and treatment-refractory tumors showed a statistically significant association with LTP (p < 0.02) (Table 3). However, a history of local tumor treatment and index tumor size were not significantly associated with LTP. In patients with treatment-naïve tumors, only registration software-assisted margin evaluation showed a statistically significant association with LTP (p = 0.018) (Table 4).
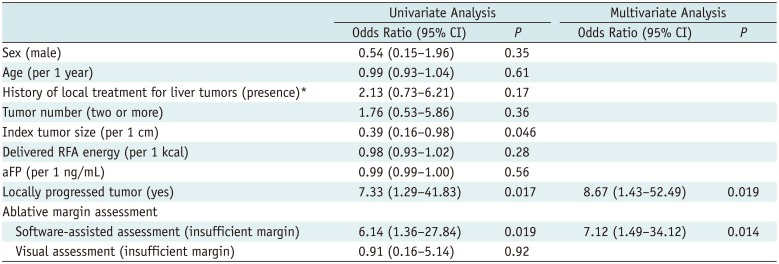
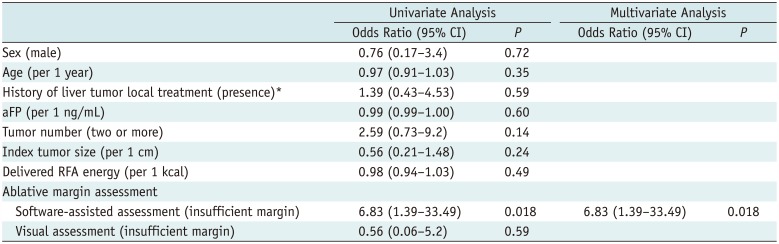
Table 3
Results of Uni- and Multi-Variate Analyses for Predictors of LTP in 66 Patients with Technique Efficacy
![]()
Table 4
Results of Uni- and Multi-Variate Analyses for Predictors of LTP in 59 Patients with Treatment-Naïve HCC and Technique Efficacy
![]()
Go to :
DISCUSSION
Our study results demonstrated that ablative margin assessment using registration software was better for predicting LTP after RFA than was visual inspection of pre-RFA MRI and post-RFA CT. When registration software-assisted inspection was used, the estimated cumulative incidence of LTP was 3.7%, 21.9%, and 27.0% in patients with sufficient margins and 33.3%, 66.7%, and 66.7% in patients with insufficient margins at 1-, 3-, and 5-year follow-ups. To the contrary, with visual inspection, there was no significant difference in cumulative LTP rates between patients with insufficient ablative margins and those with sufficient ablative margins (p = 0.79). In addition, according to multivariate analysis, the presence of an insufficient margin on registration software-assisted assessment of immediate follow-up CT and treatment-refractory tumors were shown to be independently associated with the development of LTP. However, visual assessment results on immediate follow-up CT regarding the creation of an ablative margin was not a predictor for the development of LTP. Considering that an insufficient ablative margin around the index tumor after RFA is a well-known predictor of LTP according to several previous studies (610), accurate assessment of ablative margins after RFA would be necessary not only to determine the necessity of additional treatment, but also to predict the prognosis. In this regard, we believe that this registration software would be clinically valuable for operators evaluating technical success after liver RFA in patients with pre-RFA MRI (15).
The superior results of software-assisted inspection compared with visual assessment for the assessment of sufficient ablative margins in our study could be explained by the challenges of visual inspection on post-RFA imaging across the two modalities. Malignant liver tumors frequently have an irregular rather than a spherical shape, as does the ablative zone, which frequently hampers operators' ability to properly visually inspect ablative margins on a side-by-side comparison. The registration approach, in contrast, provides anatomical synchronization of pre- and post-RFA images and allows an ROI outlining of the index tumor onto the post-RFA CT images, including a virtual 5 mm safety margin. Thus, ablative margin assessment using this software would be substantially easier than visual assessment. In addition, ablative margin assessment is particularly challenging across imaging modalities as the liver deforms nonlinearly according to patients' breathing and arm position, leading to alterations in tumor location, distance from nearby vessels, or adjacent focal liver lesions (2930). Indeed, large rotations (ranged −13.1° to 9.0°, depending on direction) were observed on fused CT and MR images based on vascular segmentation in all three dimensions (31). The presence of rotation between vessels and tumors between CT and MRI would limit the value of internal landmarks on visual inspection and may contribute to the better results of software-assisted inspection using non-rigid imaging fusion. Indeed, side-by-side visual comparison of images derived using different modalities may be difficult, as the ablative margin is scaled in millimeters and the development of parenchymal deformities immediately after RFA (32) can hamper the accurate measurement of the ablative margin. Thus, as there is an increasing need to assess ablation margins on two different cross-sectional imaging modalities, our study results would be valuable for operators in the evaluation of the treatment response or technical success in patients with pre-RFA MRI.
Interestingly, we found that 86.7% of the discrepancies (13/15) between visual inspection and software-assisted inspection occurred in tumors located above the hilar level measured at pre-RFA MRI in our study. Therefore, we cautiously postulate that displacement and 3D deformation of the liver on different imaging modalities may be one of the causes for the different predictions of LTP. As previously mentioned, CT and MRI are acquired at different breathing phases (expiration vs. inspiration) due to the prolonged scan time of MRI compared to CT. The liver moves craniocaudally, anteroposteriorly, and mediolaterally according to breathing, and the range of displacement of the liver was reported to range from 7.5 mm to 15.5 mm on cine MRI in the literature (33), which is coincidentally comparable to that of an acceptable ablative margin (5–10 mm). In particular, the superior half of the liver has been reported to be especially prone to motion (34), which is consistent with the observations of our study. Therefore, we suggest that since tumors at a level higher than the portal hilum may be prone to assessment error on visual inspection, more careful attention would be required for ablation margin assessment of these tumors.
As HCCs commonly develop in cirrhotic livers, and RFA is widely used for small HCCs in patients with liver cirrhosis with portal hypertension, it is quite important to create minimal ablative margins, which could effectively prevent LTP while not deteriorating liver function (10). Regarding the criteria of the minimal ablative margin for preventing LTP after RFA for HCC, there are some controversies. According to a study by Kim et al. (10), a margin of 3 mm or more was associated with a lower rate of LTP after RFA of HCC. However, according to a recent prospective study, RFA treatment targeting 10 mm margins for a small solitary HCC (< 3 cm) may reduce the risk of tumor recurrence in cirrhotic patients with a single, small HCC (35). In our study, the estimated cumulative incidence of LTP was 27.0% at 5-year follow-up in the group with sufficient ablative margins (> 3 mm) in registration software assessment. This relatively high LTP rate of tumors with sufficient ablative margins after RFA could be explained by our heterogeneous study population consisting of treatment-refractory and treatment-naïve tumors. Previous reports have shown that treatment-refractory tumors show worse prognosis than treatment naïve tumors (36). Indeed, treatment-refractory tumors showed a higher incidence of LTP in our study while patients with treatment-naïve tumors and sufficient margins on software-assisted inspection in our study showed comparable LTP rates with those previously reported in the literature. Therefore, based on our study results, we believe that when RFA is planned for treating recurrent HCCs after other locoregional therapies, the creation of a perilesional ablative margin larger than 10 mm could be necessary for treatment-refractory tumors. In addition, our study design was intended to compare the performance of visual and software-assisted ablative margin assessment. Therefore, some tumors without evidence of residual tumor on 1-month follow-up had insufficient margins on at least one of the assessments of immediate post-RFA CT. The LTP would thus be higher than that of other studies with sufficient margins on immediate post-RFA CT.
Our study has several limitations. First, the relatively small number of study patients with heterogeneous tumor characteristics may have weakened the statistical power of several variables. Second, pre-RFA MRI was taken on two different scanners with different parameters including slice thicknesses, which may have affected image registration quality. However, no significant differences in scanner type were observed between the groups with concordance and discordance in the two inspection methods. Third, index tumor size, which is a well-known risk factor for LTP after RFA, was not significantly associated with LTP in our study. We believe that the average index tumor size was less than 2 cm in our study; thus, the tumor size may not have had distinctive power to predict LTP in this group. In addition, treatment-refractory tumor size was measured in the arterial enhancing portion in our study, but recent studies suggested that measurement of enhancing tumor components of treated HCCs after TACE may underestimate real tumor burden (3738). Fourth, we did not test inter-reader agreement in each evaluation method. However, conventional visual assessment was done by operators to optimize patient care, and software-aided assessment has been reported to improve inter-reader agreement (16). Finally, even though all patients who showed insufficient ablative margins on either inspection were indicated for second-look treatment, we performed second-look RFA and chemoembolization in only six patients and we were not able to perform additional local therapy in others due to the limited technical feasibility. However, we still believe in the clinical feasibility of registration software-assisted assessment since it served to correctly identify patients with high risk of LTP better than visual assessment in patients with a combination of different modalities before and after RFA. Further studies would be necessary to evaluate the added value of second-look RFA treatment following software-assisted ablative margin inspection.
In conclusion, non-rigid registration software provided better ablative margin assessment than did visual inspection in patients who had undergone pre-RFA MRI and post-RFA CT for the prediction of LTP after RFA, and it may provide more precise risk stratification of those who are treated with RFA.
Go to :
 XML Download