INTRODUCTION
Various cardiac diseases are associated with left ventricle (LV) hypoplasia. In a spectrum of LV hypoplasia, predicting the feasibility of biventricular repair (BVR) is challenging (
1234). Inadequate BVR in these patients carries both short- and long-term risks. In addition, conversion to single ventricle repair (SVR) because of failed BVR frequently results in substantial morbidity and mortality (
4). Conversely, aggressive BVR should be attempted in patients with trisomy 21 because of their tendency to have upper airway obstruction, atrioventricular valve (AVV) regurgitation, pulmonary hypertension, and increased pulmonary vascular resistance, leading to suboptimal SVR outcomes (
34).
Ventricular volume has classically been used to determine surgical strategies in patients with a hypoplastic LV, and is most commonly measured using echocardiography (
124). However, a study using cardiac magnetic resonance imaging (MRI) (
5) clearly demonstrated that echocardiography consistently underestimates LV volume. In young children, cardiac MRI, however, may be limited by long examination time and low spatial resolution. By contrast, the short examination time and high spatial resolution of cardiac computed tomography (CT) seems to be particularly beneficial in young children. Initial experiences of ventricular volumetry using cardiac CT and semiautomatic three-dimensional (3D) threshold-based segmentation have been reported in children with a hypoplastic LV (
67). However, CT-based ventricular volumes and morphometric parameters for helping decide on a surgical strategy have not been reported. Therefore, this study explored the use of CT-based ventricular volumes and morphometric parameters for deciding treatment strategy in children with a hypoplastic LV.
Go to :

MATERIALS AND METHODS
This retrospective study was approved by the local Institutional Review Board and the need for informed consent was waived.
Study Population
Between September 2010 and May 2016, preoperative end-systolic (ES) and end-diastolic (ED) cardiac CT examination was performed in 28 consecutive patients with a hypoplastic LV (small LV SVR group), six consecutive patients with a hypoplastic LV (small LV BVR group), 19 consecutive patients with congenital heart diseases potentially associated with a hypoplastic LV but actually having balanced ventricular sizes (disease-matched control group), and 41 consecutive patients with small or no shunt flow or a structurally normal heart (control group).
Exclusion criteria in the four groups included severe ventricular hypertrophy, death before definitive surgical repair, impaired ventricular function, severe pulmonary hypertension, age older than 1 year at the time of CT examination, past history of severe side effects of iodinated contrast agent, and severe renal failure.
A total of 94 patients in the four groups were enrolled in this study. Congenital heart diseases, mortality, and loss to follow-up in the study population are described in
Table 1. The patient characteristics of the study population are summarized for each group in
Table 2.
Table 1
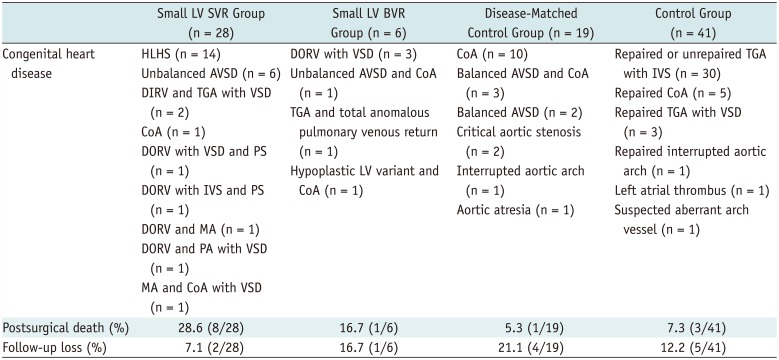
Congenital Heart Disease, Postsurgical Mortality, and Follow-Up Loss
|
Small LV SVR Group (n = 28) |
Small LV BVR Group (n = 6) |
Disease-Matched Control Group (n = 19) |
Control Group (n = 41) |
|
Congenital heart disease |
HLHS (n = 14) |
DORV with VSD (n = 3) |
CoA (n = 10) |
Repaired or unrepaired TGA with IVS (n = 30) |
|
Unbalanced AVSD (n = 6) |
Unbalanced AVSD and CoA (n = 1) |
Balanced AVSD and CoA (n = 3) |
Repaired CoA (n = 5) |
|
DIRV and TGA with VSD (n = 2) |
TGA and total anomalous pulmonary venous return (n = 1) |
Balanced AVSD (n = 2) |
Repaired TGA with VSD (n = 3) |
|
CoA (n = 1) |
Hypoplastic LV variant and CoA (n = 1) |
Critical aortic stenosis (n = 2) |
Repaired interrupted aortic arch (n = 1) |
|
DORV with VSD and PS (n = 1) |
Interrupted aortic arch (n = 1) |
Left atrial thrombus (n = 1) |
|
DORV with IVS and PS (n = 1) |
Aortic atresia (n = 1) |
Suspected aberrant arch vessel (n = 1) |
|
DORV and MA (n = 1) |
|
DORV and PA with VSD (n = 1) |
|
MA and CoA with VSD (n = 1) |
|
Postsurgical death (%) |
28.6 (8/28) |
16.7 (1/6) |
5.3 (1/19) |
7.3 (3/41) |
|
Follow-up loss (%) |
7.1 (2/28) |
16.7 (1/6) |
21.1 (4/19) |
12.2 (5/41) |

Table 2
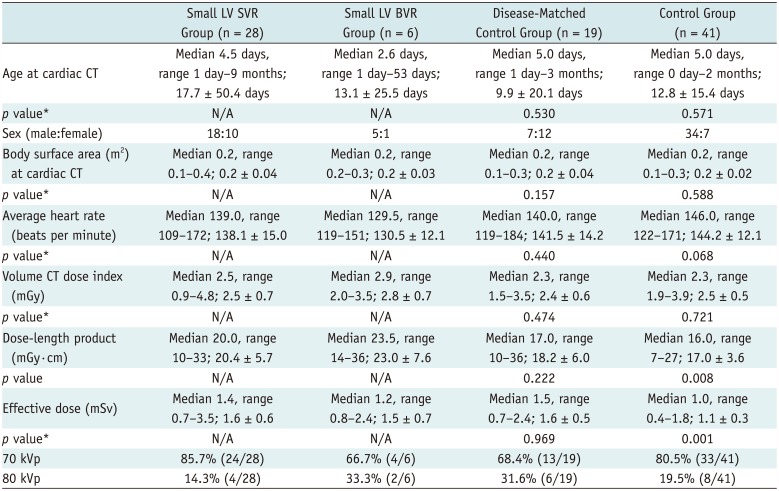
Patient Characteristics and CT Scan Parameters
|
Small LV SVR Group (n = 28) |
Small LV BVR Group (n = 6) |
Disease-Matched Control Group (n = 19) |
Control Group (n = 41) |
|
Age at cardiac CT |
Median 4.5 days, range 1 day–9 months; |
Median 2.6 days, range 1 day–53 days; |
Median 5.0 days, range 1 day–3 months; |
Median 5.0 days, range 0 day–2 months; |
|
17.7 ± 50.4 days |
13.1 ± 25.5 days |
9.9 ± 20.1 days |
12.8 ± 15.4 days |
|
p value*
|
N/A |
N/A |
0.530 |
0.571 |
|
Sex (male:female) |
18:10 |
5:1 |
7:12 |
34:7 |
|
Body surface area (m2) at cardiac CT |
Median 0.2, range |
Median 0.2, range |
Median 0.2, range |
Median 0.2, range |
|
0.1–0.4; 0.2 ± 0.04 |
0.2–0.3; 0.2 ± 0.03 |
0.1–0.3; 0.2 ± 0.04 |
0.1–0.3; 0.2 ± 0.02 |
|
p value*
|
N/A |
N/A |
0.157 |
0.588 |
|
Average heart rate (beats per minute) |
Median 139.0, range |
Median 129.5, range |
Median 140.0, range |
Median 146.0, range |
|
109–172; 138.1 ± 15.0 |
119–151; 130.5 ± 12.1 |
119–184; 141.5 ± 14.2 |
122–171; 144.2 ± 12.1 |
|
p value*
|
N/A |
N/A |
0.440 |
0.068 |
|
Volume CT dose index (mGy) |
Median 2.5, range |
Median 2.9, range |
Median 2.3, range |
Median 2.3, range |
|
0.9–4.8; 2.5 ± 0.7 |
2.0–3.5; 2.8 ± 0.7 |
1.5–3.5; 2.4 ± 0.6 |
1.9–3.9; 2.5 ± 0.5 |
|
p value*
|
N/A |
N/A |
0.474 |
0.721 |
|
Dose-length product (mGy·cm) |
Median 20.0, range |
Median 23.5, range |
Median 17.0, range |
Median 16.0, range |
|
10–33; 20.4 ± 5.7 |
14–36; 23.0 ± 7.6 |
10–36; 18.2 ± 6.0 |
7–27; 17.0 ± 3.6 |
|
p value |
N/A |
N/A |
0.222 |
0.008 |
|
Effective dose (mSv) |
Median 1.4, range |
Median 1.2, range |
Median 1.5, range |
Median 1.0, range |
|
0.7–3.5; 1.6 ± 0.6 |
0.8–2.4; 1.5 ± 0.7 |
0.7–2.4; 1.6 ± 0.5 |
0.4–1.8; 1.1 ± 0.3 |
|
p value*
|
N/A |
N/A |
0.969 |
0.001 |
|
70 kVp |
85.7% (24/28) |
66.7% (4/6) |
68.4% (13/19) |
80.5% (33/41) |
|
80 kVp |
14.3% (4/28) |
33.3% (2/6) |
31.6% (6/19) |
19.5% (8/41) |
Cardiac CT
Free-breathing prospectively electrocardiography (ECG)-triggered sequential cardiac CT using the “flex” scan mode was performed with a 128-slice dual-source scanner (SOMATOM Definition Flash; Siemens Healthineers, Forchheim, Germany) with 2 × 64 × 0.6 mm slices using the z-flying focal spot technique, a 0.28-second gantry rotation time, a 75-ms temporal resolution, a 0.75-mm slice width, and a 0.4-mm reconstruction interval. Oral choral hydrate (50 mg/kg) was initially used to sedate the patients, and intravenous midazolam (0.1 mg/kg) or ketamine (1 mg/kg) was additionally administered as required. The patients' heart rates during the cardiac CT examination were recorded and an average was calculated for each patient. As previously described (
8), the ES phase was targeted to the second half of the T wave on ECG and a fixed trigger of −35 ms was used to target the ED phase. In a 9-month-old boy in the small LV SVR group, additional prospective respiratory triggering was combined with a prospectively ECG-triggered sequential scan to minimize respiratory misregistration artifacts between adjacent imaging slabs as previously reported (
9).
To obtain uniform image noise, volume CT dose index values based on a 32-cm phantom were individually determined based on the cross-sectional area and mean body density measured on an axial CT image obtained approximately 1–2 cm above the dome of the liver for bolus tracking (
10). Tube current was subsequently adjusted to meet the individually determined volume CT dose index values at 70 kV or 80 kV. For image reconstruction, sinogram-affirmed iterative reconstruction (SAFIRE; Siemens Healthineers) was used at strength 5 with a medium smooth kernel (I26f). Iodinated contrast agent (Iomeron 400, 400 mg I/mL; Bracco Imaging SpA, Milan, Italy; 1.5–2.0 mL/kg) was intravenously administered at an injection rate of 0.2–1.0 mL/s by using a dual-head power injector and a tri-phasic injection protocol, whereby undiluted contrast agent was followed by 50% diluted contrast agent and then by 5% diluted contrast agent. The scan delay time was determined using a bolus-tracking technique with a trigger threshold of 150 Hounsfield units (HU) in the LV cavity.
The volume CT dose index and dose-length product values, based on a 32-cm phantom, of cardiac CT were recorded. Effective dose values of cardiac CT were calculated by multiplying the dose-length product by the age, sex, and tube voltage-specific conversion factors for chest CT (
1112).
Semiautomatic 3D Threshold-Based CT Ventricular Volumetry
A stack of thin axial cardiac CT images was sent to a commercially available workstation (Advantage Windows 4.6; GE Healthcare, Milwaukee, WI, USA). For CT ventricular volumetry, a 3D threshold-based segmentation method enabling the exclusion of the papillary muscles and trabeculations from the ventricular cavity was used (
Fig. 1A–D). An optimal segmentation threshold differentiating the most compact myocardium from ventricular blood was selected for each cardiac phase by using histogram-assisted analysis as previously described (
613). The AVV and semilunar valve planes were then manually adjusted. The preliminary volumetric segmentation was conducted by a radiology technologist and the final result was validated by a radiologist with 18 years of experience in cardiac CT. ES and ED ventricular volumes calculated for each cardiac CT examination (
Fig. 1A–D) were indexed to body surface area. From the ventricular volumes, the LV-to-right-ventricular (LV/RV) volume ratio was calculated for each cardiac phase. To evaluate the reproducibility of CT ventricular volumetry, the quantification of 37 LV volumes was repeated with blinding to the initial results of 35 patients whose thin axial CT datasets were available.
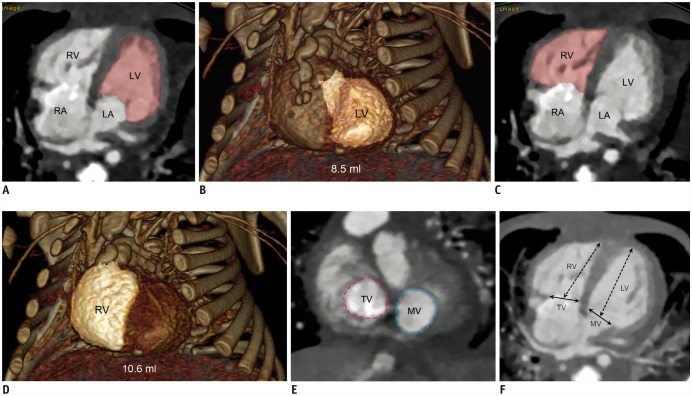 | Fig. 1
Cardiac CT imaging in 27-day-old boy with repaired complete transposition of great arteries with ventricular septal defect and coarctation of aorta.
A. Four-chamber CT image obtained at ED phase showing segmented left ventricular cavity in pink. B. Oblique frontal volume-rendered CT image revealing left ventricular EDV (8.5 mL) highlighted in light pink. C. Four-chamber CT image obtained at ED phase illustrating segmented right ventricular cavity in pink. D. Oblique frontal volume-rendered CT image displaying right ventricular EDV (10.6 mL) highlighted in light pink. E. Short-axis CT image acquired at ED phase showing MV area (light blue dotted line) and TV area (pink dotted line) necessary for calculation of atrioventricular valve area ratio. F. Four-chamber CT image obtained at ED phase illustrating MV and TV diameters (solid arrows) as well as left ventricular and right ventricular long dimensions (dotted arrows). CT = computed tomography, ED = end-diastolic, EDV = end-diastolic volume, LA = left atrium, LV = left ventricle, MV = mitral valve, RA = right atrium, RV = right ventricle, TV = tricuspid valve

|
CT-Based Morphometric Parameters
The left-to-right AVV area ratio was calculated from short-axis CT images (
Fig. 1E) for each cardiac phase. Using four-chamber CT images (
Fig. 1F), the left-to-right AVV diameter and LV/RV long dimension ratios were calculated for each cardiac phase; the ventricular long dimension was measured from the center of each AVV to the apex of the corresponding ventricle. All of the parameters were measured by a radiologist with 18 years of experience in cardiac CT. To evaluate the reproducibility of CT-based morphometric parameters, the measurements were repeated with blinding to the initial results 4 months after the initial measurements in the small LV SVR group.
Endocardial Fibroelastosis
Echocardiographic and cardiac CT images were evaluated in the two small LV groups to determine whether endocardial fibroelastosis, one of poor prognostic factors in this cohort, was present in the hypoplastic LV. Endocardial fibroelastosis is characterized by an echogenic endocardial myocardial lesion on echocardiography and a hypodense endocardial myocardial lesion on cardiac CT.
Statistical Analysis
Continuous variables are presented as means ± standard deviation or medians with ranges, and categorical variables are expressed as frequencies with percentages. Unpaired t tests were used to compare the differences between the means of two independent continuous variables when the number of variables for comparison was greater than seven. Paired comparisons of proportions were performed between the ES and ED data by using the McNemar test. The reproducibility of CT-based quantitative measurements was analysed using intraclass correlation coefficients. A p value of less than 0.05 was considered to be statistically significant. For statistical analysis, statistical software (SPSS version 24.0; IBM Corp., Armonk, NY, USA) was used.
The author attempted, as far as possible, to evaluate the data in a blinded manner; all of the quantitative data were first processed before patient exclusion, the study population was then enrolled according to the inclusion and exclusion criteria and divided into the four groups, and, finally, statistical analysis was performed.
Go to :
RESULTS
Patient Characteristics and CT Parameters
No significant differences were observed between the small LV SVR group and the two control groups in age at cardiac CT, body surface area, average heart rate during CT examination, and volume CT dose index (
Table 2). Dose-length product and effective dose also showed no significant difference between the small LV SVR group and the disease-matched control group (
Table 2). By contrast, dose-length product and effective dose of cardiac CT in the control group were significantly lower than those in the small LV SVR group (
Table 2). Compared with 80 kV, 70 kV was more frequently used in all patients (78.7%, 74/94) as well as in the four groups (range, 66.7–85.7%) (
Table 2).
CT Volumetry and Morphometric Parameters
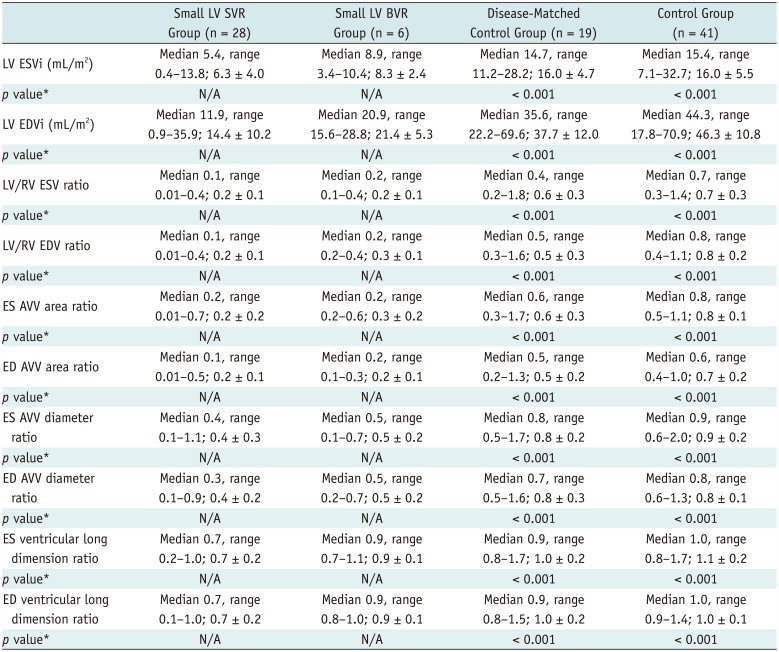
Indexed LV end-systolic volumes (ESVs) and end-diastolic volumes (EDVs) in the small LV SVR group (6.3 ± 4.0 mL/m
2 and 14.4 ± 10.2 mL/m
2, respectively) were significantly smaller than those in the disease-matched control group (16.0 ± 4.7 mL/m
2 and 37.7 ± 12.0 mL/m
2, respectively;
p < 0.001) and the control group (16.0 ± 5.5 mL/m
2 and 46.3 ± 10.8 mL/m
2, respectively;
p < 0.001) (
Table 3). ES and ED LV/RV volume ratios (0.2 ± 0.1 and 0.2 ± 0.1, respectively), AVV area (0.2 ± 0.2 and 0.2 ± 0.1, respectively), diameter ratios (0.4 ± 0.3 and 0.4 ± 0.2, respectively), and ventricular long dimension ratios (0.7 ± 0.2 and 0.7 ± 0.2, respectively) in the small LV SVR group also were significantly smaller than those in the disease-matched control group (0.6 ± 0.3 and 0.5 ± 0.3, 0.6 ± 0.3 and 0.5 ± 0.2, 0.8 ± 0.2 and 0.8 ± 0.3, and 1.0 ± 0.2 and 1.0 ± 0.2, respectively;
p < 0.001) and the control group (0.7 ± 0.3 and 0.8 ± 0.2, 0.8 ± 0.1 and 0.7 ± 0.2, 0.9 ± 0.2 and 0.8 ± 0.1, and 1.1 ± 0.2 and 1.0 ± 0.1, respectively;
p < 0.001) (
Table 3).
Table 3
CT-Based Volumetry and Morphometric Parameters
|
Small LV SVR Group (n = 28) |
Small LV BVR Group (n = 6) |
Disease-Matched Control Group (n = 19) |
Control Group (n = 41) |
|
LV ESVi (mL/m2) |
Median 5.4, range |
Median 8.9, range |
Median 14.7, range |
Median 15.4, range |
|
0.4–13.8; 6.3 ± 4.0 |
3.4–10.4; 8.3 ± 2.4 |
11.2–28.2; 16.0 ± 4.7 |
7.1–32.7; 16.0 ± 5.5 |
|
p value*
|
N/A |
N/A |
< 0.001 |
< 0.001 |
|
LV EDVi (mL/m2) |
Median 11.9, range |
Median 20.9, range |
Median 35.6, range |
Median 44.3, range |
|
0.9–35.9; 14.4 ± 10.2 |
15.6–28.8; 21.4 ± 5.3 |
22.2–69.6; 37.7 ± 12.0 |
17.8–70.9; 46.3 ± 10.8 |
|
p value*
|
N/A |
N/A |
< 0.001 |
< 0.001 |
|
LV/RV ESV ratio |
Median 0.1, range |
Median 0.2, range |
Median 0.4, range |
Median 0.7, range |
|
0.01–0.4; 0.2 ± 0.1 |
0.1–0.4; 0.2 ± 0.1 |
0.2–1.8; 0.6 ± 0.3 |
0.3–1.4; 0.7 ± 0.3 |
|
p value*
|
N/A |
N/A |
< 0.001 |
< 0.001 |
|
LV/RV EDV ratio |
Median 0.1, range |
Median 0.2, range |
Median 0.5, range |
Median 0.8, range |
|
0.01–0.4; 0.2 ± 0.1 |
0.2–0.4; 0.3 ± 0.1 |
0.3–1.6; 0.5 ± 0.3 |
0.4–1.1; 0.8 ± 0.2 |
|
p value*
|
N/A |
N/A |
< 0.001 |
< 0.001 |
|
ES AVV area ratio |
Median 0.2, range |
Median 0.2, range |
Median 0.6, range |
Median 0.8, range |
|
0.01–0.7; 0.2 ± 0.2 |
0.2–0.6; 0.3 ± 0.2 |
0.3–1.7; 0.6 ± 0.3 |
0.5–1.1; 0.8 ± 0.1 |
|
p value*
|
N/A |
N/A |
< 0.001 |
< 0.001 |
|
ES AVV diameter ratio |
Median 0.1, range |
Median 0.2, range |
Median 0.5, range |
Median 0.6, range |
|
0.01–0.5; 0.2 ± 0.1 |
0.1–0.3; 0.2 ± 0.1 |
0.2–1.3; 0.5 ± 0.2 |
0.4–1.0; 0.7 ± 0.2 |
|
p value*
|
N/A |
N/A |
< 0.001 |
< 0.001 |
|
ES AVV diameter ratio |
Median 0.4, range |
Median 0.5, range |
Median 0.8, range |
Median 0.9, range |
|
0.1–1.1; 0.4 ± 0.3 |
0.1–0.7; 0.5 ± 0.2 |
0.5–1.7; 0.8 ± 0.2 |
0.6–2.0; 0.9 ± 0.2 |
|
p value*
|
N/A |
N/A |
< 0.001 |
< 0.001 |
|
ED AVV diameter ratio |
Median 0.3, range |
Median 0.5, range |
Median 0.7, range |
Median 0.8, range |
|
0.1–0.9; 0.4 ± 0.2 |
0.2–0.7; 0.5 ± 0.2 |
0.5–1.6; 0.8 ± 0.3 |
0.6–1.3; 0.8 ± 0.1 |
|
p value*
|
N/A |
N/A |
< 0.001 |
< 0.001 |
|
ES ventricular long dimension ratio |
Median 0.7, range |
Median 0.9, range |
Median 0.9, range |
Median 1.0, range |
|
0.2–1.0; 0.7 ± 0.2 |
0.7–1.1; 0.9 ± 0.1 |
0.8–1.7; 1.0 ± 0.2 |
0.8–1.7; 1.1 ± 0.2 |
|
p value*
|
N/A |
N/A |
< 0.001 |
< 0.001 |
|
ED ventricular long dimension ratio |
Median 0.7, range |
Median 0.9, range |
Median 0.9, range |
Median 1.0, range |
|
0.1–1.0; 0.7 ± 0.2 |
0.8–1.0; 0.9 ± 0.1 |
0.8–1.5; 1.0 ± 0.2 |
0.9–1.4; 1.0 ± 0.1 |
|
p value*
|
N/A |
N/A |
< 0.001 |
< 0.001 |
In the end-systole, various subsets (57.1%, 60.7%, 50.0%, and 64.3%, respectively) of the patients in the small LV SVR group could be completely differentiated from those in the two control groups based on combinations of indexed LV volume < 7 mL/m
2 and LV/RV volume ratio < 0.22, indexed LV volume < 7 mL/m
2 and AVV area ratio < 0.33, indexed LV volume < 7 mL/m
2 and AVV diameter ratio < 0.52, and LV/RV volume ratio < 0.22 and AVV area ratio < 0.33, respectively (
Fig. 2). In the end-diastole, various subsets (60.7%, 57.1%, 60.7%, and 67.9%, respectively) of the patients in the small LV SVR group could be completely differentiated from those in the two control groups based on combinations of indexed LV volume < 17 mL/m
2 and LV/RV volume ratio < 0.25, indexed LV volume < 17 mL/m
2 and AVV area ratio < 0.24, indexed LV volume < 17 mL/m
2 and AVV diameter ratio < 0.46, and LV/RV volume ratio < 0.25 and AVV area ratio < 0.24, respectively (
Fig. 3). However, no significant differences were observed in the proportions between the end-systole and the end-diastole (
Table 4).
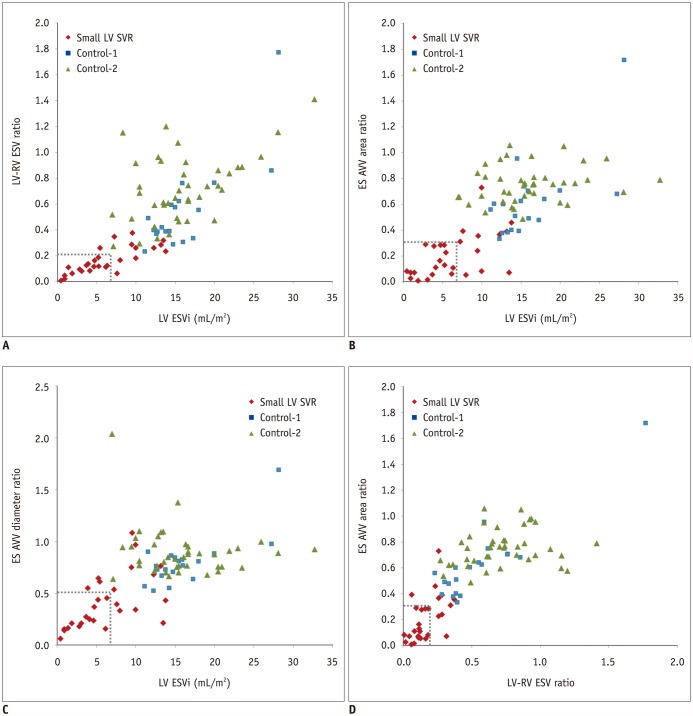 | Fig. 2
Scatter plots illustrating relationships among various combinations of ESVs and morphometric data.
A. Scatter plot demonstrating that indexed left ventricular ESV < 7.0 mL/m2 (dotted line) and LV/RV ESV ratio < 0.22 (dotted line) can differentiate 16 of 28 patients (57.1%) in small LV SVR group from patients in two control groups. B. Scatter plot showing that indexed left ventricular ESV < 7.0 mL/m2 (dotted line) and ES atrioventricular area ratio < 0.33 (dotted line) can differentiate 17 of 28 patients (60.7%) in small LV SVR group from patients in two control groups. C. Scatter plot demonstrating that indexed left ventricular ESV < 7.0 mL/m2 (dotted line) and ES atrioventricular diameter ratio < 0.52 (dotted line) can differentiate 14 of 28 patients (50.0%) in small LV SVR group from patients in two control groups. D. Scatter plot demonstrating that LV/RV ESV ratio < 0.22 (dotted line) and ES atrioventricular diameter ratio < 0.52 (dotted line) can be used to differentiate 18 of 28 patients (64.3%) in small LV SVR group from patients in two control groups. AVV = atrioventricular valve, Control-1 = disease matched control group, Control-2 = control group, ES = end-systolic, ESV = end-systolic volume, ESVi = indexed end-systolic volume, LV/RV = LV-to-right-ventricular, SVR = single ventricle repair
|
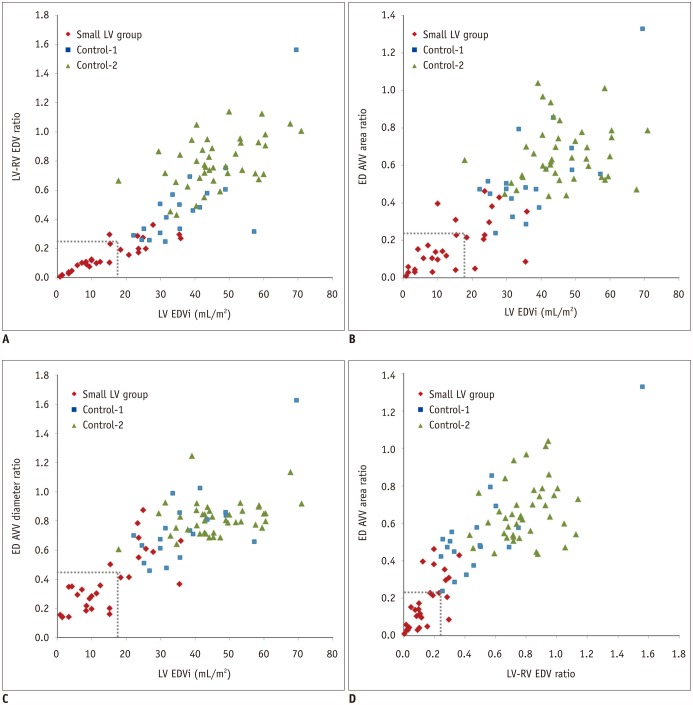 | Fig. 3
Scatter plots illustrating various combinations of EDVs and morphometric data.
A. Scatter plot demonstrating that indexed left ventricular EDV < 17.0 mL/m2 (dotted line) and LV/RV EDV ratio < 0.25 (dotted line) can differentiate 17 of 28 patients (60.7%) in small LV SVR group from patients in two control groups. B. Scatter plot showing that indexed left ventricular EDV < 17.0 mL/m2 (dotted line) and ED atrioventricular area ratio < 0.24 (dotted line) can differentiate 16 of 28 patients (57.1%) in small LV SVR group from patients in two control groups. C. Scatter plot demonstrating that indexed left ventricular EDV < 17.0 mL/m2 (dotted line) and ED atrioventricular diameter ratio < 0.46 (dotted line) can differentiate 17 of 28 patients (60.7%) in small LV SVR group from patients in two control groups. D. Scatter plot demonstrating that LV/RV EDV ratio < 0.25 (dotted line) and ED atrioventricular diameter ratio < 0.24 (dotted line) can be used to differentiate 19 of 28 patients (67.9%) in small LV SVR group from patients in two control groups. EDVi = indexed end-diastolic volume
|
Table 4
Paired Comparisons of Proportions Separating Small LV SVR Group from Control Groups between End-Systole and End-Diastole by Using McNemar Test
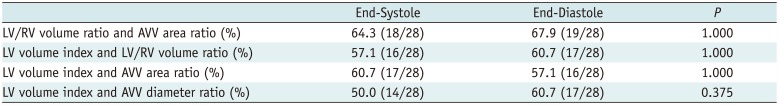
|
End-Systole |
End-Diastole |
P
|
|
LV/RV volume ratio and AVV area ratio (%) |
64.3 (18/28) |
67.9 (19/28) |
1.000 |
|
LV volume index and LV/RV volume ratio (%) |
57.1 (16/28) |
60.7 (17/28) |
1.000 |
|
LV volume index and AVV area ratio (%) |
60.7 (17/28) |
57.1 (16/28) |
1.000 |
|
LV volume index and AVV diameter ratio (%) |
50.0 (14/28) |
60.7 (17/28) |
0.375 |
Ventricular long dimension ratios considerably overlapped among the groups were not used for analyzing the differentiation of the small LV SVR group from the control groups. In the small LV BVR group, one patient with transposition of the great arteries and total anomalous venous return exhibited an indexed LV ESV (3.9 mL/m2) < 7 mL/m2 and an indexed LV EDV (15.6 mL/m2) < 17 mL/m2. The patient did not survive after BVR, whereas the remaining five patients with LV volumes greater than the cut-off values did survive after BVR. Conversely, the other parameters could not be used to identify the failed BVR case in the small LV BVR group.
Endocardial Fibroelastosis
In the small LV SVR group, endocardial fibroelastosis was detected in two patients (7.1%, 2/28): two by echocardiography and one by cardiac CT. Conversely, endocardial fibroelastosis was not identified in the small LV BVR group.
Mortality after Biventricular Repair
Five patients died after BVR: one patient in the small LV BVR group and the remaining four in the two control groups. Among them, the patient in the small LV BVR group might not have been a good candidate for BVR according to the quantitative parameters that were below the cut-off values, including indexed ES and ED LV volumes (3.9 mL/m2 and 15.6 mL/m2, respectively), ES and ED LV/RV volume ratios (0.15 and 0.23, respectively), and ES AVV area ratio (0.15).
Reproducibility of CT-Based Quantitative Measurements
The reproducibility of CT-based ventricular volumes and morphometric parameters was excellent and intraclass correlation coefficients were higher than 0.9 for all of the parameters (
Table 5).
Table 5
Reproducibility of CT-Based Quantitative Measurements
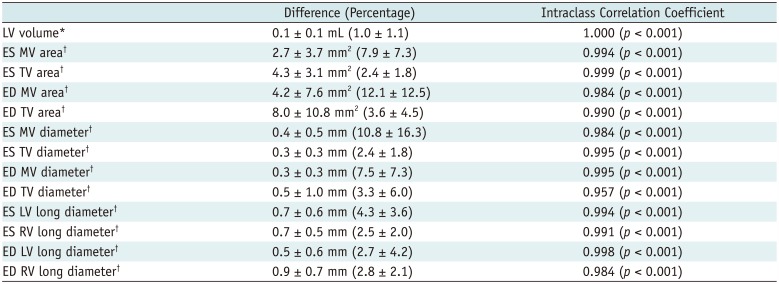
|
Difference (Percentage) |
Intraclass Correlation Coefficient |
|
LV volume*
|
0.1 ± 0.1 mL (1.0 ± 1.1) |
1.000 (p < 0.001) |
|
ES MV area†
|
2.7 ± 3.7 mm2 (7.9 ± 7.3) |
0.994 (p < 0.001) |
|
ES TV area†
|
4.3 ± 3.1 mm2 (2.4 ± 1.8) |
0.999 (p < 0.001) |
|
ED MV area†
|
4.2 ± 7.6 mm2 (12.1 ± 12.5) |
0.984 (p < 0.001) |
|
ED TV area†
|
8.0 ± 10.8 mm2 (3.6 ± 4.5) |
0.990 (p < 0.001) |
|
ES MV diameter†
|
0.4 ± 0.5 mm (10.8 ± 16.3) |
0.984 (p < 0.001) |
|
ES TV diameter†
|
0.3 ± 0.3 mm (2.4 ± 1.8) |
0.995 (p < 0.001) |
|
ED MV diameter†
|
0.3 ± 0.3 mm (7.5 ± 7.3) |
0.995 (p < 0.001) |
|
ED TV diameter†
|
0.5 ± 1.0 mm (3.3 ± 6.0) |
0.957 (p < 0.001) |
|
ES LV long diameter†
|
0.7 ± 0.6 mm (4.3 ± 3.6) |
0.994 (p < 0.001) |
|
ES RV long diameter†
|
0.7 ± 0.5 mm (2.5 ± 2.0) |
0.991 (p < 0.001) |
|
ED LV long diameter†
|
0.5 ± 0.6 mm (2.7 ± 4.2) |
0.998 (p < 0.001) |
|
ED RV long diameter†
|
0.9 ± 0.7 mm (2.8 ± 2.1) |
0.984 (p < 0.001) |
Go to :
DISCUSSION
This preliminary study suggested that CT-based ventricular volumes and morphometric parameters may be used to help decide on a surgical strategy for children with a hypoplastic LV. The AVV index, reflecting LV inlet size, is regarded as the optimal predictor for successful BVR in patients with unbalanced atrioventricular septal defect in studies using echocardiography (
13), a concept initially proposed by Cohen et al. (
14) and later validated by Jegatheeswaran et al. (
15). Therefore, parameters reflecting LV inlet size, such as AVV area and diameter ratios, were also incorporated into the present study in addition to parameters reflecting LV volume and long dimension. Through a combination of CT-based parameters, 50.0–67.9% of the patients in the small LV SVR group were correctly identified. Nevertheless, considerable overlaps occurred among the small LV BVR group and the control groups. However, this gray zone was also present in an echocardiography-modified AVV index between 0.2 and 0.39. Consequently, clinical outcome evaluation is necessary to further refine CT-based parameters to improve decision making for surgical strategies in this gray zone.
As a part of these efforts, the LV flow index, RV/LV inflow angle (
3), and, more recently, the ventricular septal defect index (
16) have been developed to help surgical decision making for a modified AVV index between 0.2 and 0.39, but they are disease specific (e.g., unbalanced atrioventricular septal defect). Notably, the echocardiography-based AVV index and the CT-based AVV area ratio differ in their formulas: the former is defined as the left AVV area divided by the total AVV area, whereas the latter is defined as the left AVV area divided by the right AVV area. Consequently, echocardiography-based values should be smaller than CT-based values. In this study, the different formula for calculating the AVV area and diameter ratios was used to increase consistency in calculating the CT-based parameters including the LV/RV volume ratio and LV/RV long dimension ratio.
The echocardiographic indexed LV EDVs at which BVR remains feasible have been reported: > 15 mL/m
2 in right-dominant unbalanced atrioventricular septal defects (
1), > 18 mL/m
2 in obstructive left heart disease with a hypoplastic LV (
2), and > 20 mL/m
2 in critical aortic stenosis (
17). Other imaging modalities, such as MRI and CT, have not been studied to determine the cut-off LV volume. Unfortunately, the echocardiographic measurement of geometrically distorted hypoplastic LV volumes is subject to substantial underestimation largely because of geometric assumption, which is greater in the monoplane Simpson method than in the biplane Simpson method (
15). In this study, the equivalent CT-based indexed LV EDV could not be drawn because of the small number (n = 6) of patients in the small LV BVR group. Nonetheless, the preliminary results of this study suggested that BVR may be considered at a CT-based indexed LV EDV of > 17 mL/m
2. In newborns with hypoplastic left heart syndrome before undergoing a Norwood operation, the CT-based indexed LV EDV was 10.6 ± 6.0 mL/m
2 (range, 3.3–20.8 mL/m
2) (
7) and the corresponding value in the small LV SVR group was 14.4 ± 10.2 mL/m
2 (range, 0.9–35.9 mL/m
2).
The additional importance of this study is that no significant differences in the proportions completely differentiating the small LV SVR group from the two control groups were observed between the end-systole and the end-diastole (
Table 4). Only ED data have been used to predict the feasibility of BVR in a hypoplastic LV. However, the ES phase is commonly used in pediatric cardiac CT because of high heart rates and superior anatomic evaluation (
18). Therefore, additional acquisition of ED CT data is likely unnecessary to evaluate the feasibility of BVR in young children with a hypoplastic LV.
The presence of endocardial fibroelastosis also is critical in determining the clinical outcomes of a hypoplastic LV (
2). Echocardiography is used to detect endocardial fibroelastosis but echocardiographic findings are weakly associated with histologic evidence of endocardial fibroelastosis at autopsy (
19). Late gadolinium-enhancement MRI has been proposed as an alternative technique for identifying and quantifying endocardial fibroelastosis and is considered more specific than echocardiography (
20). Recently, endocardial fibroelastosis, as endocardial hypodense and delayed hyperenhancing lesions, has been detected on early- and delayed-phase cardiac CT, respectively (
721). In this study, endocardial fibroelastosis was infrequently detected, in two patients (7.1%) by using echocardiography and in one patient (3.6%) by using cardiac CT in the small LV SVR group.
Other variables, such as a complex mix of anatomic substrates, cardiac and non-cardiac comorbidities, institutional factors, and a broad array of surgical techniques, should be comprehensively considered in determining the feasibility of BVR (
316). Therefore, various scoring systems, including multiple variables such as endocardial fibroelastosis and tricuspid regurgitation, have been developed to improve the predictability of successful BVR exclusively for patients with critical aortic stenosis (
4222324).
This study has several limitations. First, potential bias influencing the comparative analysis of the different groups of this study could not be completely controlled. Second, the small study population might have affected the results, including statistical significance. These two limitations are principally attributable to the retrospective nature of the study and the rare occurrence of a hypoplastic LV. A prospective controlled large-scale study is necessary to fully address these issues. Third, CT-based parameters could not be correlated with comparable echocardiographic quantitative parameters because these parameters were not included in standard echocardiographic data in our institution. Fourth, threshold-based ventricular volumes are subject to slight overestimation depending on the degree of ventricular trabeculations and the cardiac phase. Finally, this preliminary study from a single institution should be replicated by other investigators.
In conclusion, CT-based ventricular volumes and morphometric parameters may be used to predict the feasibility of SVR in children with a hypoplastic LV.
Go to :


 PDF
PDF ePub
ePub Citation
 Print
Print


 XML Download