

 PDF
PDF ePub
ePub Citation
 Print
Print


INTRODUCTION
Coronary computed tomography angiography (CCTA) is a noninvasive test with a
negative-predictive value of nearly 100% for the detection of coronary disease (1). As sufficient vascular enhancement is a prerequisite
for the accurate detection of coronary artery stenosis on CCTA, the acquisition of
diagnostic-quality images in clinical practice can be difficult (23). Intracoronary attenuation of
less than 200 Hounsfield units (HU) tends to result in significant overestimation of
stenosis, while attenuation above 500 HU can lead to a significant underestimation thereof
in smaller vessels (4). The optimal vascular
attenuation for the detection of coronary artery stenosis on CCTA is approximately 350 HU
(4).
To determine the appropriate CT number for different contrast medium (CM) protocols,
contrast enhancement on CCTA images must be predictable. The pharmacological compartment
model has been employed for contrast enhancement simulation. It applies patient
characteristics (i.e., the age, height, weight, and cardiovascular status) (56) and convolution,
based on using the test bolus (78). However, these techniques require the application of specific
algorithms. We and others (91011) recommended protocols in
which the CM dose is adjusted based on the patient's body size, or using contrast
enhancement elicited by a test bolus (712). While these techniques can be easily applied, in
some patients, we observed poor or extremely high contrast enhancement.
In the current study, we investigated whether the combined application of multiple factors,
e.g., various patient characteristics and time-density curve (TDC) factors of the test
bolus, facilitates the accurate prediction of contrast enhancement on CCTA images. We also
examined whether generalized linear regression models (GLMs) help to predict enhancement of
the ascending aorta on CCTA.
Go to : 
MATERIALS AND METHODS
This prospective study received Institutional Review Board approval; prior written informed
consent to participate was obtained from all patients.
Patients
Between April 2015 and September 2016, 227 patients were considered for inclusion in this
prospective study. In this study, we excluded patients with a left ventricular ejection
fraction of 0.30 or less on transthoracic echocardiography before CCTA. Their serum
creatinine level was obtained within 3 months prior to contrast-enhanced studies, and
their estimated glomerular filtration rate (eGFR) was calculated using the modification of
diet in renal disease formula of the Japanese Society of Nephrology (1314). Our inclusion criteria
were suspected or confirmed coronary artery disease and referral for a CCTA study for
clinical reasons, based on guidelines promulgated by the American College of Cardiology
(15). We recorded the total body weight (TBW) to
tailor the amount of CM used. We also recorded the patients' height for the calculation of
other body parameters and other demographic data (Table
1).
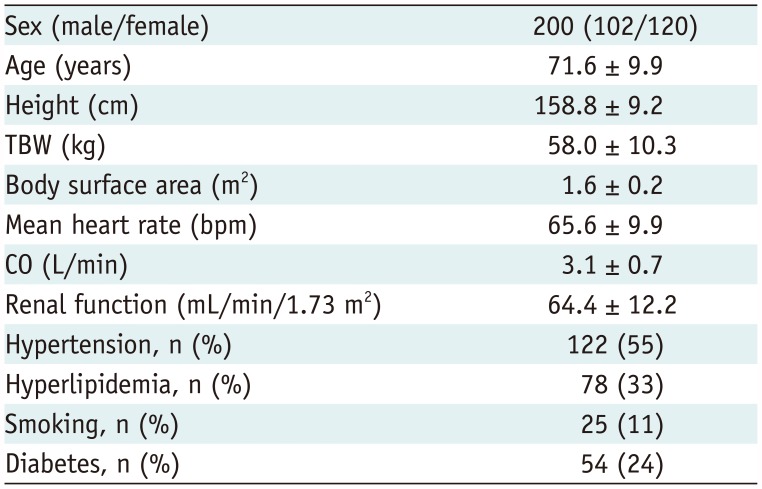
Table 1
Patients' Demographic Data
![]()
As we excluded 5 patients with renal failure (eGFR less than 30 mL/min/1.73
m2), a history of allergic reactions to iodinated CM, or proven or suspected
pregnancy, our final study population consisted of 222 patients. This included 102 males
and 120 females, ranging in age from 40 years to 95 years (mean, 71.6 years); their TBW
ranged from 30.0 kg to 83.0 kg (mean, 58.0 kg).
CT Scanning and Contrast Injection Protocols
All patients were scanned on a 64-detector row CT scanner (Lightspeed VCT; GE Healthcare,
Milwaukee, WI, USA); retrospective electrocardiography-triggered helical scans were
performed. The CT scanning parameters were 0.35-second and rotation, 0.625-mm detector row
width, 0.2 helical pitch (beam pitch), 8.0-mm table movement, 50-cm scan field-of-view
(FOV), 100 kVp, and 400–770 mA. All scans were from the top of the left atrial
appendage to the level of the inferior margin of the cardiac apex, in the craniocaudal
direction. All patients were able to hold their breaths during the examination. Image
reconstruction was performed in a 15- to 20-cm display FOV, depending on the patient's
body size. Each patient was given nitroglycerin sublingually (0.3 mg) 5 minutes before
scanning. Patients whose heart rates exceeded 65 beats per minutes after its
administration additionally received landiolol hydrochloride (Corebeta; Ono
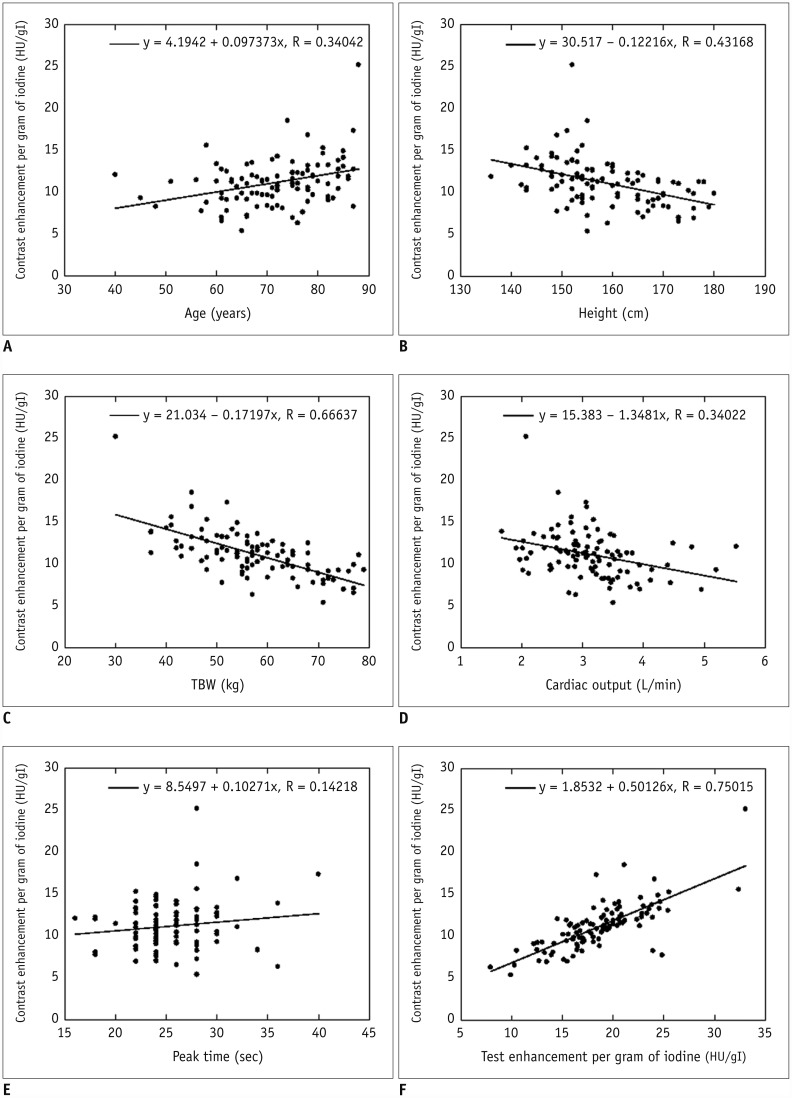
pharmacological Co., Ltd., Osaka, Japan). The injection protocols are summarized in Table 2. We injected CM (iomeprol [Iomeron]; Eisai Co.,
Ltd., Osaka, Japan) through a 20-gauge catheter into the antecubital vein using a power
injector (Dual Shot; Nemoto-Kyorindo Co., Ltd., Osaka, Japan). For the test bolus
scanning, the CM was diluted (30% contrast material, 70% saline); the injection volume and
rate were TBW × 0.6 mL and TBW × 0.05 mL/s administered for 12 seconds,
respectively. For the CCTA scanning, the injection volume and rate were TBW × 0.6
and TBW × 0.05 mL/s administered for 12 seconds, respectively. CM delivery was
followed by flushing with 20 mL of physiological saline at the same injection rate. To
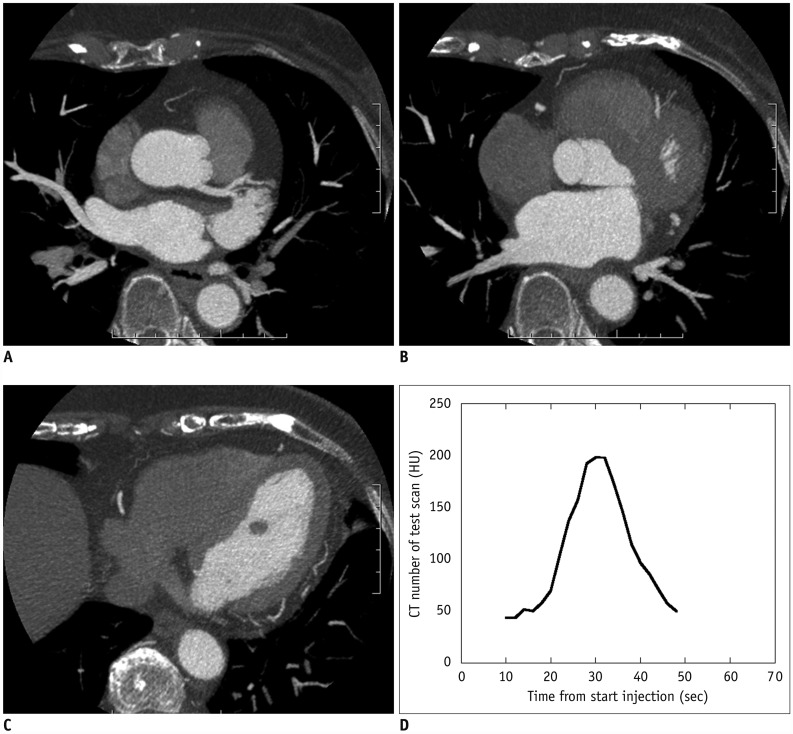
monitor the ascending aorta, we obtained dynamic low-dose (100 kVp, 50 mAs) scans; the
interscan interval was 1.0 seconds. Acquisition of the dynamic monitoring scans began 10
seconds after the start of contrast injection. A region of interest (ROI) was placed
inside the ascending aorta to obtain a time-attenuation curve for aortic peak-time
measurements. We recorded aortic peak enhancement by constructing time-enhancement curves
by connecting all time points. The arrival time in the ascending aorta was defined as the
duration from the scan delay of the test bolus injection to the time of peak aortic
enhancement. Using the arrival time data, the scan delay for CCTA was set at the arrival
time plus 2.0 seconds post-injection (16).
Table 2
Contrast Injection Protocol for Coronary Computed Tomographic Angiography Test Scan and Subsequent Scans
![]()
Data Analysis
The mean CT number (in HU) for the ascending aorta was recorded for all patients on a CT
console monitor by placement of a circular ROI cursor; the ROI diameter ranged from 10 mm
to 30 mm. CT numbers in the ascending aorta were measured on an unenhanced image of the
test bolus with acquisition for the dynamic monitoring scans and subsequent CCTA with a
standard kernel. Areas of calcification and artifacts were carefully excluded from the
ROI. The degree of contrast enhancement was expressed as the change in the CT number
(ΔHU) and was calculated by subtracting the CT number on unenhanced images from
that on contrast-enhanced images of the ascending aorta.
As in earlier studies, factors with an effect on contrast enhancement, i.e., the
patient's age, sex, TBW, and height, were recorded (1718). We acquired their age and sex from
their electronic health records. Their TBW and height were obtained immediately prior to
CCTA scanning. We measured the patients' cardiac output (CO) with a non-invasive CO
monitor (Aesculon mini; Ospyka Medical, Berlin, Germany) that continuously displayed the
CO; the average CO during 30 valid cardiac cycles was recorded.
Model Development and Validation
We developed the GLM using a combination of the independent variables that had a
significant effect on enhancement per gram of iodine on CCTA (ΔHUCCTA) (enhancement
per gram of iodine on test bolus [ΔHUTEST] and TBW) in multivariate analysis, and
also developed two conventional predicting models, using ΔHUTEST and TBW, as
controls.
Previous reports have suggested that the vessel enhancement at the test bolus is linearly
correlated to the vessel enhancement by the full bolus (910). Therefore, the predicted
ΔHUCCTA in the following equation of a given ΔHUTEST (model 1) was
calculated as follows: where ΔHU/gIave
(ΔHUCCTAave) is the average of ΔHUCCTA (HU/grams of iodine
[gI]), ΔHU/gItest-ave (ΔHUTESTave) is the average of
ΔHUTEST, and ΔHU/gItest (ΔHUTEST) is a given
ΔHUTEST (HU/gI). Previous reports have suggested that body size parameters, such as
TBW, are inversely correlated to the enhancement by the fixed amount of contrast material
(1219).
Therefore, the predicted ΔHUCCTA of a given TBW (model 2) was determined as
follows: where ΔHU/gIave is the average of
ΔHUCCTA (HU/gI), TBWave (TBWave) is the average of TBW (kg),
and TBW is a given TBW (kg).


We also developed a GLM to predict ΔHUCCTA using all independent variables
(patients' age, sex, TBW, CO, ΔHUTEST, and peak time of test). With the aid of
Akaike Information Criterion (AIC) analysis, we selected two independent variables
(ΔHUCCTA and TBW) for the predictive model. Therefore, the GLM-predicted
ΔHUCCTA, using a given ΔHUTEST and TBW (model 3), was determined as follows:
where ΔHU/gItest is a given
ΔHUTEST (HU/gI), TBW is a given TBW (kg), a and b are the estimated coefficients,
and c is a constant term.
Statistical Analysis
Statistical analyses were performed with the free statistical software “R”
(version 3.2.2; The R Project for Statistical Computing; http://www.r-project.org/). The relationship between ΔHUCCTA and the
patient's age, sex, TBW, CO, ΔHUTEST, and the peak time with the test bolus was
assessed by univariate linear regression analysis. We calculated the Pearson
product-moment correlation coefficient (r) to determine the strength of
associations. Welch's t test was used to compare ΔHUCCTA of males
and females. We also performed multivariate regression analysis to determine independent
and significant covariates that affected the ΔHUTEST values and calculated the
standardized regression coefficient (β) to assess the strength of associations.
We developed predictive models using independent factors that had significant effects on
ΔHUCCTA, and constructed GLMs using a combination of all the independent variables
in multivariate analysis. The decision to include or exclude parameters in the final model
was based on the AIC, a measure that is a function of both training error and complexity,
because additional factors may result in a better mathematical fit that yields no
additional biological information by overfitting to the training data.
To assess the validity of the models across various samples, we performed a 6-fold
cross-validation; in this process, we trained the GLMs using 185 (37 × 5) patients
and validated these models on another 37 patients. The correlation among the models with
variables independently associated with ΔHUCCTA and GLM was assessed by calculating
Pearson's correlation coefficient. Bland–Altman analysis was used to predict the
contrast enhancement errors among all models. We calculated the residual values between
the predicted values and the true values for all models. We compared residual values by
using analysis of variance (ANOVA). When the residual value was significantly different
according to ANOVA, we compared each model by using the t test with Holm
post-hoc correction.
A p value of less than 0.05 was considered to indicate a statistically
significant difference, and all interval estimations shown are 95% confidence intervals
(CIs).
Go to :
RESULTS
Univariate and Multivariate Analysis of ΔHUCCTA
As shown in Figure 1A and F, univariate linear
regression analysis revealed a correlation between the ΔHUCCTA and patients' age
(r = 0.34), and ΔHUTEST (r = 0.75). The
radiation dose for the dose-length product (mGy-cm) and scan duration of the test bolus
were 3.8 ± 1.5 mGy-cm and 10.2 ± 4.2 seconds. There was an inverse
correlation between the ΔHUCCTA and the height (r = 0.43), TBW
(r = 0.67), and CO (r = 0.34) of patients (Fig. 1B–D) and their effect on the ΔHUCCTA
(r = 0.69, p < 0.001 for all). We saw no
significant correlation between the peak time of the test bolus and the ΔHUCCTA
(r = 0.14) (Fig. 1E). The average
ΔHUCCTA was significantly higher in females than in males (34.6 ± 7.2 vs.
29.3 ± 7.0 HU/gI, p < 0.001).
 | Fig. 1Scattergrams of relationship between aortic enhancement and scan protocols using TBW for selecting iodinated contrast material dose and patient age (A), height (B), TBW (C), cardiac output (D), peak time (E), and ΔHUTEST (F).There was significant positive correlation between ΔHUCCTA and age
(r = 0.34). Inverse correlation was seen between ΔHUCCTA and TBW
(r = 0.67), height (r = 0.43), CO (r
= 0.34), and ΔHUTEST (r = 0.75) by linear regression analysis
(p < 0.01 for all). There was no significant correlation between
peak time of test bolus and ΔHUCCTA (r = 0.14, p
= 0.142). gI = grams of iodine, HU = Hounsfield units, TBW = total body weight,
ΔHUCCTA = per gram of iodine on coronary computed tomography angiography,
ΔHUTEST = per gram of iodine on test bolus
|
Multivariate linear regression analysis showed that only the TBW and ΔHUTEST
retained their independent predictive value (p < 0.001) (Table 3). Calculation of the standardized regression
coefficient revealed that the highest correlation between the ΔHUCCTA and
independent variables was observed for the TBW (β = −0.303). The strength of
association between the ΔHUTEST and the ΔHUCCTA value was β =
0.503.
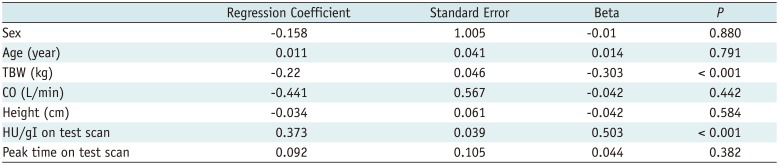
Table 3
Results of Multivariate Linear Regression Analysis for CT Number Per Gram of Iodine (HU/gI) on Coronary CT Angiography Scans
![]()
Figures 2 and 3
show the results of the 6-fold cross-validation analysis. The highest correlation
coefficient between ΔHUCCTA and the prediction values was seen in GLMs
(r = 0.75), followed by TDC (r = 0.69) and TBW
(r = 0.62). The lowest Bland–Altman limit of agreement was
observed with GLMs (mean difference −0.0 ± 5.0 HU/gI, 95% CI: −10.1,
10.1 HU/gI), ΔHUCCTA (−0.0 ± 5.9 HU/gI, 95% CI: −11.9, 11.9
HU/gI), and TBW (1.1 ± 6.1 HU/gI, 95% CI: −11.1, 13.3 HU/gI) (Fig. 3). The residual values were 3.67 ± 3.46,
4.29 ± 4.10, and 4.78 ± 4.02 for the GLM, ΔHUTEST, and TBW. There was
a significant difference in the residual value with the ANOVA test. In the post-hoc
analysis, the residual values of the GLM were significantly lower than that of the TBW
(p < 0.001) and ΔHUTEST (p <
0.001). Additionally, there was no significant difference between the residual value of
the ΔHUTEST and TBW (p = 0.129).
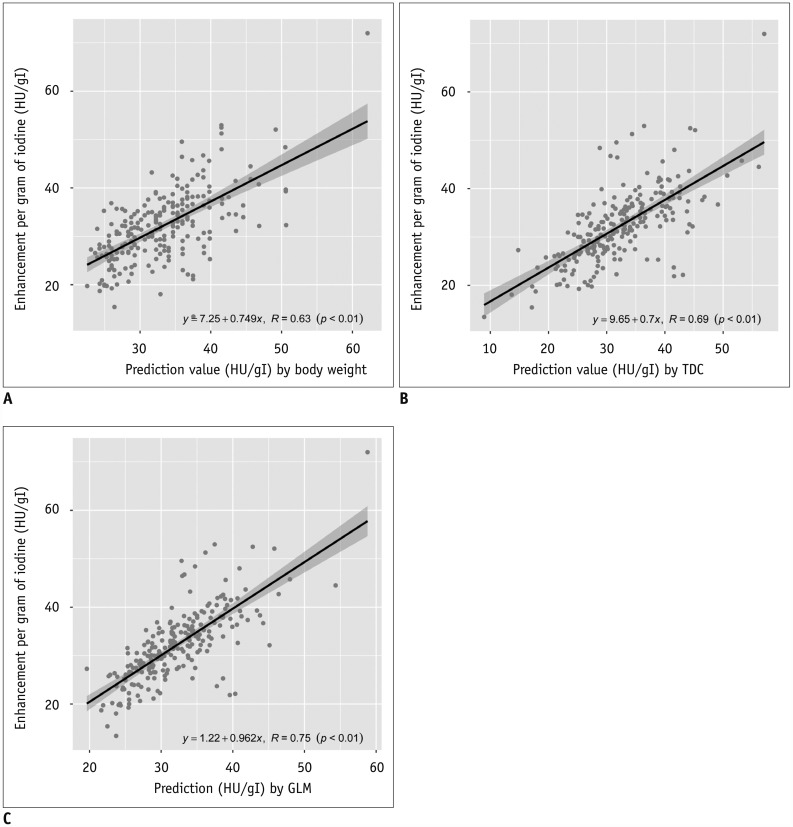 | Fig. 2Scattergrams of relationship between ΔHUCCTA and GLMs using TBW (A), TDC (B), and GLMs (C).By validation analysis, GLMs manifested highest correlation coefficient with prediction
values (r = 0.75), followed by TDC (r = 0.69) and TBW
(r = 0.62). GLMs = generalized linear regression models, TDC =
time-density curve
|
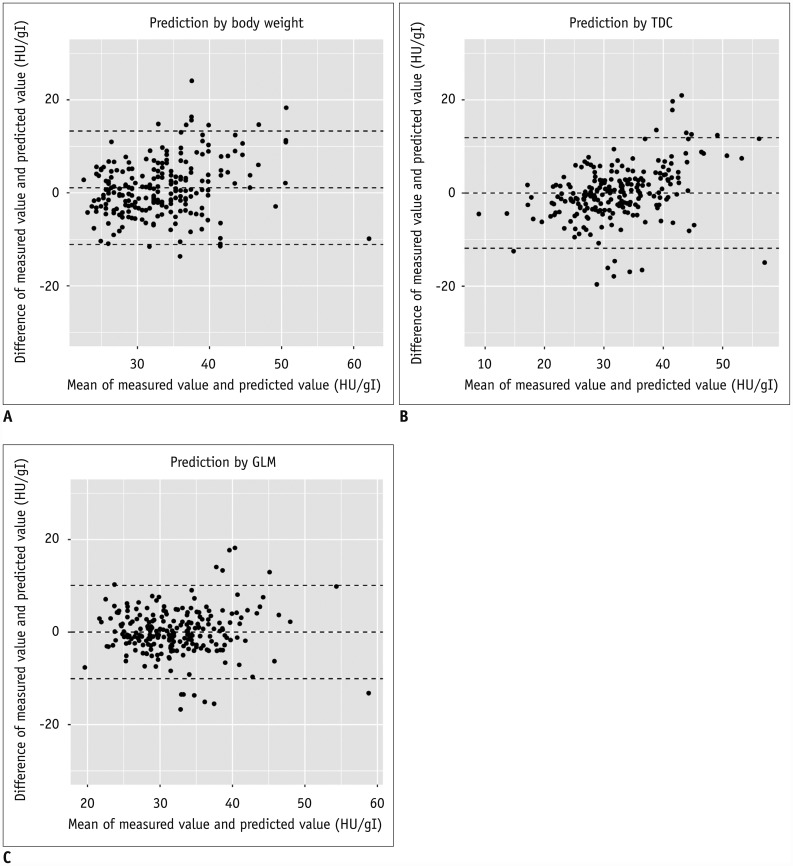 | Fig. 3Bland–Altman limit of relationship between difference in measured value and predicted value, and mean of measured value and predicted value obtained for GLMs using TBW (A), TDC (B), and GLMs (C).Lowest Bland–Altman limit of agreement observed with GLMs (mean difference
−0.0 ± 5.0 HU/gI, 95% CI: −10.1, 10.1 HU/gI), ΔHUCCTA
(−0.0 ± 5.9 HU/gI, 95% CI: −11.9, 11.9 HU/gI), and TBW (1.1 ±
6.1 HU/gI, 95% CI: −11.1, 13.3 HU/gI). CI = confidence interval
|
Finally, we calculated the final parameters of three models. In this study, the
ΔHUCCTAave was 32.2 ± 7.6 HU/gI, and the ΔHUTESTave was
44.3 ± 10.2 HU/gI; therefore, Pr was predicted by the following formula, Pr = 0.726
× ΔHUTEST with model 1. In this study, the ΔHUCCTAave was
32.2 ± 7.6 HU/gI, and the TBWave was 58.1 ± 10.4 kg; therefore,
Pr was predicted by following formula, Pr = 1870.7 ÷ TBW with model 2. If they were
estimated for all patients in this study, a was 0.012 (95% CI, 0.0011, 0.0013), b was
−0.0076 (95% CI, 0.0065, 0.087), and c was 3.36 (95% CI, 3.35, 3.37); therefore, Pr
was predicted by following formula, Pr = e0.012 × ΔHU/gItest
− 0.0076 × TBW + 3.36 with mode 3.
Figure 4 shows a representative case.
Go to :
DISCUSSION
Our multivariate analysis showed that only TBW and the ΔHUTEST maintained their
independent predictive value (p < 0.001). Our GLMs yielded a more
accurate prediction of the contrast enhancement in CCTA than did the result of the test
bolus or the patient's TBW.
According to univariate analysis, the TBW, age, sex, CO, and height of patients
significantly affected contrast enhancement. However, based on multivariate linear
regression analysis, only TBW had a significant effect on aortic enhancement, while the
other factors did not. Bae's suggestion that the CO directly affects vessel enhancement by
CM (20) appears to differ from our findings. In our
study, CO had little effect on aortic enhancement, possibly because our CM injection
duration was short. Elsewhere (12), we have reported
that, under shorter injection duration protocols, the TDC was bell-shaped, regardless of
cardiac function. This may explain why CO did not strongly influence aortic enhancement. We
included TBW and CO as independent variables in our multivariate linear regression analysis,
and suspect that they may have obscured the relationship between other independent variables
(age, sex, and height) and aortic enhancement.
The correlation between the ΔHUTEST of the ascending aorta and the ΔHUCCTA
was stronger than that with TBW. The test injection is a good indicator for predicting peak
enhancement before CCTA (1219). While CM-dose correction using TBW cannot correct for factors such
as the body-fat percentage, cardiac function, and vessel resistance, test injection allows
for the necessary corrections. In our test injection, we diluted the CM, and the amount of
diluted CM that was reported to be better for accurate prediction of contrast enhancement
than the general test bolus protocols, which use a small amount of undiluted CM (19). Therefore, we consider that our prediction model
using the ΔHUTEST predicts contrast enhancement of CCTA images more accurately than
does TBW.
Our findings also suggest that the GLMs using TBW and the ΔHUTEST more accurately
predict CM enhancement on CCTA images than do TBW or ΔHUTEST alone. In our GLMs, we
applied independent variables, i.e., the ΔHUCCTA and the TBW, which had a significant
effect on ΔHUCCTA. We also applied a combination of independent variables. While the
GLMs using ΔHUTEST were superior to those using TBW, they tended to predict higher CM
enhancement than was seen on CCTA. Svensson et al. (21), who evaluated the relationship between heart rate variability during CCTA and
the CM concentration, concluded that iso-osmolar CM does not increase the heart rate and
elicits less heart arrhythmia than low-osmolar CM. We consider that the hemodynamic changes
produced by different CM concentrations result in differences in vessel enhancement. In our
study, using the TBW may have corrected for such errors and may have resulted in our
observation that the GLMs that used a combination of the TBW and ΔHUTEST had a higher
predictive value than the other GLMs.
Our study had some limitations. First, the range and mean TBWs of our Japanese patients was
lower than those of North American and European individuals. Second, ours was a
single-center study and the study population was small. Third, our test bolus protocol used
the same CM amount as the CCTA protocol. Therefore, the prediction accuracy with respect to
contrast enhancement on CCTA images may be lower when a conventional test bolus injection is
delivered. Lastly, we did not compare our techniques with the compartment model and the
mathematical convolution technique.
In conclusion, we have demonstrated that patients' TBW and the ΔHUTEST significantly
affect contrast enhancement of the ascending aorta on CCTA images. We recommend the combined
use of clinical and test bolus data for the prediction of aortic enhancement on CCTA.
Go to :
 XML Download