

 PDF
PDF ePub
ePub Citation
 Print
Print


INTRODUCTION
In the last 2 decades, 1.5-tesla (T) cardiac magnetic resonance (CMR) imaging with adenosine stress testing has become a well-established, noninvasive diagnostic modality with high accuracy for detecting inducible myocardial ischemia consistent with significant coronary artery stenosis, compared with that using fractional flow reserve (FFR) as the reference standard (1234). Many medical institutions now have 3T MR systems. Data supporting CMR perfusion imaging as the noninvasive modality of choice for detecting myocardial ischemia have been acquired using a 3T MR system (5678). CMR perfusion imaging at 3T may be advantageous for detecting myocardial ischemia with improved image quality and fewer extended dark-rim artifacts due to increased signal-to-noise ratio, increased spatial resolution, and increased temporal resolution compared with 1.5T (78). Although the use of 3T CMR has been shown to provide higher diagnostic accuracy than that of 1.5T, this technique is of limited use because of less availability and lack of data from multicenter studies (91011). In addition, disadvantages of 3T compared with 1.5T MR imaging include more susceptibility artifacts, greater B0 field inhomogeneity, and higher local energy deposition (5). In the field, many clinical CMR studies are performed at 1.5T, and it may be difficult to decide whether 1.5T or 3T scanning is optimal for discriminating hemodynamically significant from insignificant stenosis in patients with suspected coronary artery disease (CAD) (1011). We hypothesized that 3T CMR could have better diagnostic performance for myocardial perfusion studies of significant CAD than 1.5T CMR, even in 2 different patient groups with suspected or known CAD and similar characteristics at baseline. Therefore, the aim of this study was to compare the diagnostic performance of CMR perfusion imaging at 1.5T and 3T for detecting significant CAD, with invasive coronary angiography (ICA) as the reference in patients with known or suspected CAD.
Go to : 
MATERIALS AND METHODS
Patient Population
We prospectively recruited patients with suspected or known CAD who were age ≥ 40 years and referred for ICA between September 2011 and June 2014. The patient recruitment with 1.5T CMR and 3T CMR occurred at the same time. CMR examinations were performed using both 1.5T and 3T scanners and patients were randomly assigned to 1 of 2 groups (1.5T vs. 3T) with the use of a simple randomization sheet in Microsoft Excel. We scanned all patients at 1.5T or 3T CMR, and included adenosine stress/rest perfusion and delayed contrast-enhancement imaging. We excluded patients with the following characteristics: contraindication to CMR (incompatible metallic implants or claustrophobia), previous coronary artery bypass graft surgery, unstable clinical status (including critical aortic stenosis and New York Heart Association functional class III or IV), myocardial infarction (MI) in the preceding 2 weeks, decompensated congestive heart failure (New York Heart Association functional class III or IV), deteriorated renal function (serum creatinine > 1.5 mg/dL and estimated glomerular filtration rate < 60 mL/min/1.73 m2), known allergy to iodinated contrast material, and contraindication to adenosine (including high-degree atrioventricular block, asthma, or systolic blood pressure < 90 mm Hg). Patients underwent CMR imaging in the 2 weeks before ICA without intervening change in clinical status.
The required sample size using a power analysis was 276 patients (power of 90%, α error of 0.05, sensitivity of 68%, and specificity of 71%). We enrolled a total of 290 consecutive patients in the study. This prospective study was approved by the ethics committee of our institution. All participants gave written informed consent.
CMR Protocol
We instructed patients not to drink coffee or tea and not to take oral beta-blockers for at least 24 hours before the study. We performed CMR perfusion imaging on a SignaHDxt 1.5T system (GE Medical Systems, Milwaukee, WI, USA) with an 8-element phased-array surface coil or a Magnetom Skyra 3T system (Siemens Healthineers, Erlagen, Germany) with a 32-channel body coil (Table 1). We acquired perfusion data in 3 or 4 left ventricular short-axis slices during breath-hold at end-expiration, and acquired stress images 4 minutes after we initiated the adenosine infusion at a constant rate of 140 µg/kg/min. An intravenous bolus of 0.1 mmol/kg gadopentetate dimeglumine (Magnevist; Bayer AG, Berlin, Germany) or gadoterate meglumine (Dotarem, Guerbet, France) was injected during adenosine infusion. We performed rest perfusion using a second bolus of 0.1 mmol/kg gadopentetate dimeglumine or gadoterate meglumine 10 minutes after first-pass perfusion imaging. We acquired perfusion data with the 1.5T system using a hybrid gradient echo/echo-planar pulse sequence or with the 3T system using TurboFLASH. Ten minutes later, we acquired delayed enhancement images in 2 long axes and 10–11 short axes using a 1.5T system with a phase-sensitive myocardial delayed enhancement sequence or using a 3T system with a phase-sensitive inversion recovery sequence. Inversion time was adjusted in each patient to null signal from the normal myocardium by using a look-locker sequence.
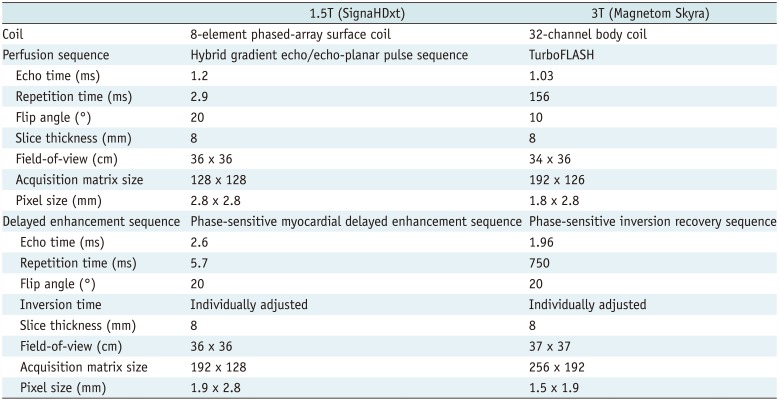
Table 1
Comparison of Scan Parameters between 1.5T vs. 3T CMR Perfusion Imaging
![]()
CMR Analysis
We reviewed CMR on a 3D workstation (Advantage Windows; GE Medical Systems or Syngo; Siemens Healthineers). We defined deficits on stress perfusion sequences as a delayed persistent enhancement pattern during the first pass of contrast medium in a coronary artery territory observed in at least 4 consecutive temporal images and at least 2 sectional images of contiguous planes. We visually analyzed the delayed enhancement images to detect hyperenhanced segments (infarcted myocardium), and defined the presence of a perfusion defect but not delayed enhancement as myocardial ischemia; we identified delayed enhancement that suggested MI in each segment. We analyzed the images from each patient using an American Heart Association (AHA) 17-segment model and 3 vascular territorial distributions (left anterior descending artery [LAD], left circumflex artery [LCX], and right coronary artery [RCA]) (8111213).
We evaluated the perfusion territories of each coronary artery LAD, LCX, and RCA during rest and stress myocardial perfusion CMR. We graded image quality with regard to artifacts and image homogeneity on a 4-point Likert scale (4 = no artifacts, uniform signal, excellent contrast; 3 = mild artifacts, signal inhomogeneity, good contrast; 2 = moderate artifacts and signal inhomogeneity, moderate contrast; 1 = severe artifacts and signal inhomogeneity, poor contrast) (81112). The analysis of the CMR occurred immediately after the patient had undergone the test. Two independent radiologists (with 14 and 5 years of experience) who were blinded to other image data as well as clinical information evaluated the images, resolving disagreements by consensus. The individual variability of coronary artery distribution could affect appropriate assignment of the culprit vessel in CMR perfusion imaging (14). Accordingly, details of the distribution of coronary arteries using ICA were used later to reassign segments to the appropriate vessel territory for CMR perfusion imaging.
ICA Protocol and Analysis
We performed the ICA (AlluraXper FD-10; Philips Medical Systems, Eindhoven, The Netherlands) in direct accordance with societal guidelines and within 14 days after the CMR examination. We obtained a minimum of 6 projections: 4 views of the left coronary artery and 2 of the RCA. We quantitatively assessed stenosis severity on ICA using commercially available software in accordance with societal recommendations (CAAS; Pie Medical, Maastricht, The Netherlands), and an experienced interventional cardiologist interpreted the ICAs. We assessed the coronary arteries according to the 17-segment modified AHA classification (315), defining significant CAD on ICA as ≥ 50% reduction in lumen diameter in the left main stem or ≥ 70% stenosis in any of the main epicardial coronary arteries or their branches with a diameter of 2 mm (8161718). ICA was used to ensure correct association of the 17 myocardial segments with the correct vascular territory for CMR perfusion imaging.
Statistical Analysis
The categorical data were presented as frequencies and percentages, and were compared using the χ2-test. The normally distributed continuous data were presented as means ± standard deviations, and were compared using the two-tailed t test for independent samples.
The primary endpoint of this study was diagnostic performance as assessed on accuracy, sensitivity, specificity, positive predictive value (PPV), and negative predictive value (NPV) of 1.5T vs. 3T CMR perfusion imaging, using ICA as the reference standard on both a per-patient and per-vessel level. We calculated sensitivity, specificity, PPV, and NPV from 2 × 2 contingency tables and calculated their respective 95% confidence intervals (CIs) using the binomial proportion. We analyzed the area under the receiver operating characteristic curve (AUC) to evaluate the discriminatory ability of 1.5T and 3T CMR perfusion imaging for the diagnosis of significant coronary stenosis, as defined by ICA. We used the kappa (κ) statistic to determine inter-modality concordance and inter-observer agreement. The appropriate sample size for the present study was assessed using power analysis. A p < 0.05 was considered statistically significant for all analyses, which we performed using SAS software ver. 9.4 (SAS Institute, Inc., Cary, NC, USA), PASS 14 (Power Analysis and Sample Size Software, Kaysville, UT, USA), and MedCalc version 10.4.8 (MedCalc Software, Mariakerke, Belgium).
Go to :
RESULTS
Baseline Characteristics
Among 290 patients, 3 could not complete the CMR scan protocol because of inability to hold a breath (n = 2) or severe chest pain during adenosine infusion (n = 1). Four patients refused ICA and 2 did not undergo ICA because of clinical reasons unrelated to the CMR findings. As a result, we included 281 (193 men, age of 62.4 ± 8.3 years) in the final analysis.
The pretest probability of CAD, defined by age, sex, and symptoms, was intermediate in 28% and high in 72% of the study population. Of the 281 patients, we scanned 135 at 1.5T and 146 at 3T, and there were no significant differences between groups in baseline clinical characteristics (Table 2).
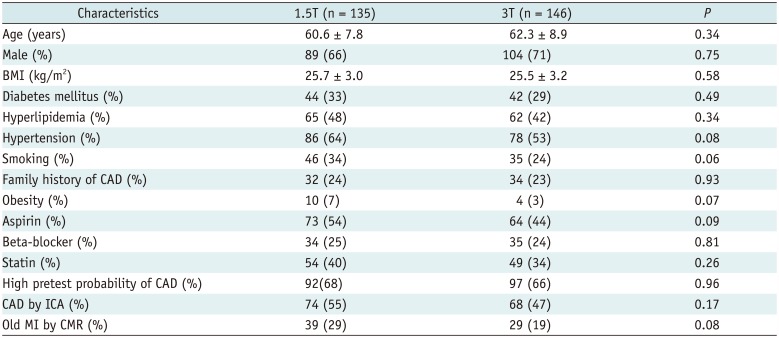
Table 2
Baseline Characteristics of Study Patients
![]()
CAD Characteristics
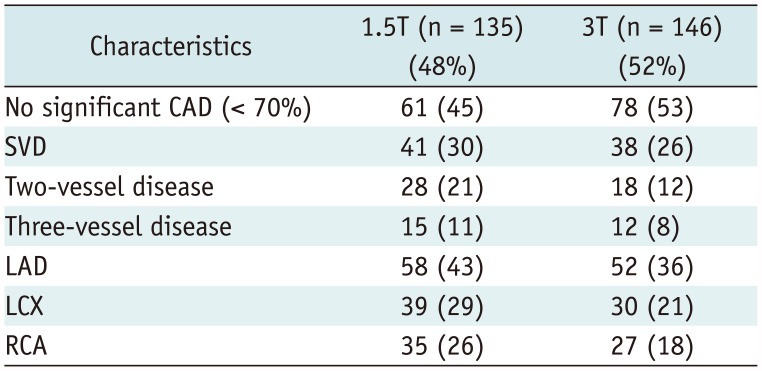
We found significant coronary stenoses and old MI in 74 (55%) and 39 (29%) patients in the 1.5T group and 68 (47%) and 29 (19%) patients in the 3T group without significant differences between the 2 groups, and there were no significant differences in the proportions of single-vessel disease (SVD) and multi-vessel disease (MVD) by ICA between groups. Additionally, the proportions of vessels with each lesion showed similar distributions in the 2 groups (Table 3).
Diagnostic Performance of CMR Perfusion Imaging on Per-Patient and Per-Vascular Territory Bases
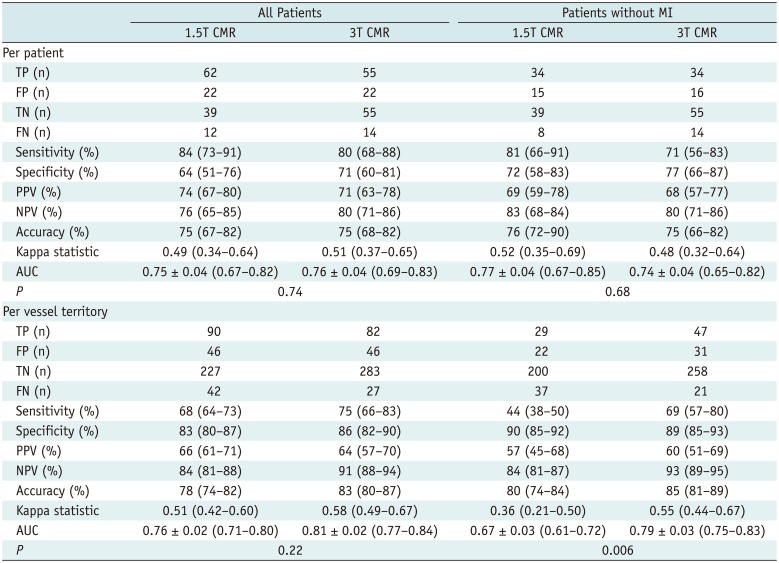
We evaluated the diagnostic performance of the 1.5T and 3T CMR perfusion imaging on per-patient and per-vascular territory bases. The sensitivity, specificity, PPV, NPV, accuracy, kappa value, and AUC for 1.5T and 3T CMR are shown in Table 4. On receiver operating characteristic analysis, no significant differences were found in AUC values of 1.5T and 3T CMR perfusion imaging for detecting significant CAD on per patient (0.75 vs. 0.76, p = 0.85 in all patients; 0.77 vs. 0.74, p = 0.68 in patients without old MI) and per vessel territory in all patients (0.76 vs. 0.81, p = 0.22). However, on vessel territory analysis in patients without old MI, the AUC of 3T CMR perfusion was significantly higher than that of 1.5T CMR perfusion (0.79 vs. 0.67, p = 0.006) (Fig. 1).
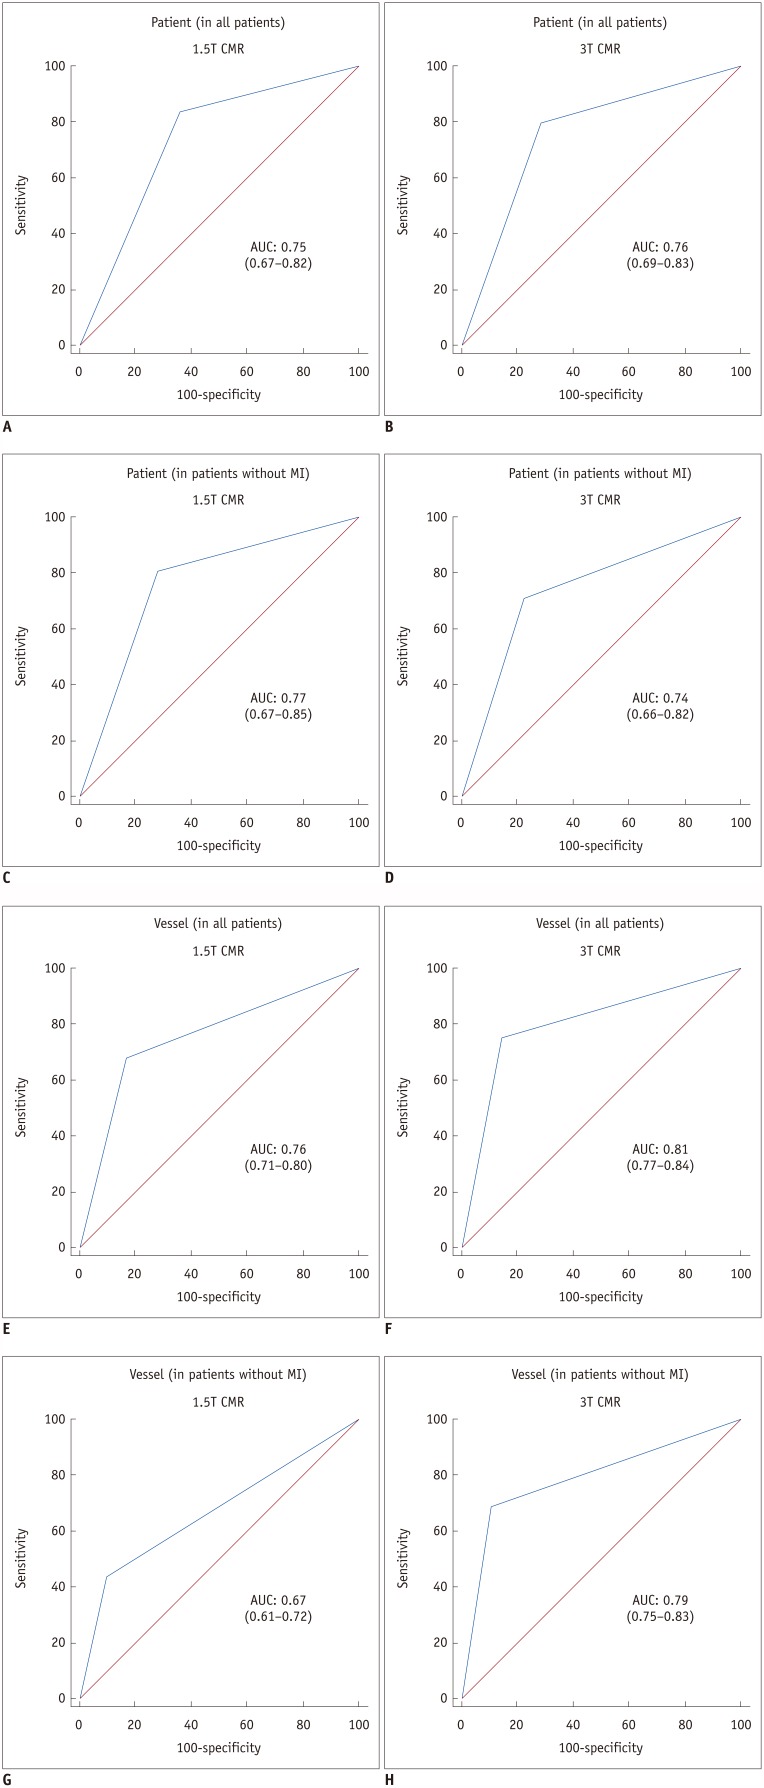 | Fig. 1AUC for 1.5T and 3T CMR perfusion.
A-D. Patient-based diagnostic performance of 1.5T (A, C) and 3T (B, D) CMR perfusion. E-H. Vessel-based diagnostic performance of 1.5T (E, G) and 3T (F, H) CMR perfusion. AUC of 3T CMR perfusion (H) is significantly greater than AUC of 1.5T CMR perfusion (G) (0.79 vs. 0.67, p = 0.006) on per vessel territory in patients without old MI. AUC = area under receiver operating characteristic curve, CMR = cardiovascular magnetic resonance, MI = myocardial infarction
|
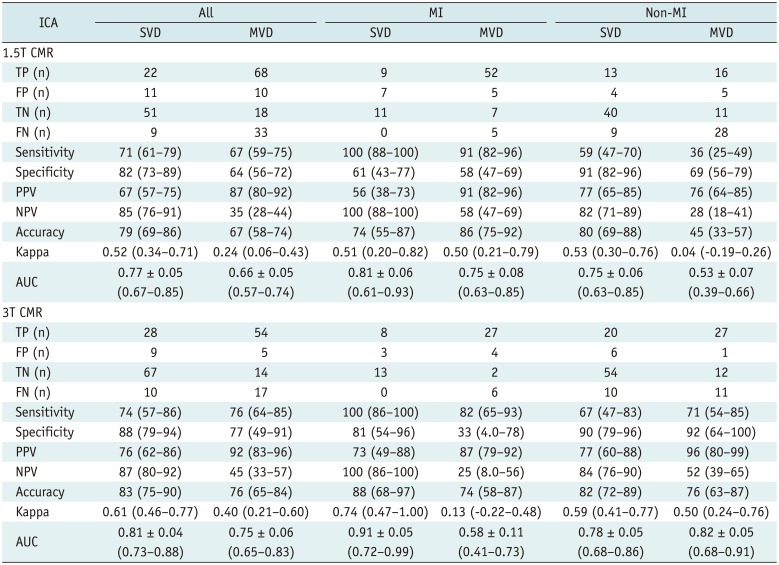
Table 4
Patient- and Vessel-Based Diagnostic Performance of 1.5T and 3T CMR Perfusion Imaging for Detecting Significant Coronary Stenoses Compared with ICA
Values for sensitivity, specificity, PPV, NPV, accuracy, kappa statistic, and AUC presented with 95% CIs. AUC expressed as mean ± standard error. AUC = area under receiver operating characteristic curve, CIs = confidence intervals, FN = false negative, FP = false positive, NPV = negative predictive value, PPV = positive predictive value, TN = true negative, TP = true positive
![]()
Subgroup Analysis of Vessel-Based Diagnostic Performance of CMR Perfusion Imaging
We divided the per-vessel diagnostic performance of the subgroups by presence or absence of old MI at 1.5T and 3T into SVD and MVD groups (Table 5). On receiver operating characteristic analysis, both 1.5T (AUC: 0.77 vs. 0.66, p = 0.13) and 3T CMR perfusion imaging (AUC: 0.81 vs. 0.75, p = 0.39) had insignificantly higher diagnostic performance in patients with SVD than in those with MVD (Fig. 2). The AUC values for SVD and MVD were 0.75 and 0.53, respectively (p = 0.01), in patients without old MI at 1.5T CMR (Figs. 3, 4), and 0.91 and 0.58, respectively (p = 0.007), in patients with old MI at 3T CMR (Fig. 3). On vessel territory analysis in patients with old MI and MVD, the diagnostic performance was insignificantly higher with 1.5T CMR than with 3T CMR (AUC: 0.75 vs. 0.58, p = 0.20). In other subgroups, the AUC values of 3T CMR were larger than those of 1.5T CMR, but only statistically significant in patients without old MI and with MVD (0.82 vs. 0.53; p = 0.001) (Figs. 3, 4, 5).
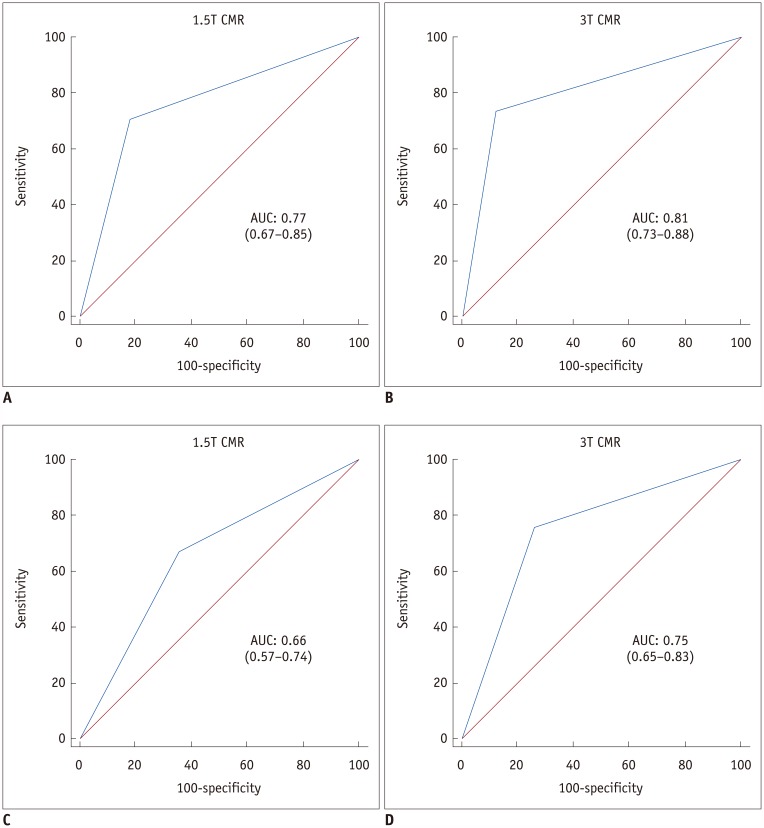 | Fig. 2AUC for 1.5T and 3T CMR perfusion according to CAD extent.AUC values of both 1.5T (A, C) and 3T (B, D) CMR perfusion imaging for detecting significant CAD are greater in patients with SVD (A, B) than in those with MVD (C, D). CAD = coronary artery disease, MVD = multi-vessel disease, SVD = single-vessel disease
|
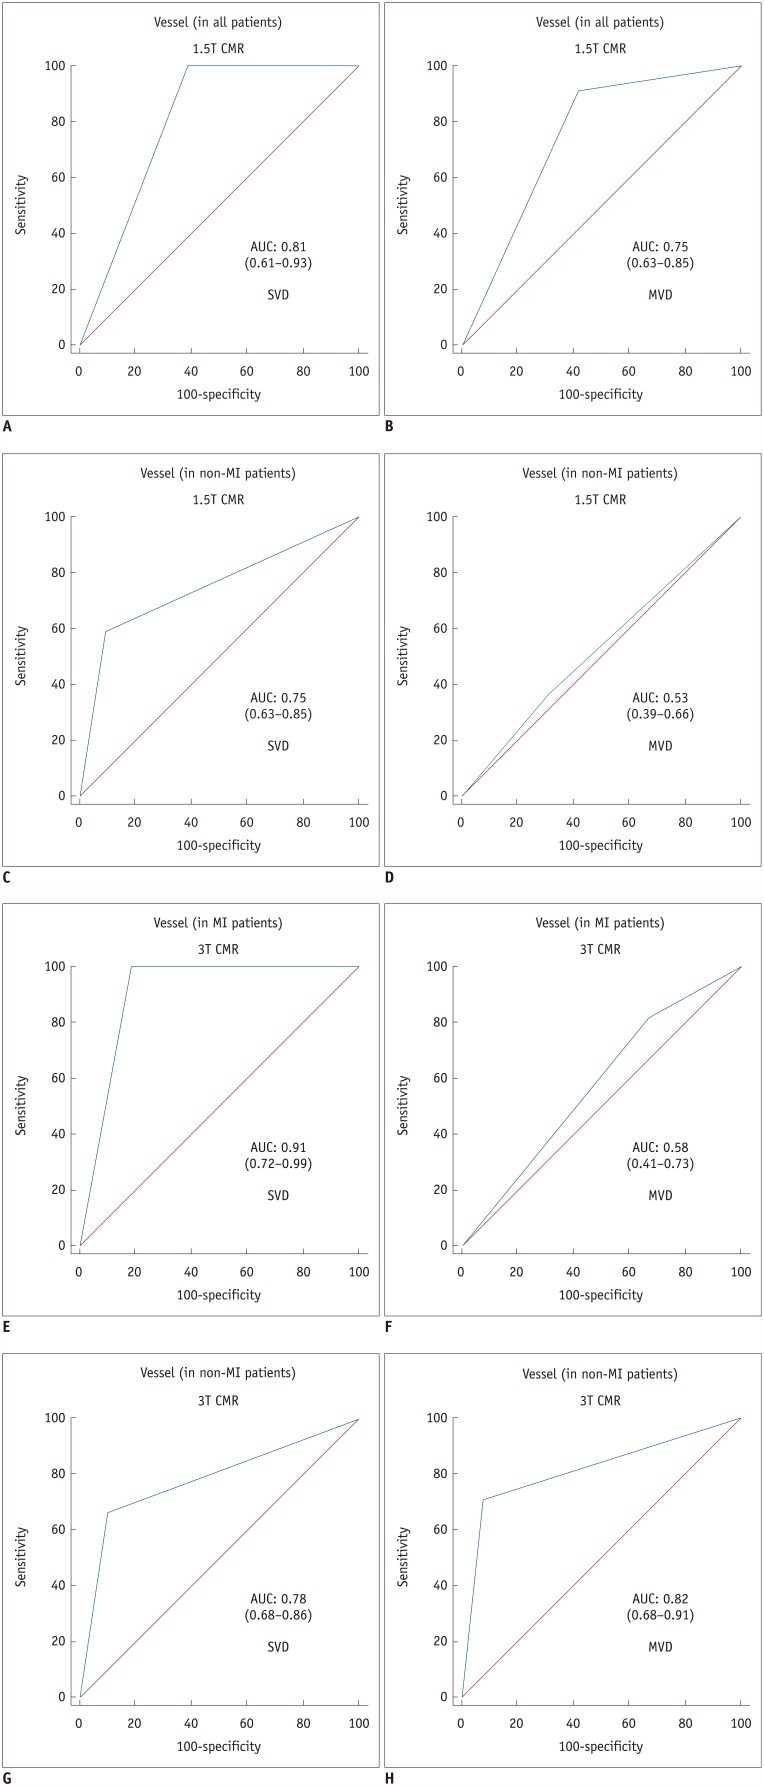 | Fig. 3AUC for 1.5T and 3T CMR perfusion according to combined CAD extent and presence or absence of old MI.1.5T CMR perfusion (C, D) had significantly greater AUC values in SVD (C) than in MVD (D) in patients without old MI (p = 0.01) and 3T CMR had significantly larger AUC values in SVD (E) than in MVD (F) in patients with old MI (p = 0.007). AUC values for 3T CMR were greater than those for 1.5T CMR, except in patients with old MI and MVD (p = 0.20) (B, F), but were only significantly greater in patients without old MI and with MVD (p = 0.001) (D, H).
|
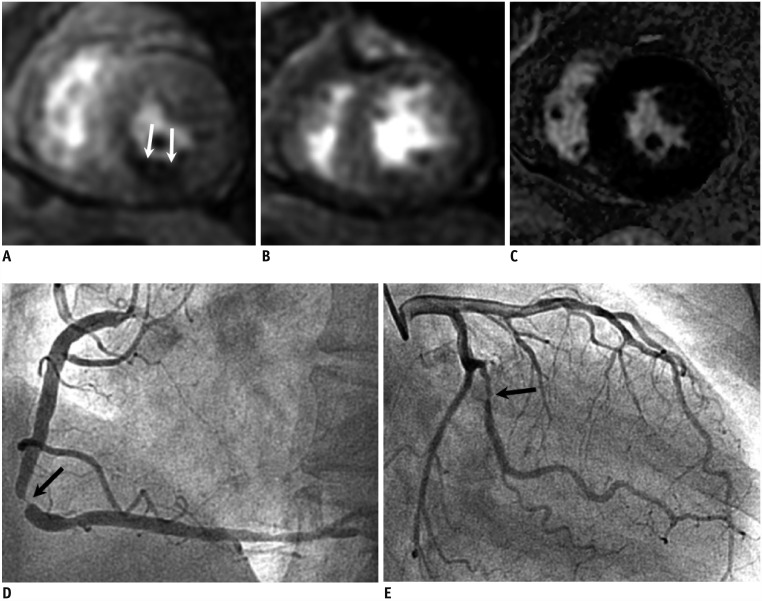 | Fig. 41.5T CMR perfusion with false negative result in MVD without MI.67-year-old female with chest pain; 1.5T CMR stress perfusion (A), rest perfusion (B), and delayed enhancement (C) images show reversible subendocardial perfusion defect at mid-inferior left ventricular wall (arrows). ICA shows severe stenosis at middle segment of right coronary artery (arrow) (D). There was also significant stenosis at large obtuse marginal branch (arrow) (E), but it was not associated with defects in CMR perfusion images. ICA = invasive coronary angiography
|
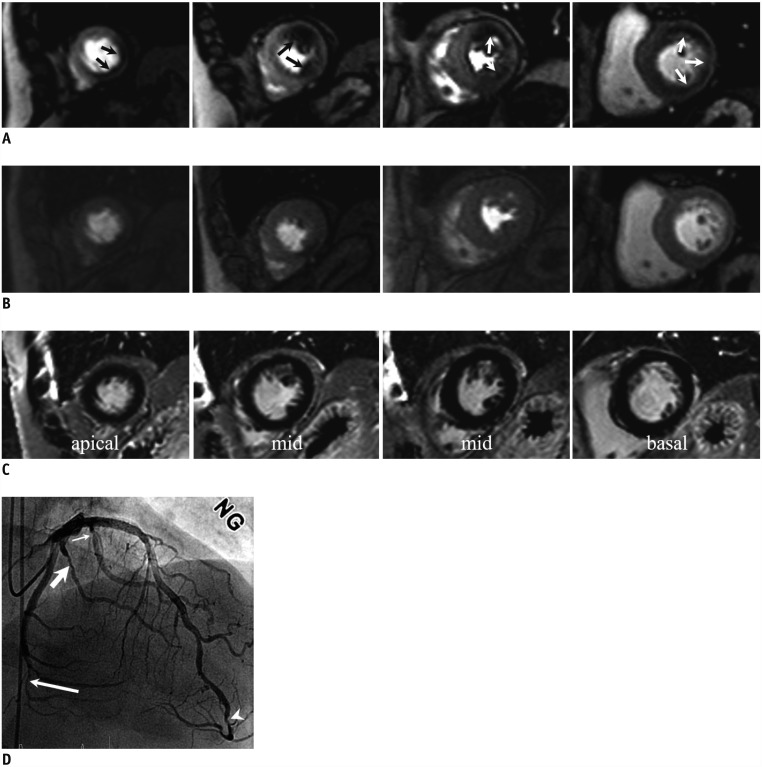 | Fig. 53T CMR perfusion with true positive result in MVD without MI.76-year-old male patient with hypertension and diabetes mellitus who had had 2 previous percutaneous coronary interventions; he had resting pain at epigastric area 2 or 3 times a month.
3T CMR stress perfusion (A), rest perfusion (B), and delayed (C) images show reversible perfusion defects at apical to mid-septal, inferior, and lateral and basal anterior, inferolateral, and inferior left ventricular wall (arrows) (A), corresponding to 3 vessel territories. ICA (D) shows multiple significant stenoses at distal LAD (arrowhead) and first (thin arrow), second (thick arrow), and fifth (long arrow) obtuse marginal branches, consistent with 2-vessel disease. However, given left coronary hyperdominance, 3T CMR and ICA coincide. LAD = left anterior descending coronary artery
|
Table 5
Vessel-Based Diagnostic Performance of 1.5T and 3T CMR Perfusion for Detecting Significant Coronary Stenoses Compared with ICA according to CAD Extent and Presence or Absence of old MI
![]()
Image Quality and Inter-Observer Variability
All perfusion and delayed enhanced images were acceptable for visual interpretation and analysis, and no images were excluded. The mean image quality scores for the LAD, LCX, and RCA territories on perfusion CMR were 3.1 ± 0.5, 3.2 ± 0.4, and 3.2 ± 0.4, respectively, at 1.5T CMR and 3.6 ± 0.4, 3.7 ± 0.2, and 3.7 ± 0.3, respectively, at 3T CMR (all p < 0.01). We observed more dark-rim artifacts at 1.5T than at 3T (59 of 135 patients [44%] vs. 43 of 146 patients [29%], p = 0.03). The κ values for inter-observer agreement on 1.5T CMR for 405 vascular territories and 3T CMR for 438 vascular territories were 0.81 (95% CI: 0.75–0.87) and 0.88 (95% CI: 0.83–0.93).
Go to :
DISCUSSION
In this study, 3T CMR perfusion showed diagnostic performance for detecting significant coronary stenoses in per-vascular territory and per-patient analyses similar to 1.5T CMR, except for higher per-vessel performance in patients with MVD and no old MI. Our findings are important in confirming that 3T CMR perfusion is feasible for the diagnosis of significant CAD in current clinical practice.
Several studies directly compared 3T CMR with 1.5T CMR without controlling the MR parameters in the same patients (91011) The diagnostic performance of 3T CMR perfusion imaging was superior to that of 1.5T CMR in detecting significant CAD, even in identifying both single-vessel and MVD (1011). However, there was no significant difference between 1.5T and 3T CMR for the overall detection of significant CAD. The higher diagnostic accuracy of 3T CMR perfusion is attributed to the combination of significant improvement in overall image quality and a significant reduction in dark-rim artifacts (7918); in the present study, none of the imaging studies was deemed non-diagnostic and 3T CMR had significantly higher image quality and fewer dark-rim artifacts than 1.5T CMR perfusion. In addition, interobserver agreement for detecting myocardial perfusion defects was higher for 3T CMR than for 1.5T CMR. Similar to previous studies (1011), the diagnostic performance of the 3T CMR in our study was superior to that of the 1.5T CMR per vascular territory (sensitivity = 68%, specificity = 83% at 1.5T CMR; sensitivity = 75%; specificity = 86% at 3T CMR) and per patient (sensitivity = 84%, specificity = 64% at 1.5T CMR; sensitivity = 80%, specificity = 71% at 3T CMR). However, the performance difference between 3T and 1.5T CMR was somewhat lower overall than in previous studies (1011) and only statistically significant on per vessel territory in patients without old MI.
In our study, we divided the patients according to presence or absence of old MI on CMR and extent of significant CAD on ICA for identifying the diagnostic influence of old MI and CAD extent on the vessel-based diagnostic performance of both 1.5T and 3T CMR perfusion. Previous studies have demonstrated that the combined analysis of algorithm perfusion imaging and delayed enhancement demonstrated better sensitivity and diagnostic accuracy for the diagnosis of significant CAD at 1.5T and at 3T than analysis of perfusion alone (1019). Delayed enhancement CMR helps distinguish true negative perfusion defects from artifacts such as matched stressrest perfusion defects and provides higher specificity for detecting significant CAD compared with perfusion alone (1018). The diagnostic performance of both 1.5T and 3T CMR perfusion imaging for detecting significant CAD was higher in patients with SVD than in those with MVD. Particularly, 3T CMR perfusion had significantly higher diagnostic performance for SVD than for MVD in patients with old MI (AUC: 0.91 vs. 0.58; p = 0.007) and was better than 1.5T CMR perfusion in patients without old MI (AUC: 0.75 vs. 0.53; p = 0.01). These findings may reflect the fact that in balanced ischemia, it is difficult to detect hypoperfused myocardial territory in MVD, and thus, more false-negative results are likely (1118). Even though 3T CMR outperformed 1.5T CMR on vessel territory analysis in patients without old MI (AUC: 0.79 vs. 0.67, p = 0.006), there was only a statistically significant difference between 3T and 1.5T CMR (AUC: 0.82 vs. 0.53; p = 0.001) in patients with MVD. This finding is in concordance with previous studies and may be attributed to the higher signal-to noise ratio with 3T CMR than with 1.5T CMR (59).
This study was subject to the limitations inherent to a single institution and highly-selected patients; the high prevalence of CAD in our study may have influenced the PPV and NPV values for the tests we conducted. Second, there are some weaknesses in the study design for the comparison between 1.5T and 3T systems because of differences between 8-channel coils (1.5T) and 32-channel coils (3T), different sequence types for different field strengths, and different spatial resolutions for field strengths. Third, we did not perform other functional studies such as FFR or single-photon emission computerized tomography (17202122) to compare diagnostic performance. Instead, we used a cut-off threshold of 50% left main stenosis or 70% stenosis of epicardial coronary arteries with a diameter of 2 mm on ICA (8161718). That is, our anatomical reference could have compromised the study results. Finally, the assessment of perfusion defects was based on only visual rather than quantitative analysis (16).
In conclusion, 3T CMR perfusion imaging has similar diagnostic performance to 1.5T in detecting significant CAD, except for higher performance in patients with MVD and without old MI. From this point of view, additional research such as a multicenter prospective study is needed to confirm the diagnostic value of 3T CMR compared with that of 1.5T CMR.
Go to :
 XML Download