Abstract
The use of lower extremity tourniquets for procedures of the lower leg is considered routine in orthopedic surgery, but. lower extremity tourniquets do harm occasionally. While the tourniquet is inflated, metabolic changes such as increased PaCO2, lactic acid, and serum potassium and decreased level of PaO2 and pH occur in the ischemic limb. Deflation of tourniquet results in release of anaerobic metabolic products during ischemia into systemic circulation. In this ischemia/reperfusion situation, oxygen free radicals could potentially be produced during the reperfusion period by several mechanisms. One of these mechanisms is release of intracellular superoxide or hydrogen peroxide by activated neutrophils in the area. These reactive oxygen species(ROS) could be a causative factor for the postreperfusion no-flow, lung injury, induction of tourniquet shock, etc. The purpose of this clinical study was to investigate the effect of tourniquet deflation on the hemodynamic changes, changes of blood gas analysis, and hydrogen peroxide production using flow cytometric analysis of fluorescent DCF(Dichlorofluorescein). Quantitative analysis of fluorescent DCF was performed in resting and fMLP(N-formyl-methyonyl-leucyl-phenylalanine) or PMA(phorbol myristate acetate) stimulated neutrophils. Also differences of these factors between two groups of tourniquet time, one is less than one hour and the other more than one to two hours, were analysed. The hemodynamics (blood pressure, pulse rate), arterial P02, bicarbonate, base excess, and hydrogen peroxide production showed no significant change before and after tourniquet release(p>0.05). Arterial pH and PaCO2 decreased significantly until 10 and 5 minutes after tourniquet release, respectively(p<0.05).
Tourniquet time didn’t reveal any significances differences. These results indicate that tourniquet application with 400mmHg pressure and less than 2 hours does not release significant hydrogen peroxide into systemic circulation during reperfusion period after tourniquet release.
Go to : 
REFERENCES
1. Rang HJ, Han CD, Jahng JS, Ko So. Blood gas and electrolyte changes after tourniquet application in total knee replacement surgery. Yonsei Med J. 1992; 32:153–8.

3. Bass DA, Parce JW, DeChatelet LR, Szejda P, Seeds MC, Thomas M. Flow cytometric studies of oxidative product formation by neutrophils:a graded response to membrane stimulation. J. Immunol. 1983; 130:1910–7.
5. Bucana C, Saiki l, Nayer R. Uptake and accumulation of the vital dye hydrocthidine in neoplastic cells. J Histochem Cytochem. 1986; 34:1109–13.
6. De Chatelet LR. Inhibition of the respiratory burst in human polymorphonuclear neutrophils, a clinical review. J Reiiculoenlholhel Soc. 1978; 24:73–7.
7. Eckhoff NL, Lond MS. Eng FRCS : Tourniquet paralysis. Lancet, 2:343-5, 1931.8). 1986; Forman HJ Thomas MJ;Oxidant production and bactericidal activity of phagocytes Ann Rev Physiol: 48:669–80.
10. Keston AS, Brandt R. The flurometric analysis of ultramicro quantities of hydrogen peroxide. Anal Biochem,. 11:1–5. 1965.
12. Rossi F, Dri P, Bellavite P, Zabucchi G, Berton G. Oxidative metabolism of inflammatory cells. Adv inflammation Res. 1979; 1:139–44.
13. Rudge P. Tourniquet paralysis with prolonged conduction block. J Bone Joint Surg. 56B:1974; 716–20.

14. Simonson SG, Zhang J, Canada AT, Su YF, Benveniste H, Piantadosi CA. Hydrogen peroxide production by monoamone oxidase during ischemia-reperfusion in the rat brain. J of Cerebral blood flow and metabolism,. 1993; 13:125–134.
15. Solonen KA, Tarkkanen L, Narvanen S, Gordin R. Metabolic changes in the upper limb during tourniquet ischemia. Acta orthop Scand. 39:1968; 20–32.
16. Thomas G, Roques B. Proton magnetic resonance studies of ehtidium bromide and its sodium borohy-dride reduced derivatives. FEBS Lett. 1972; 26:169–73.
Go to : 
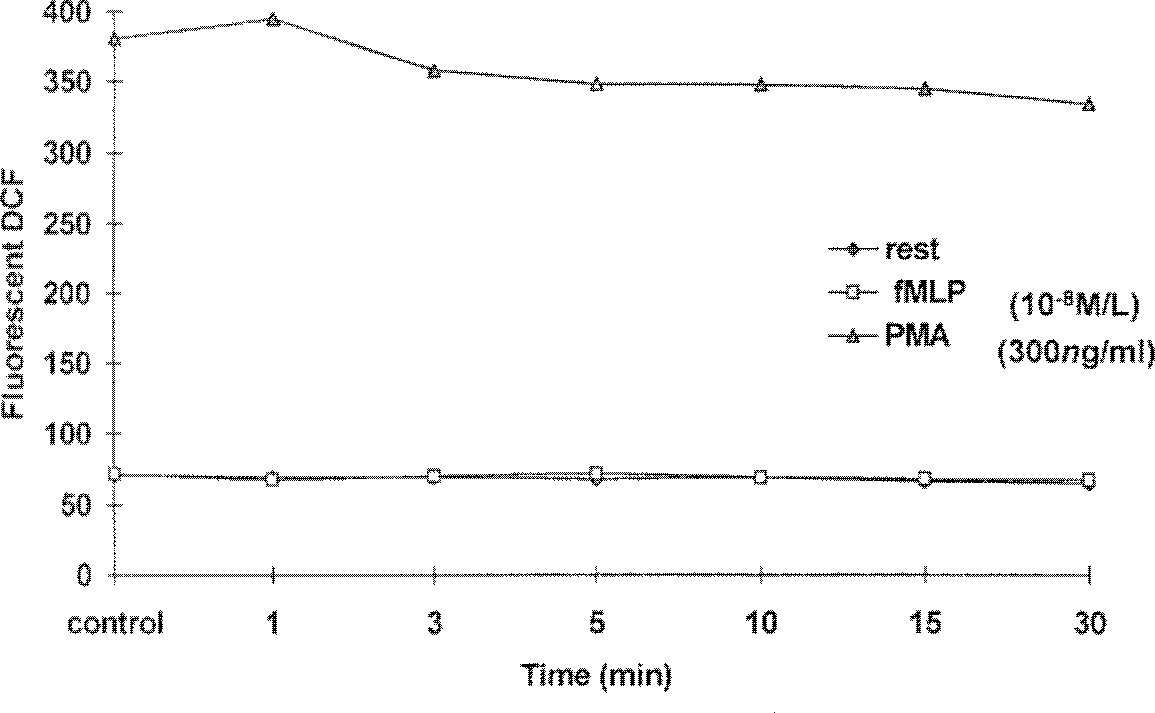
 | Fig. 1Time course of increasing fluorescent DCF in resting and stimulated PMNL(poly morphonuclear leukocyte), this figure shows there is no difference of hydrogen per oxide production expressed as fluorescent DCF before and after tourniquetrelease. fMLP(10-8 M/L):N-formyl-methyonyl-luecyl-phenylala nine PMA(300 ng/ml/): Phorbol myritate acetate |
Table 2
Changes of Vital Signs Before and After Tourniquet Release
| BTR | 1 min | 3 min | 5 min | 10 min | 15 min | 30 min ATR | |
|---|---|---|---|---|---|---|---|
| BP(S) | 124±4 | 113±4 | 114±3 | 114±3 | 122±4 | 120±3 | 122±5 |
| BP(D) | 74±3 | 67±2 | 67±2 | 67±2 | 72±3 | 76±3 | 75±3 |
| PR | 78±4 | 79±3 | 79±4 | 78±4 | 80±4 | 79±4 | 77±3 |
Table 3
Changes of ABGA Before and After Tourniquet Release(FiO2=0.5)
| BTR | 1 min | 3 min | 5 min | 10 min | 15 min | 30 min ATR | |
|---|---|---|---|---|---|---|---|
| pH | 7.37 ±.01 | 7.32 ±.01* | 7.30 ±01* | 731 ±.01* | 7.32±.01* | 7.34±.02 | 7.35 ±.02 |
| PCO2 | 35.7 ±2.8 | 41.9±4.8* | 42.4±3.3* | 42.0±5.5* | 40.0± 4.5 | 37.8±3.4 | 36.2 ±2.4 |
| PO2 | 233±8 | 217± 9 | 232 ± 7 | 228 ± 9 | 230± 11 | 253 ± 10 | 247± 15 |
| HCO3 | 18.8 ±0.9 | 19.1 ±0.91 | 18.8±0.9 | 18.3 ±0.9 | 18.2±0.9 | 18.3 ±1.2 | 18.8± 1.0 |
| BE | -1.2±1.5 | -1.5 ± 2.0 | -1.4±1.1 | -1.4±2.0 | -1.6±1.9 | -2,1 ±2.4 | -1.9± 1.3 |
Table 4
Time Course of Increasing Fluorescent DCF in Resting and Stimulated Neutrophil


 PDF
PDF ePub
ePub Citation
 Print
Print


 XML Download