

 PDF
PDF ePub
ePub Citation
 Print
Print


INTRODUCTION
Since chairside computer-assisted design/computer assisted manufacturing (CAD/CAM) systems have enjoyed a significant evolution in the capability and efficiency, several CAD/CAM systems have been introduced, confirming the increased interest in the chairside digital workflow.1
So far, different hybrid materials are currently on the market.2 These materials are also known as “resin-matrix ceramics” and comprise materials with an organic matrix highly filled with ceramic particles.3 Nano-resin ceramics, high-density composite resin materials, and the polymer-infiltrated-feldspathic ceramic-network material are the examples of dental hybrid restorative materials. The main advantages of hybrid materials are easier milling and adjustment than glass-matrix ceramics or polycrystalline ceramics, similar modulus of elasticity to dentin when compared to traditional ceramics, and easier repair or modification with composite resin.3
In this context, hybrid CAD/CAM materials are classified as composite resins.4 However, there are numerous in vitro studies about recently introduced CAD/CAM composite materials as alternative materials to glass ceramics.5678
With the developments in nanocomposite technology, not only mechanical and physical properties of composite materials are improved but also color characteristics and optical characteristics are affected.910 Because more dentists work independently of a technician, better understanding of the optical characteristics of novel materials is essential in order to obtain close match with the natural tooth.9
When light encounters a translucent substance such as tooth or esthetic material, some of the light is absorbed and some of it is scattered.1112 Four phenomena can be described associated with the interaction of an aesthetic material with light flux: (1) specular transmission of the light flux through the material, (2) specular reflection at the surface of the material, (3) diffuse light reflection at the surface, and (4) absorption and scattering within the material.1314 The inherent color and translucency are largely determined by the visible spectra of absorption and scattering of light within the material in combination with the spectra of the illumination.15 Therefore, optical scattering of esthetic materials has been widely studied because of its significant effects on their color, surface gloss, and translucency.111617181920212223 In this context, surface gloss is one of the desirable characteristics for aesthetic restorative materials to mimic the appearance of the enamel.
Another important factor influences the optical properties of a resin based composite material is the resin formulation.21 For this reason, resin based materials with different formulations might exhibit differences in color parameters and translucency. Furthermore, the filler size, shape, and loading fraction are other important parameters affecting the optical characterization of novel aesthetic materials.22
It is well known that the type, thickness, composition, curing protocols, and polishing methods of resin composites influence the color characteristics of the restorations.16 On the other hand, color characteristics of novel resin based materials such as hybrid ceramics is still not fully known. Therefore, the aims of this study were (1) to derive and compare each of the inherent color parameters (hue angle, chroma) amongst selected shades and brands of three hybrid CAD/CAM blocks, (2) to derive and compare the translucency parameters amongst these materials, and (3) to determine and compare the surface gloss (ΔE*SCE-SCI) and surface roughness (Ra) of the these novel resin based materials.
The major null hypotheses were:
There is no difference in any inherent color parameters such as hue angle and chroma of the tested materials.
There is no difference in the translucency parameters amongst the tested materials.
There is no difference in the surface roughness values and surface topographies amongst the tested materials.
Go to : 
MATERIALS AND METHODS
A nano-resin ceramic material (Lava Ultimate), a high-density composite resin material (GC Cerasmart), and a polymer-infiltrated-feldspathic ceramic-network material (VITA Enamic) were selected for the study. Tested materials, group codes and their compositions are given in Table 1. Square-shaped (12 × 12 mm2) specimens with different thicknesses (0.50, 0.70, 1.00, 1.50, and 2.00 mm, n = 5 of each thickness) and shades (A1-HT, A1-LT, A3-LT for CS and LU; 1M1-HT, 1M1-T, 3M2-T for VE) were prepared using a precision cutting machine (IsoMet 1000, Buehler, Lake Bluff, IL, USA). A total of 225 specimens were prepared. Each specimen was polished with metallographic SiC papers (FEPA #800, 1200, 2400, 4000). The final thickness (± 0.01 mm) was measured with a digital caliper (Mitutoyo Corp, Kanogawa, Japan). The specimens were then ultrasonically cleaned (Quantrex 90, L&R Ultrasonics, Kearny, NJ, USA) for 10 minutes in deionized water in sequence and air dried for 20 seconds before testing.
Table 1
Tested materials, group codes, and their compositions
![]()
The color parameter measurements of each specimen were performed according to the CIE (International Commission on Illumination) L*a*b* color scale relative to the CIE standard illuminant D65, which corresponds to “average” daylight (including ultraviolet wavelength region with a correlated color temperature of 6504K), by using a reflection spectrophotometer (CM-700d, Konica Minolta Sensing, Inc., Osaka, Japan) on the black and white backgrounds with SCE and SCI geometries.24 Zero and white calibrations of the equipment were done immediately before each set of measurements using calibration platen and the software of the device (Spectra-Magic Version 2.11, Konica Minolta Sensing, Inc., Osaka, Japan).
Diffuse illumination and a viewing condition of diffuse/8° geometry were used and the specular component was excluded for the hue angle and chroma evaluations.15 For transmittance measurement, diffuse/0° illumination/measurement geometry was selected, and the regular component was included.15 Moreover, for surface gloss measurement, 0°/diffuse illumination/measurement geometry was selected. A 3-mm-diameter aperture was provided for the diffuse illumination, and a 3-mm-diameter measurement area was used.
Five measurements from 5 different areas (centers and each corner of the specimens) were performed for each evaluation. Thereafter, spectrophotometric measurements L*, a*, b* were obtained from each specimen.
The hue angle (h degrees) was calculated using the following equation25:
Chroma, which enabled the differentiation of pale and strong colors, was defined as the radial component of the cylindrical coordinates CIE L*a*b* and calculated using the following formula25:
The translucency values (TP) of the tested materials with various thicknesses were obtained by using the spectrophotometer in SCI mode, over black and white background and calculated according to the following formula:
where the subscript W refers to the color coordinates over the white background and the subscript B refers to those over the black background.26
Differences in ΔE*SCE-SCI values were calculated by the equation as follows11:
The surface roughness of each tested specimen was measured by white light interferometry (Contour GT-K1, Bruker Nano GmbH, Berlin, Germany). A 50× objective lens and a 1.0 multiplier was used, with back scan and length parameter of 20 µm and 20 µm in VSI/VXI mode to obtain a 3D rendering of the specimen surfaces. The Vision 64 software (Bruker Nano GmbH, Berlin, Germany), which is part of the GT-K1system, was used to generate surface areas and roughness parameters. The particular parameter of interest was considered to be Ra (roughness average) measured from a mean line within the sampling length.
Surface examinations were performed from two specimens for each tested material by scanning electron microscopy (SEM). Briefly, the specimens were mounted in aluminum stubs and dehydrated overnight under vacuum in a desiccator. Then, they were gold-coated (Balzers SCD 050 sputter coater; B.U.A., Fürstentum, Germany). The SEM ultra-morphological analysis was executed through SEM (JSM-5500LV; JEOL Ltd., Tokyo, Japan) at 15 kV and 20 mm work distance.
Data were analyzed using statistical software SPSS (Statistical Package for Social Science) version 16 (SPSS Inc., Chicago IL, USA). First, normality of data distribution was tested using the Shapiro-Wilk test. Second, since the pooled data of hab*, Cab*, TPSCI, ΔESCE-SCI and Ra were not distributed normally, two statistical tests were used: the Kruskal-Wallis, which is a non-parametric method for testing average equality of measures among groups, and the Mann-Whitney U test, which is a non-parametric test that enables the pairwise comparison of two distributions for the analysis of the variations in hab*, Cab*, TPSCI, ΔESCE-SCI and Ra data. The results of statistical analyses with P values less than 0.05 were interpreted as statistically significant. In addition, non-parametrical correlations according Spearman-Rho was calculated to observe the effect of thickness on hue angle, chroma, and translucency of the tested materials.
Go to :
RESULTS
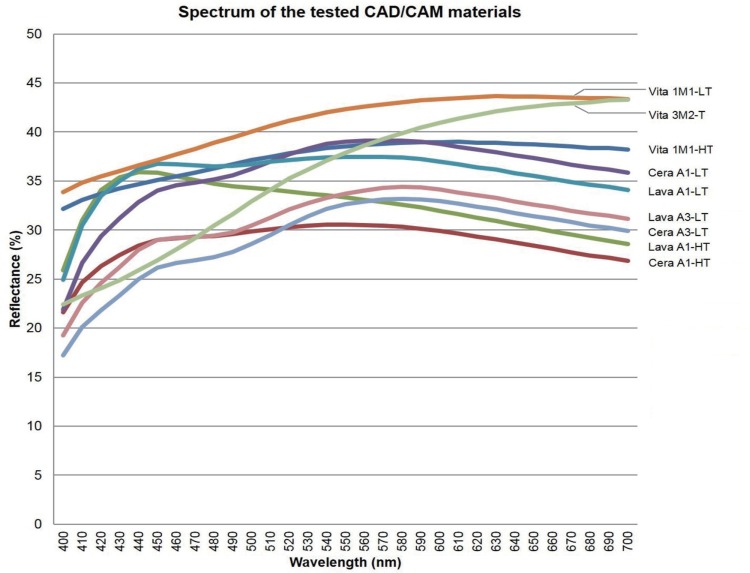
The visible (400 – 700 nm) reflectance spectra for tested specimens illustrating variations in their reflectance is shown in Fig. 1.
Intergroup analysis showed that hab* and Cab* values of CAD/CAM polymer based composites were influenced by the material type, material shade, and material thickness (P < .001).
When overall hab* values were taken into consideration, the order amongst the tested materials were as follows LU > CS > VE. Further, an evaluation of the multiple interactions between the shade and thickness parameters showed that hab* values were in the following order LU > CS > VE in all shades and all thicknesses, except 1 mm specimens in A3-LT shade. Briefly, hab* values of the materials in A3-LT shade and 1 mm thickness were ordered as: CS ≥ LU > VE (Fig. 2A).
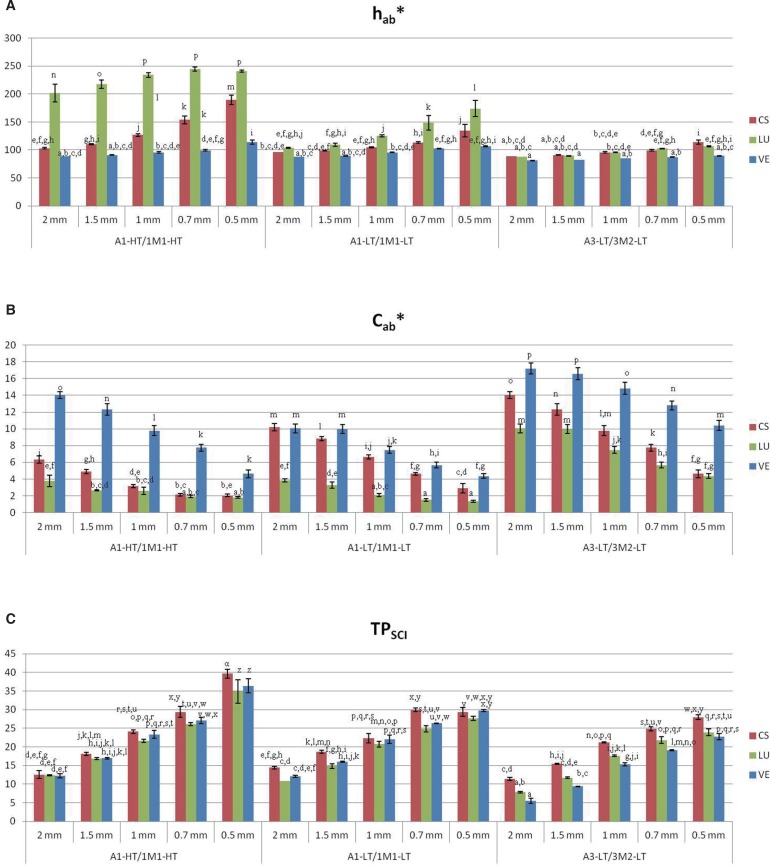
The overall results of Cab* values showed that the order amongst the tested materials were as follows VE > CS > LU. Furthermore, multiple interactions between the shade and thickness parameters demonstrated that Cab*values were ordered as VE > CS > LU in all shades and all thicknesses, except 0.7 mm specimens in A1-HT and A1-LT shades and 0.5 mm specimens in A1-HT and A3-LT shades. Cab* values of the tested materials with 0.7 mm thicknesses in A1-HT shade were ordered as CS ≥ LU > VE; on the other hand, the order in A1-LT shade was as follows CS ≥ VE > LU. On the other hand, Cab* values of the tested materials with 0.5 mm thicknesses in A1-HT shade were ordered as CS ≥ VE > LU; on the other hand, the order in A3-LT shade was as follows VE > CS ≥ LU (Fig. 2B).
TPSCI results demonstrated significant differences in terms of material types (X2 = 14.022; P = .001) and material thicknesses (X2 = 111.269; P < .001). No difference was detected amongst the shades (X2 = 4.353; P = .113). The overall TPSCI results of tested materials were in the following order CS ≥ LU > VE.
Multiple interactions amongst the shade and thickness parameters showed that TPSCI values of the tested materials were ordered as LU > CS > VE in all shades and all thicknesses, except the specimens with 1 mm thicknesses in A3-LT shade, 0.7 mm thicknesses in A1-HT and A3-LT shades, and 0.5 mm thicknesses in A1-HT shade. In those groups, TPSCI values of the specimens with 1 mm thicknesses in A3-LT shades were ordered as follows CS ≥ LU > VE according to material type. The order of the tested materials in the specimens with 0.7 mm thicknesses in A1-HT shade was LU ≥ CS > VE; in A3-LT shade, CS ≥ LU > VE. Additionally, TPSCI values of the specimens with 0.5 mm thicknesses in A1-HT shade were ordered as CS > LU ≥ VE according to the material type (Fig. 2C).
Mean and standard deviation of the ΔESCE-SCI and Ra parameters in each test group are given in Table 2. Statistical analysis showed that material type (X2 = 59.143; P < .001) and material shade (X2 = 9.317; P < .05) significantly affect ΔESCE-SCI values; however, material thickness does not affect the ΔESCE-SCI results (X2 = 2.290; P = .683). Further, the order amongst the materials were as follows LU > VE ≥ CS and amongst the shades, A1-HT/1M1-HT ≥ A3-LT/3M2-T ≥ A1-LT/1M1-T.
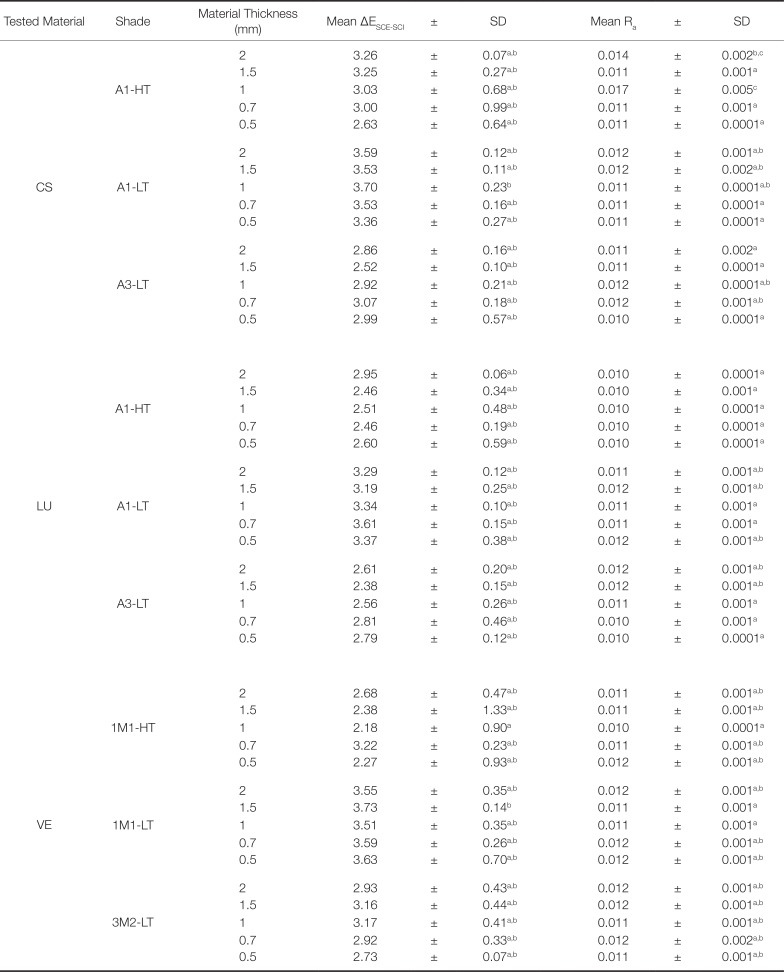
Table 2
Mean and standard deviation of the ΔESCE-SCI and Ra parameters in each test group. Different superscript letters indicate statistical difference inside the respective column (P < .05)
![]()
Statistically significant differences were found in Ra results amongst the materials (X2 = 11.640; P < .05) and amongst the shades (X2 = 12.816; P < .05). However, there was no statistically significant difference in Ra values amongst the material thicknesses (X2 = 5.561; P = .234). Furthermore, Ra values of the tested materials from the highest to the least were CS ≥ VE > LU. Additionally, the Ra data amongst the shades were in the following order A1-LT/1M1-T ≥ A3-LT/3M2-T ≥ A1-HT/1M1-HT.
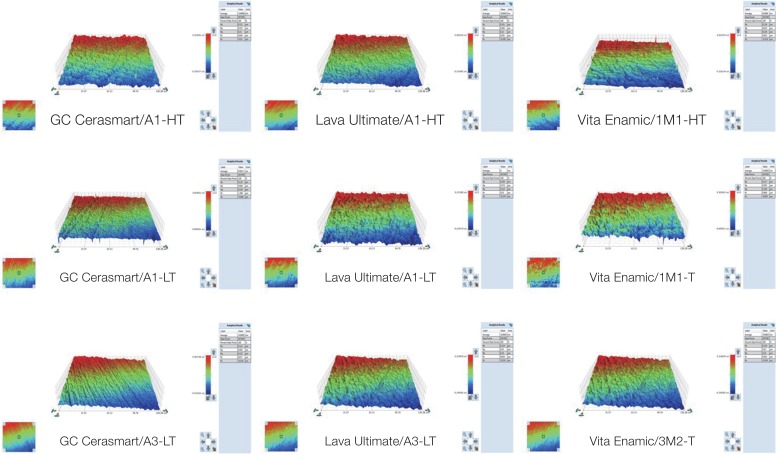
The representative white light interferometer microscope images of tested CAD/CAM materials with 1 mm thicknesses in each selected shade can be seen in Fig. 3. The red areas represent the part of the surface with the highest height, the peaks, and the blue areas represent the part of the surface with the lowest height, the valleys. All of the tested specimens showed the patterns of peaks and valleys across the surfaces that varied in height. The surface characteristics of the tested materials also varied, which resulted in different surface patterns. These patterns were not identical across each surface. Moreover, microscopic images for CS demonstrated a moderate irregular surface with heights and valleys. Narrow, deep scratch lines crossed the surfaces causing an irregular area were observed. However, LU showed smoother surface with randomly located pores. A low profile, interrupted by randomly located rounded-off projections, characterized the material surface. On the other hand, VE specimens had non-uniform surface with distinct sharp projections dotted with pores (Fig. 3).
Non-parametric correlations for intra-group analysis demonstrated a strong and negative correlation between thickness and Cab* results (ϱ = −0.705, P < .0001). In addition, a strong positive correlation was found between thickness and hab* (ϱ = 0.727, P < .0001) and TPSCI (ϱ = 0.907, P < .0001) results. The correlation statistics for all selected shades of tested CAD/CAM composite materials are given in Table 3.
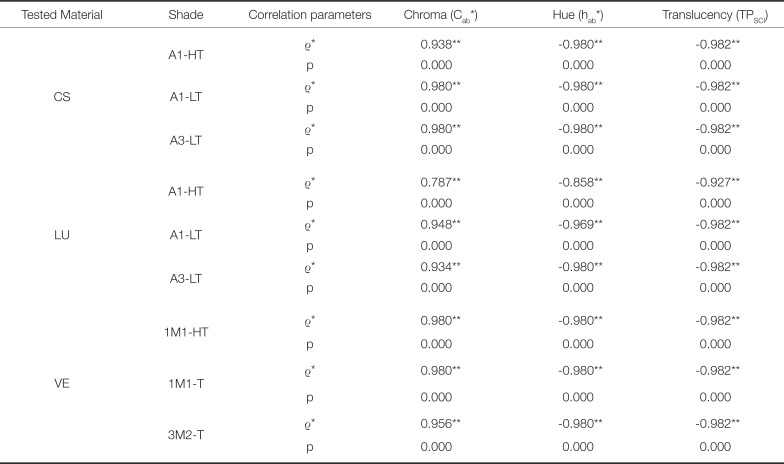
Table 3
Non-parametric correlations for intra-group analysis
![]()
Fig. 4 demonstrates the representative surface morphologies of the tested CAD/CAM materials in A1-HT/1M1-HT shade with 1 mm thicknesses. Scratch lines made by abrasive papers could be observed in all tested materials. Furthermore, CS showed smoother surface textures with uniformly dispersed small particles, whereas LU revealed larger cluster filler particles protruding from the surrounding surface. Furthermore, VE displayed darker parts that represent the continuous polymer network and brighter areas that belong to the ceramic network.

Go to :
DISCUSSION
In the current study, three novel esthetic polymer based CAD/CAM hybrid and nano-ceramic materials were chosen because of their popularity among clinicians and the little information about their color and surface properties. According to our results, hue and chroma values of the CAD/CAM polymer based composites were influenced by the material type, shade, and thickness, leading us to reject the first null hypothesis that there would be no difference in any inherent color parameter such as hue angle and chroma of tested materials in selected shades and thickness.
Chroma (Cab*) and hue angle (hab*) were calculated in this study because it is common clinical practice to base the comparison and selection of shades on value, chroma, and hue. According to our results, LU showed the highest hue angle values, whereas VE showed the least. In addition, hue angle values of the tested materials were the highest in the A1/1M1 high translucent shades and the least in the A3/3M2 low translucent shades, indicating that the hue angle change is shade-dependent manner.
Moreover, the tested materials were compared according to the hue angle values in each thickness and shade. The results of this study showed that LU material had the highest hue angle values, whereas VE had the least in all shades and all thicknesses, except the specimens in 1 mm thickness in A3-LT shade. CS and LU showed similar hue angle values, which were higher than that of VE, when the materials with 1 mm thickness in A3-LT shade were evaluated. Kim et al.27 reported that the acceptable color difference varies by the hue of the specimen. Therefore, the changes in hue will influence the acceptability of color matching in esthetic materials. In this study, hue angle values of the tested CAD/CAM hybrid and nano-ceramic materials were found to vary significantly with material type, shade, and thickness. Moreover, a strong positive correlation between hue angle and thickness parameters indicated that hue angle increased with decreasing thickness of the tested CAD/CAM composite material in each shade. In a previous study by Jarad et al.,18 a significant increase was noted in hue angle with a decrease in ceramic thickness from 0.6 to 0.3 mm, which is in good agreement with our findings. According to our results, even when the same shade is selected, clinicians should be aware of the inconsistency in color reproduction of different shades of CAD/CAM hybrid and nano-ceramic materials in different thicknesses. This inconsistency has especially become important for the CS A1-HT and LU A1-HT groups when material thickness is below 1 mm.
In this study, chromatic difference in CAD/CAM hybrid and nano-ceramic materials was also comprehensively evaluated. According to the results, VE had the highest chroma values, whereas LU had the least. However, multiple interactions between the shade and thickness parameters demonstrated different rankings amongst the chromatic values of the tested materials. These findings were observed in 0.7 and 0.5 mm specimens, which suggested that chromatic values of the tested materials vary owing to their shades when the thickness is lower than 1 mm. These results may suggest that when the restoration thickness is below 1 mm, clinicians should also consider the hue and chroma properties of these materials for optimal aesthetic outcomes.
Previous studies have shown that a ceramic restoration thickness of 2.0 mm has no association with clinically detectable substrate color differences.28 However, when the ceramic thickness was 1.0 mm, the underlying color can be detectable with the human eye.2829 Moreover, a further decrease in the ceramic thickness therefore results in chroma decrease.30 For this reason, when the thickness of CAD/CAM hybrid and nano-ceramic materials is lower than 1 mm, the underlying tooth discoloration could affect the final result and would not be the same with the determined shade. Therefore, it can be suggested that substrate color should be masked for the optimal color mimicking in these situations.
In this study, translucency of resin based CAD/CAM materials was another evaluated parameter. Our results demonstrated significant differences in terms of translucency of the materials, leading to the rejection of the second null hypothesis that there would be no difference in the translucency parameter at different thicknesses amongst the tested materials. CS and LU materials exhibited significantly higher translucency than VE material. CS and LU are nano-resin ceramic materials composed of resin matrix structure with fillers and are classified as ceramic modified high-performance materials,3132 whereas VE is a polymer-infiltrated-glass-ceramic (PICN) material. The first step in the fabrication of this material is the production of a porous pre-sintered ceramic network and conditioning by a coupling agent. Subsequently, this network is infiltrated with a polymer by capillary action.33 In a recent study by Chaiyabut,34 translucency level of the CAD/CAM glass ceramic lithium disilicate-reinforced block and abutment tooth color have a significant influence on the final color of the restoration. Therefore, in regard to the optical appearance of a dental restoration, translucency of the applied material is considered as a crucial factor during material selection to achieve aesthetically appealing restorations.
The tested CAD/CAM materials in this study had similar translucency values amongst the tested shades. Currently, the manufacturers offer high-translucent and low-translucent version of these CAD/CAM blocks. It was stated that a small number of large lithium meta-silicate crystals were present in the precrystallized state of the high-translucent lithium disilicate glass ceramic material, whereas the low-translucent material contained a large number of smaller crystals.35
In the current study, different inner structures and compositions of the tested materials influenced their translucency. This finding is in line with previous studies3637 reporting that numerous parameters, such as thickness, filler particles, resin matrix composition, polymerization, and aging, affected the light transmission of resin based restorations. Moreover, several studies have reported the effect of refraction index difference between the filler particle and matrix on the light transmission characteristics of resin materials.1421 This finding indicates that the differences in light transmission characteristic amongst the CAD/CAM materials can be attributed to the polymeric matrix refractive index, monomer type, filler type, content, amount, and size of the fillers as reported in another study.36
Koizumi et al.2 reported that the inorganic filler content of VE was significantly higher than that of LU, followed by CS. Further, VE is characterized by a dual network structure of ceramics and polymer, where the dominant ceramic network and the reinforcing polymer network completely interpenetrate. According to the manufacturer, 86 wt% of its structure is feldspathic ceramic and 14 wt% polymer. On the other hand, LU contains 80 wt% of ceramic nanoparticles, whereas CS is composed of 71 wt% silica and barium glass nanoparticles according to the manufacturer's specifications. These data also indicate that the light transmission characteristic of new aesthetic CAD/CAM materials might be related with the inorganic content of the materials.
For the tested materials used in this study, limited light transmission data is available. Stawarczyk et al.38 analyzed the translucency of CAD/CAM materials and discoloration rate after 14 days of storage in different immersion media using a spectrophotometer. These authors reported that VE exhibited significantly lower translucency when compared with CS and LU, which is in good agreement with our findings.
Moreover, the translucency of tested CAD/CAM materials seems to be material specific because clear correlations were found between material thickness and TPSCI values. The ranking of TPSCI values were different in some groups with different shades and thicknesses. However, VE had the lowest translucency results among all these groups, which is in line with the study by Awad et al.9 These authors reported that relatively high amount of Al2O3 (approximately 23 wt%) can reduce the translucency of the materials.9 Because some fillers act as radiopacifiers and excessive addition of such particles at higher levels affects the translucency of the material,9 this might further explain the differences in translucency between the nano-ceramic resin and polymer-infiltrated-feldspathic ceramic-network materials. Nevertheless, it should be pointed out that the visible translucency of a polymer based CAD/CAM material is different phenomena from its light transmittance within the blue spectrum.10
In our study, TPSCI values of the tested materials were ordered as LU > CS > VE in all shades and all thicknesses, the specimens with 1 mm thickness in A3-LT shade, with 0.7 mm thickness in A1-HT and A3-LT shades, and with 0.5 mm thickness in A1-HT shade. These results are in accordance with a previous study.39 In the study, the translucency parameter (TP) values of lithium disilicate-based ceramics were investigated, and the authors reported that 1-mm-thick ceramics exhibited lower TP values than did 0.5-mm-thick ceramics. It may be suggested that when teeth show no discoloration, practitioners can use less translucent ceramics with higher thickness to mask the underlying structure. Additionally, the translucency of tested CAD/CAM materials may have an impact on the degree of conversion of resin cements beneath the restoration in clinical practice.40 In a recent study, it was demonstrated that proper curing of cement beneath the resin based CAD/CAM materials was related with the restoration thickness.40 The authors implied that when the restoration thickness is 2 mm or more, light-transmission properties of resin based CAD/CAM materials are reduced.40 In the light of previous and current findings, it should be pointed out that practitioners should take into consideration the thickness of these materials for proper curing of cement beneath these materials.
Finally, as for the ΔESCE-SCI values of tested materials, we found that material type and shade had significant effect. LU had the highest ΔESCE-SCI values amongst the tested materials. This finding was also supported by the white light interferometry observations, which demonstrated a moderate irregular surface for CS, non-uniform surface with distinct sharp projections dotted with pores for VE, and smoother surface with randomly located pores for LU. Moreover, the lightest shades with high translucency (A1-HT/1M1-HT) showed the highest ΔESCE-SCI results. Additionally, quantitative surface roughness results exhibited that tested CAD/CAM materials varied significantly. Therefore, the third null hypothesis that there would be no difference in the surface gloss and surface roughness values amongst the tested materials had to be rejected.
Few studies have looked specifically at the surface characteristic of resilient CAD/CAM restorative materials, as they are relatively new in the market. Koizumi et al.2 evaluated the gloss and surface roughness behaviors of newly developed CAD/CAM composite blocks before and after a toothbrush dentifrice abrasion test. These authors found that, before or after the test, the average Ra values of LU and CS were lower than the values of VE. These results are inconsistent with the findings of the current study owing to CS and VE showing significantly higher surface roughness than that of LU. Additionally, Fasbinder et al.1 demonstrated a significant difference in the baseline surface roughness of the CAD/CAM materials with the resin nano-ceramic (LU) being smoother than the hybrid ceramic (VE). These findings are in accordance with our results. Furthermore, it was emphasized that although the surface roughness of these materials were found to be different, it is possible to create equally smooth surfaces for the resilient chairside CAD/CAM materials by using several finishing and polishing techniques.1
There are certain limitations to this study that must be acknowledged. One of the limitations is that the translucency results cannot automatically be related to the clinical situation because the effect of the underlying structure was not taken into consideration. Another limitation is that the influence of color parameters and the difference in translucency of the tested materials was not determined by only black background. However, the findings of our study suggested that the presented differences in the color characteristics, and optical and surface properties of the tested materials enable clinicians to enhance the appearance of the restorations to the specific situations.
Go to :
CONCLUSION
Within the limitations of the present study, the following conclusions were drawn. The order in hue angles in selected nano-ceramic and polymer-infiltrated-feldspathic ceramic-network CAD/CAM materials was as follows: LU > CS > VE. Additionally, the order of chroma values according to the tested materials was VE > CS > LU. Translucency of the tested materials differed regardless of the material shade. Translucency results of the materials were in the following order CS ≥ LU > VE. The tested materials exhibited different surface roughness values and surface topographies, also supported by the ΔESCE-SCI data. Further, the order of ΔESCE-SCI results amongst the materials were as follows LU > VE ≥ CS.
Go to :
 XML Download