

 PDF
PDF ePub
ePub Citation
 Print
Print


INTRODUCTION
Cerebral vasospasm (CV) is a major cause of mortality and morbidity in patients with subarachnoid hemorrhage (SAH).10) Therefore after a SAH, during the period in which CV frequently occurs, accurate diagnosis is helpful in early treatment and it is ultimately possible to assist in the neurological recovery of the patient.12)
There are several methods for diagnosis of CV. Digital subtraction angiography (DSA) has been the gold standard diagnostic test,20) however, its total complication rate is approximately 5% with a permanent stroke rate of approximately 0.5% to 1%.4)5)7)11)18) Thus there is a significant demand for noninvasive alternatives for accurate detection of CV.20) Transcranial Doppler sonography (TCD) is a noninvasive method for detection of vasospasm which has shown high sensitivity and specificity compared with DSA,13) however, its operator dependence and difficulty in accurately detecting vasospasm at sites other than the proximal middle cerebral artery (MCA) limit its use to a screening method only.1) While magnetic resonance angiography (MRA) can be used as an alternative, there are many disadvantages to this method, including a decrease in the visualization of the distal segment.
Computed tomographic angiography (CTA) has also been developed to provide clear vascular images, and it can detect CV after SAH with high sensitivity and specificity.14) Also with the recent advancement in maximum intensity projection (MIP) imaging, CTA can obtain a more accurate and clearer image than before in a relatively short amount of time. The purpose of this article is to perform a retrospective study on the accuracy of MIP images of CTA for the diagnosis of CV following SAH compared to that of DSA.
MATERIALS AND METHODS
Patient selection
A total of 116 patients with SAH were admitted to our hospital during 2014. Excluding 16 cases of treatment with perimesencephalic SAH and poor grade SAH, 100 patients underwent surgery; 77 were cases of endovascular coiling and 23 were cases of surgical clipping. For patients admitted for SAH, our hospital checked a MIP image of CTA and DSA at admission, and images were taken again 1 week later. With the exception of patients who did not perform under protocol due to reasons including poor grade SAH, medical problems, and transferring to other hospitals, 39 cases were performed according to protocol.
Image protocol
MIP images of cerebral CTA
The initial and follow-up CTA studies were performed in the same manner. CTA was performed using a 128-slice multidetector CT scanner (Somatom Definition AS+; Siemens Healthineer, Berlin, Germany). Contrast (Iomeprol, Iomeron 350; Pantheon, Ferentino, Italy) was administered using a mechanical injector (Stellant, Medrad; Bayer, Leverkusen, Germany). An initial test bolus (10 mL) of contrast material was infused at a rate of 2 mL/s via a 20 gauge intravenous catheter. After infusing the contrast agent, the images were obtained when 150 Hounsfield units were detected in the common carotid artery (bolus tracking technique). Images were obtained at 2 mm intervals from the foramen magnum to the vertex. The formal CTA examination consisted of 100 mL of contrast agent infused at a rate of 4 mL/s via intravenous catheter. The pitch was 0.9, with 320 mA. The 2 mm source axial images were reconstructed to 2 mm axial images. Axial, coronal, and sagittal images were produced for the MIP images based on a 20 mm slab at 10 mm intervals. All MIP reconstructions were performed by the same experienced investigator.
Cerebral DSA
The initial and follow-up DSA studies were performed in the same manner. DSA was performed using a biplane neuroangiography unit (RF-1000-125, Artis Zee biplane; Siemens Healthineer) and included three or four-vessel studies with standard Towne's, lateral and both oblique views as well as rotational spin angiograms with 3D reconstructions. A 5 French diagnostic catheter (Angled Taper; Terumo, Tokyo, Japan) was used with the help of an angled 0.035 inch guide wire (Terumo). The contrast media used was nonionic (Iobitridol, XENETIX 300; Guerbet, Villepinte, France). Injections were performed using a power injector (Mark V ProVis, Medrad; Bayer). Standard injection rates and volumes were as follows: 3.5–4 mL/s for 7–8 mL for the ICAs and 3.5–4 mL/s for 3.5–4 mL for the vertebral arteries.
Image analysis
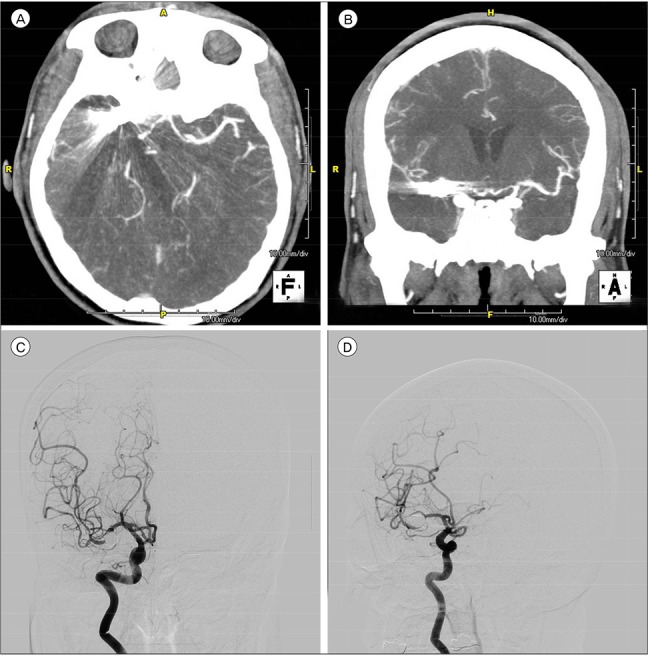
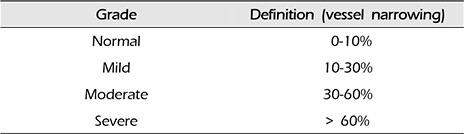
The MIP images of CTA and DSA examinations were each reviewed by two independent readers (a neurosurgeon and a neuroradiologist). Analysis of the CV was performed by comparing the initial MIP images of CTA and DSA with follow-up MIP images of CTA and DSA taken an average of 7.1 (5–10) days later. The analyzed vessel segments were divided into bilateral left and right for A1 (first segment of anterior cerebral artery), A2 (second segment of anterior cerebral artery), M1 (first segment of middle cerebral artery), M2 (second segment of middle cerebral artery), P1 (first segment of posterior cerebral artery), and P2 (second segment of posterior cerebral artery). The scale for grading intracranial CV analyzed from comparison of the initial MIP images of CTA and DSA with follow-up MIP images of CTA and DSA is as follows: normal, 0–10% vessel narrowing; mild, 10–30% vessel narrowing; moderate, 30–60% vessel narrowing; severe, more than 60% vessel narrowing (Table 1). The duration between the MIP images of CTA and DSA examinations was an average of 15.7 hours (12–21) and did not exceed 24 hours and no treatments for vasospasm were administered between the examinations. In the case that several parts in one segment had been narrowed, the narrowest part was referenced. Segments that could not be analyzed for artifacts due to coils or clips were excluded (Fig. 1). There was a two-week period between analysis of the MIP images of CTA and DSA images of the patient.
Statistical analysis
The MIP images of CTA and DSA examinations were analyzed for sensitivity, specificity, and accuracy, and predictive values were also calculated. A positive predictive value (PPV) refers to the proportion of positive MIP images of CTA results that were truly positive (on DSA studies). Similarly, a negative predictive value (NPV) refers to the proportion of negative MIP images of CTA results that were truly negative (on DSA studies). Kappa analysis was used to assess the strength of inter-observer agreement for various arterial segments. The inter-observer was in fact one person, but this is also a term indicating that the readers of the MIP images of CTA and DSA were respectively treated as different people.
RESULTS
Patients' characteristics
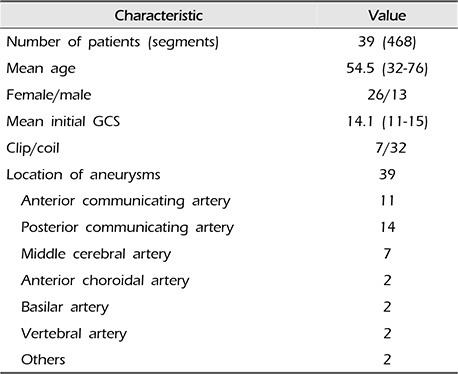
Twelve segments including bilateral A1, A2, M1, M2, P1, and P2 for 39 patients were analyzed for a total of 468 segments; 430 segments excluding 38 artifacts for reader 1, and 459 segments excluding 9 artifacts for reader 2 were analyzed, respectively. All artifacts were cases of beam-hardening artifacts due to metallic endovascular coils or surgical clips. The mean age of the patients was 54.5 (32–76); 26 patients were female, and 13 were male. The mean initial Glasgow coma scale was 14.1 (11–15), 32 patients were treated with endovascular coiling and seven with surgical clipping for their aneurysms. For the locations of aneurysms in the anterior communicating artery, posterior communicating artery, middle cerebral artery, anterior choroidal artery, basilar artery, vertebral artery and others (the superior cerebellar artery and the posterior inferior cerebellar artery) there were 11, 14, 7, 2, 2, 1, and 2 cases, respectively. Baseline characteristics of our study patients are listed in Table 2.
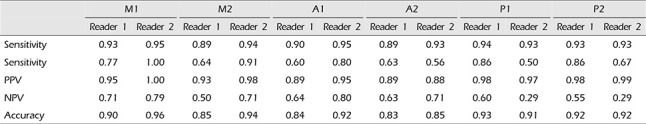
Accuracy of MIP images of CTA in various arterial segments, using DSA as the gold standard
The sensitivity, specificity, PPV, NPV, and accuracy of CTA in diagnosis of A1, A2, M1, M2, P1, and P2 segments vasospasm, using DSA as the gold standard are shown in Table 3. The sensitivity, specificity, PPV, NPV, and accuracy for different segments varied from 89 to 94%, 60–86%, 89–98%, 50–71%, and 83–93%, respectively, for reader 1, and from 93 to 95%, 50–100%, 88–100%, 29–80% and 85–96%, respectively, for reader 2.
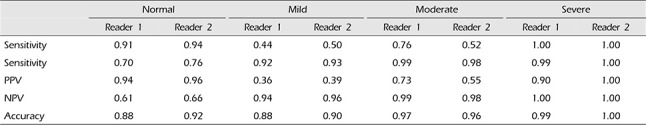
Accuracy of CTA in various vasospasm severity, using DSA as the gold standard
The sensitivity, specificity, PPV, NPV, and accuracy of CTA in diagnosis of normal, mild, moderate, and severe vasospasm, using DSA as the gold standard are shown in Table 4. The sensitivity, specificity, PPV, NPV, and accuracy for different vasospasm severity varied from 44 to 100%, 70–99%, 36–94%, 61–100%, and 88–99%, respectively, for reader 1, and from 50 to 100%, 76–100%, 39–100%, 66–100%, and 90–100%, respectively, for reader 2.
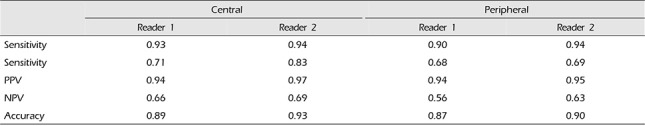
Accuracy of CTA in central segments versus peripheral segments, using DSA as the gold standard
The sensitivity, specificity, PPV, NPV, and accuracy of CTA in central segments (A1, M1, P1) versus peripheral segments (A2, M2, P2), using DSA as the gold standard are shown in Table 5. The sensitivity, specificity, PPV, NPV and accuracy for central segments and peripheral segments varied from 90 to 93, 68–71, 93–94%, 56–66 and 87–89%, respectively, for reader 1, and from 94%, 69–83%, 95–97%, 63–69% and 90–93%, respectively, for reader 2.
Kappa analysis was used to assess the strength of inter-observer agreement for various arterial segments. The K values of the two readers were 0.553 for reader 1 and 0.562 for reader 2 (Table 6).
DISCUSSION
The presence of significant vasospasm carries the risk of stroke, thus the role of imaging in these patients is not only to reach a diagnosis of vasospasm but mainly to make an appropriate clinical decision regarding the most suitable treatment.12) DSA is considered the standard method to confirm the diagnosis of vasospasm.16) The major advantage of DSA lies in its accuracy and the capacity to immediately perform endovascular treatment by balloon angioplasty and/or intra-arterial injection of vasodilatory drugs.19) However, this procedure is invasive and is not always available in critically ill patients and not without its own risk.3)11) There has been, therefore, great demand for noninvasive alternatives for accurate depiction of cerebral vasospasm.20) TCD is an examination with many advantages including its accuracy, relative simplicity, and it can be performed every day, etc. However, the technical limitations of TCD include examiner experience and the difficulty of accurately detecting vasospasm at sites other than the proximal middle cerebral artery.10) In addition, approximately 10% of studies using TCD failed to detect signals of cerebral artery blood flow caused by poor insonation of the cranial window.8)17) Thus, TCD alone is inadequate for detection of vasospasm, and other methods are required.9) MRA can depict the cerebral vasculature less invasively, however its sensitivity and specificity for detection of vasospasm after SAH remain relatively low. In addition, MRA has limitations for detecting the severity of vasospasm and visualization of the distal arteries.15) Therefore, MRA cannot be considered as a practical alternative to DSA.
By contrast with these modalities, although the distal segments of the cerebral arteries are poorly imaged because of the limited spatial resolution,10) CTA is a noninvasive alternative to DSA, and can be rapidly performed immediately after a non-contrast head CT, which is often performed in patients to evaluate for hydrocephalus.2) However, there are also disadvantages. It is important to mention that imaging for vasospasm is usually performed after clipping or coiling of an aneurysm. Streak artifacts from these metal devices could obscure adjacent arteries especially after coiling and influence CTA's evaluation. However, recently developed MIP images have overcome some of the limitations of CTA. MIP images have advantages for differentiating calcification from true lumen and determining degree of atherosclerotic disease.6)
This study examined the accuracy of MIP images of CTA for diagnosis of CV compared to DSA. When diagnosed with SAH, initial MIP images of CTA and DSA were checked, and the same examinations were repeated one week later. We considered that the MIP images of CTA could predict a significant part of the cerebral vasospasm. Actually, in this study compared with DSA, the accuracy of the MIP image of CTA was higher overall (88–100%). Previous studies have reported higher sensitivity (up to 97.5%) and specificity (up to 98.1%) of CTA for vasospasm.20) This is explained by the fact that the previous study only considered severe vasospasm, and considered all vessels that were not severely narrowed as normal. This dichotomization of the interpretation of the CTA images resulted in apparent increased sensitivity and specificity at the expense of not detecting mild or moderate vasospasm.
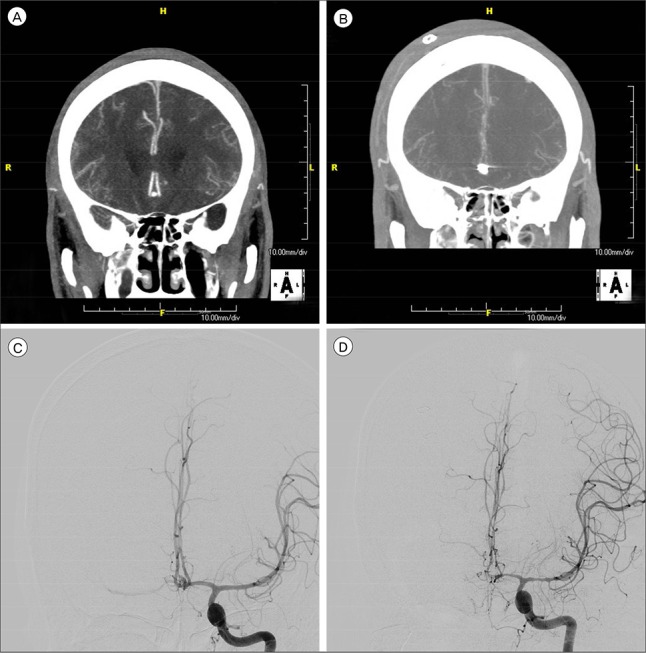
However, in this study the degrees of vasospasm were categorized according to normal, mild, moderate, and severe. As a result, in the case of moderate and severe vasospasms, it was confirmed that sensitivity and specificity were high, and in the case of normal and mild vasospasms, it was confirmed that sensitivity and specificity were relatively lower. The fact that the accuracy of the moderate and severe vasospasms was very high is considered the most important findings of this study (Fig. 2). This signifies that a moderate and severe vasospasm in the MIP images of CTA has a high probability of also being a moderate and severe vasospasm in DSA as well, respectively. In other words, it can be concluded that when diagnosed with moderate or severe vasospasms by the MIP images of CTA, it is unnecessary to check DSA for a more accurate diagnosis. However, by correlation with clinical factors, endovascular treatment can be performed simultaneously with DSA as necessary. When comparing with a distinction between the central vessel segment (A1, M1, P1) and the peripheral segment (A2, M2, P2), both readers confirmed higher accuracy of the central vessel segment compared with that of the peripheral vessel segment. From these results it is considered that the central vessel segment is more advantageous than the peripheral vessel segment when measuring the vasospasm.
This study is distinct from other studies for the following reasons. First, this study compares the four group images starting from the group without cerebral vasospasm up to the severe vasospasm group. Second, this research compares the MIP images of CTA and DSA images when the SAH diagnosis is initially given to the MIP images of CTA and DSA images one week later. Third, this study performs a comparison based on the detailed categorization of A1, A2, M1, M2, P1, P2 without knowing whether the patients were normal or diagnosed with vasospasm. And, because of separate analysis on the MIP images of CTA and DSA with two-week duration, the bias was reduced. Fourth, a clear distinction between spasm and hypoplastic vessel was possible because both initial and one week examinations were checked for the CTA and DSA.
However this study also had a few limitations. First, although the period in between was short, the time between duration for the MIP images of CTA and DSA in the follow-up image test was an average of 15.7 hours. Because cerebral vasospasm is a dynamic process, there was a limitation in that there was a possibility of change even within a short period of time. Second, because this was a study only on the diameter of the vessel, there is a limitation that the results might not be identical to the clinical results. Therefore, there is a need for future research in the area of modalities such as perfusion CT. Third, the patients included in the research protocol were in relatively good clinical states. In other words there was a high probability of CV in patients who were not in good clinical states, resulting in the limitation that these patients were excluded from the study. Fourth, the low power of statistics due to the small study population was a major limitation of our study.
CONCLUSION
MIP images of CTA are a useful modality when diagnosing cerebral vasospasm after SAH. Because of this high accuracy, it is possible to reduce the number of unnecessarily invasive DSA examinations, making it possible to perform DSA on carefully selected patients. Therefore we propose that the MIP images of CTA examination be used with the objective of screening for cerebral vasospasm after SAH and that the MIP images of CTA examination can be used as a key modulator by appropriately correlating diagnosis results and clinical symptoms for determining whether DSA examination is necessary.

 XML Download