

 PDF
PDF ePub
ePub Citation
 Print
Print


INTRODUCTION
Worldwide, colorectal cancer (CRC) is the third most commonly diagnosed cancer in men and second in women, with an estimated 1.4 million cases and 693900 deaths occurring in 2012.1 While CRC incidence rates are highest in Western countries, such as Australia/New Zealand, Europe, and Northern America,1 CRC incidence rates have recently been increasing in regions historically at low risk of CRC.2 In Korea, CRC incidence rates have risen markedly over the past few years, with 5.0% and 3.7% increases in annual percentage changes (APC) in men and women, respectively, from 1999 to 2013.3 In 2014, CRC had the third highest incidence rate among all major cancers in both genders.3
In general, socioeconomic status (SES) has been shown to account for increases in the prevalence of various diseases, especially non-communicable disease.45 Regarding cancer, previous studies have indicated that cancer deaths are more common among individuals of low SES.678 However, these individuals are less likely to undergo screening. In developed countries, including Korea, Japan, and the United States, individuals of lower SES have commonly been found to undergo less screening than those of high SES.910111213
In Korea, the National Cancer Screening Program (NCSP) was implemented by the Ministry of Health and Welfare to provide free screening services for major cancers, starting with gastric and breast cancer in 1999.14 Nationwide CRC screening was first initiated in 2004 as part of the NCSP for low-income groups. Due to a limited capacity to perform colonoscopy screening for every age eligible participant, the NCSP offers a fecal occult blood test (FOBT) annually as the initial mass screening method for men and women ≥50 years.15 For individuals with a positive FOBT result, the NCSP covers further investigation with a colonoscopy or double-contrast barium enema. In 2004, Medical Aid recipients and National Health Insurance (NHI) beneficiaries within the lower 30% income bracket were eligible for free-of-charge CRC screening services under the NCSP. In 2005, the target population was expanded to the 50% bracket. Apart from these nationwide screening programs, CRC screening tests are available at outpatient clinics or private health centers as opportunistic screening options at full out-of-pocket payment from recipients.16
After implementation of CRC screening in the NCSP, screening rates have increased.1617 Notwithstanding, even though overall screening rates have increased, whether inequalities in the uptake of screening are present, specifically in CRC, remains unclear. Previous studies focusing on SES disparity or inequality in CRC screening have applied conventional logistic regression or the concentration index to report inequality outcomes.181920 Inequality indicates for the degree of association between rates for a health indicator and the distribution of the population among ordered groups (e.g., education and income). On the other hand, health disparity is defined as a particular type of health difference that is closely linked with social, economic, and/or environmental disadvantages.21 In this study, we utilized the slope index of inequality (SII) and relative index of inequality (RII) to describe inequalities in CRC screening. Compared to traditional approaches, these measures have two ideal properties: First, because they are regression-based, they give an inequality measure across the full range of SESs, not just a comparison of the two most extreme groups as in conventional logistic regression. Second, they both take into account changes in the inequality by SES groups over time.
This study was conducted to evaluate CRC screening rates in Korea and trends therein from 2005 to 2015 for individual screening modalities using data collected via a population-based survey. Further, we assessed inequalities in CRC screening in Korea using SII and RII according to education and income levels.
MATERIALS AND METHODS
Study population
This study applied data from the Korean National Cancer Screening Survey (KNCSS). The KNCSS is an annual nationwide, population-based, cross-sectional survey conducted by the National Cancer Center in Korea to assess behavioral patterns associated with cancer screening rates (five cancers: gastric, liver, colorectal, breast, and cervical cancers). Multi-stage random sampling based on annual resident registration data was applied to obtain a representative sample. Face-to-face interview surveys were conducted by trained interviewers. Cancer-free men between 40 and 74 years of age and cancer-free women between 30 and 74 years of age comprised the eligible population of the KNCSS. Informed consent was obtained from all participants. Details on the survey have been described fully elsewhere.22
The present study included men and women between 50 and 74 years of age who participated in the KNCSS between 2005 and 2015. A total of 17174 participants were included in the final analysis. This study was approved by the Institutional Review Board of the National Cancer Center, Korea (approval number: NCCNCS-08-129).
Measures
Using a structured questionnaire, participants were asked about their experiences with screening for CRC. The questions included “Have you ever undergone CRC screening?” and, if so, “When did you last undergo CRC screening?” and “What tests did you receive for CRC screening?” Screening status was defined as “screened” for those who underwent FOBT within the past year or who ever had a colonoscopy. Otherwise, participants were considered as “non-screened.”
In this study, education and monthly household income were utilized as SES indicators. Education was grouped into four levels: no formal education and elementary graduates (lowest level); middle school graduates; high school graduates; and college or university graduates and higher level of education (highest level).
In the KNCSS, monthly household income had been collected as a categorical variable with 13 categories, ranging from 1000 to 5000 US dollars in 2005 and from 1000 to 10000 US dollars since 2006. Then, for a sufficient number of individuals in each group, monthly household income was grouped into three groups based on tertiles: the 1st tertile represents low income status; the 2nd tertile represents middle income status; and the 3rd tertile represents high income status. Thus, income levels were classified into three groups as follows: <1500, 1500–2499, and ≥2500 in 2005, 2006, and 2007; <1500, 1500–2999, and ≥3000 in 2008 and 2009; <2000, 2000–3499, and ≥3500 in 2010 and 2011; <2500, 2500–3499, and ≥3500 in 2012; and <3000, 3000–4499, and ≥4500 in 2013, 2014, and 2015.
Statistical analysis
Consecutive CRC screening rates over 11 years were calculated with adjustment for weight-reflected age structures of Korean men and women for each study year from 2005 to 2015. Weighted screening rates are presented as APCs within a 95% confidence interval (CI) to assess significantly changing trends in CRC screening rates. APCs were estimated for levels of each socioeconomic variable, fitted by SEER*Stat software from the National Cancer Institute (Bethesda, MD, USA).
Since our indicators of socioeconomic position reflect a hierarchical order (education and household income), we adopted regression-based measures of inequality, SII (an absolute inequality measure) and RII (a relative inequality measure).2324 SII describes an actual context of public health intervention in terms of changes in screening rates (%), and RII provides an indication of progress. Thus, estimation of both measures (SII and RII) is essential to deriving a complete outlook on potential inequalities. Both indices are obtained through age-adjusted Poisson regression analysis of a dependent variable (CRC screening) as an indicator of a cumulative relative position of each group with respect to education and income levels.
The SII is a coefficient regressed between the mean of CRC screening rates in each socioeconomic group and the midpoint of each cumulative range of hierarchically lined-up social groups. By weighting social groups by their population share, the SII is able to incorporate changes in the distribution of social groups over time that affect population CRC screening rates. Thus, SII is calculated from the slope of the weighted least squares regression, and is interpreted as the absolute difference in CRC screening rate between those having the lowest education/income levels and those having the highest education/income levels. A positive SII value indicates that most privileged group had more screening experience, while a negative SII value indicates the opposite. Further, greater absolute values, or SII, indicate higher levels of inequality, and an SII value equal to zero indicates no inequality in CRC screening experience.
From the identical equation, RII is obtained by dividing the screening rates of those who are in the most privileged category by that for the least privileged, thereby reflecting relative disparity. Its interpretation is similar to that for SII, except that it measures proportionate increases (in regard to the average population level) rather than the absolute increase or decrease in CRC screening rate between the highest and lowest socioeconomic groups. Thus, an RII value greater than 1 indicates fold changes in screening rates within the highest and lowest socioeconomic groups. Thus, an RII value equal to 1 indicates no inequality in CRC screening experience, whereas an RII value greater than 1 indicates fold higher CRC screening rates in high SES groups and vice versa.
To assess statistically significant changes in trends of CRC according to education and income inequalities during the study period, forest plot analysis was applied for SII and RII. Pooled estimates of SII and RII across study years were also calculated. Statistical analyses were conducted using SAS statistical software (version 9.2, SAS Institute Inc., Cary, NC, USA). Survey weights were used in all analyses. For all tests of statistical significance, p<0.05 was used.
RESULTS
Characteristics of the study population
Baseline characteristics of the study population in the KNCSS from 2005 to 2015 are described in Table 1. From 2005 to 2009, each study year had approximately 900 participants, while the last 6 years had about 2000 participants each year. Proportions of men were slightly lower than those of women in all survey years. From 2008 to 2015, the youngest age group (50–54) accounted for the highest proportion of participants, compared to other age groups. Proportions of participants varied by levels of household income among studied years. From 2008, the highest proportion of participants were high school graduates, comprising around 40% to greater than 50% of all participants. Demographic characteristics showed a similar distribution in both sexes (Supplementary Table 1, only online).
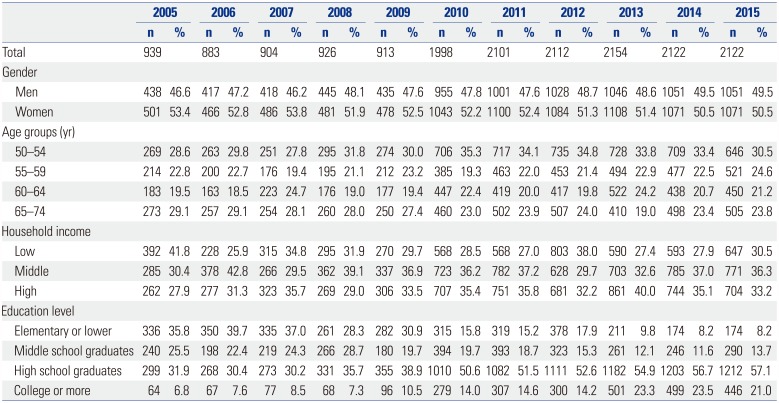
Table 1
Baseline Characteristics of the Study Population in the Korean National Cancer Screening Survey, 2005–2015
![]()
Table 2 provides CRC screening rates for each year, stratified by age group and SES status. CRC screening rates continuously increased from 23.4% in 2005 to 50.9% in 2015 with an approximately 28% point increase over the 11-year period. The APC in participation rates between 2005 and 2015 was 7.8% (95% CI, 6.0 to 9.6). Men had higher CRC screening rates than those of women. Further, individuals of ages from 60–64 and 65–74 years had higher screening rates than those of younger age. However, individuals aged 50 to 54 years showed the highest APC (10.0%, 95% CI 7.8 to 12.2) in participation rates, followed by those aged 55 to 59 years (7.3%, 95% CI, 4.6 to 10.1). Screening rate increased from 2005 to 2015 in all three household income groups. The APC in screening rates was highest in the middle income group (8.7%, 95% CI, 5.8 to 11.7) and lowest in the high income group (6.8%, 95% CI 4.8 to 8.9). Screening rates were higher for those with higher education levels (high school graduates or higher levels) in the majority of study years. However, those with the lowest education levels showed the highest APCs in participation rates (8.4%, 95% CI, 6.0 to 10.9). All APC values were statistically significant. The overall increasing trends in CRC screening rates according to education and income levels were similar for both men and women (Supplementary Table 2, only online). In men, the highest APC values were observed in individuals aged 50 to 54 years (10.7%, 95% CI, 8.7 to 12.7), those with the middle household income level (9.0%, 95% CI, 5.8 to 12.2), and those with lowest education level (9.1%, 95% CI, 5.7 to 12.6). However, in women, those with the highest education levels showed the highest APCs in participation rates.
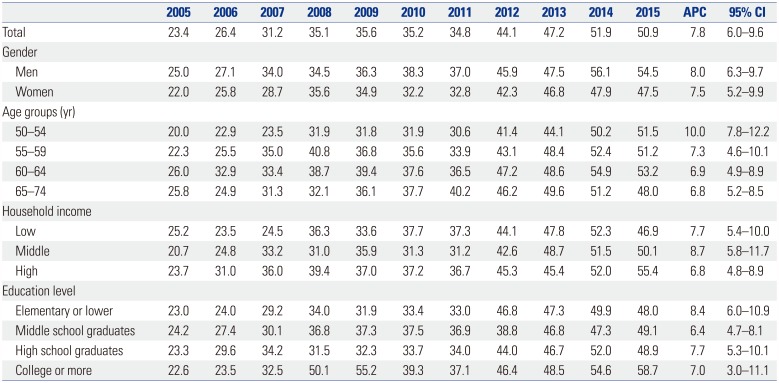
Table 2
Colorectal Cancer Screening Rates according to Socioeconomic Status with APCs in the Korean National Cancer Screening Survey, 2005–2015 (%)
![]()
Absolute and relative inequality in CRC screening
Socioeconomic inequalities in CRC cancer screening participation are illustrated in Fig. 1. With regard to education level, absolute and relative inequalities were significant in 2009 and 2014, and favored participants with higher educational attainment (Fig. 1A and C). In detail, in 2009, the difference in CRC screening participation between the highest and lowest levels of education reached 18.63% (Fig. 1A); in the same year, participants with the highest education level were 2.4 times more likely to have experienced CRC screening (RII=2.40) (Fig. 1C). In 2014, this difference was much smaller, but still favored those with higher education in both relative and absolute measures (SII=8.78% and RII=1.42). In other years, both absolute and relative inequality values indicated that individuals with higher education were likely to experience more CRC screening; however, none of those reached statistical significance. Overall educational inequality was significant with a pooled estimate of 6.55% (95% CI, 3.55 to 9.55) in absolute terms and 1.28 in relative terms (95% CI, 1.11 to 1.46).
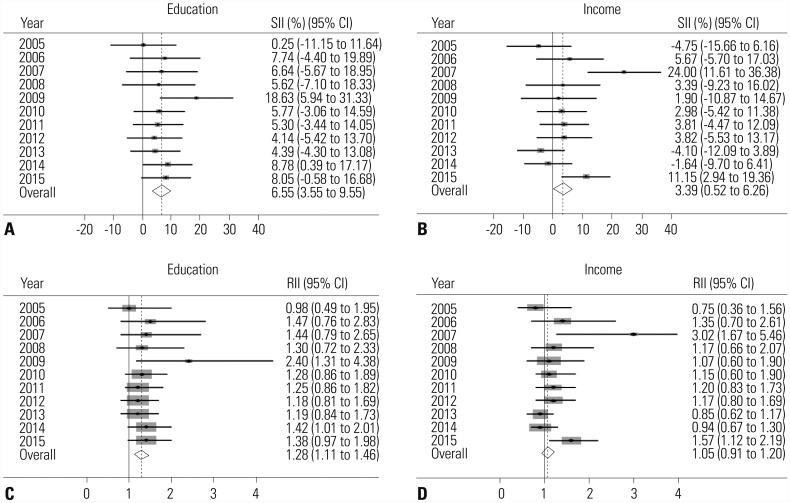
Fig. 1
Absolute and relative inequalities in CRC screening from 2005 to 2015. (A) Absolute educational inequalities in CRC screening rates. (B) Absolute household income inequalities in CRC screening rates. (C) Relative educational inequalities in CRC screening rates. (D) Relative household income inequalities in CRC screening rates. Solid line represents the line of equality; dotted line reflects pooled coefficients. CRC, colorectal cancer; SII, slope index of inequality; RII, relative index of inequality; CI, confidence interval.
![]()
In terms of inequality by household monthly income, inconsistent results and no apparent trend were observed among survey years (Fig. 1B and D). Statistically significant results were found in 2007 with SII=24.00% (95% CI, 11.61 to 36.38) and in 2015 with SII=11.15% (95% CI, 2.94 to 19.36) (Fig. 1B). Consistently, significant results were found in relative terms in the same years: RII=3.02 (95% CI, 1.67 to 5.46) in 2007 and RII=1.57 (95% CI, 1.12 to 2.19) in 2015 (Fig. 1D). These results indicated that individuals of high income status underwent more CRC screening than those of low income status. However, overall pooled estimates for income inequality were only marginally statistically significant in absolute terms (SII=3.39; 95% CI, 0.52 to 6.26) and were insignificant in relative terms (RII=1.05; 95% CI, 0.91 to 1.20).
The absolute and relative inequalities in CRC screening by gender are described in Supplementary Table 3 (only online). In men, with regard to education, we found statistically significant differences in absolute inequality in 2009 and overall pooled estimates (pooled SII=7.40%; 95% CI, 3.142 to 11.66). Also, income inequalities were statistically significant in absolute pooled estimates (pooled SII=5.32%; 95% CI, 1.18 to 9.47). In women, absolute inequality by education level was significant in overall pooled estimates, with a SII value of 5.65% (95% CI, 1.42 to 9.88). However, pooled estimates of inequality by income in both absolute and relative terms were not significant.
DISCUSSION
This study attempted to measure education- and income-related inequalities in the use of CRC screening services by estimating absolute and relative inequalities and by evaluating changes in observed inequalities over the past decade. Using the cross-sectional KNCSS database, we found that CRC screening rates annually increased within the 11-year period from 2005–2015. Persons of younger age, lower household income, lower education, and male sex experienced more substantial increases in screening rates, with higher APC values. Our results indicated educational inequalities existed in CRC screening in Korea during the studied period and favored those who had higher education, with significant pooled estimate values in both absolute and relative indices. Regarding household income inequality, although significant results were noted in two separate study years, the overall pooled estimates of RII were not significant. Further, no apparent trend was observed in income inequality among survey years.
Our results were in line with previous studies in Korea in which an increase in CRC screening uptake was reported. One study of the Korea NCSP database noted an overall uptake rate for CRC screening of 30.1%, with an upward trend from 2006 to 2011.16 Another study using Korea National Health and Nutrition Examination Survey (KNHANES) data reported that CRC screening rates increased from 1998 to 2012, with an average rate of 30.4%.15 Using data from the NCSP, participation rates for CRC screening were again reported to have increased gradually from 7.3% in 2004 to 25.0% in 2012.17 The noted increase in participation in CRC screening was expected due to the implementation of the NCSP in Korea. Continuity in nationwide cancer screening services through the NCSP was deemed to have contributed to the gradual increase in CRC screening rates. In addition, a previous study reported that the increase in CRC screening might be attributable to a substantial increase in FOBT testing, compared to other modalities, especially among women and low-income groups.16 This could be explained by the introduction of annual FOBT testing at no charge as an initial screening tool for low-income individuals beginning in 2004.
To illustrate disparities in screening, we selected education as one indicator of SES. Even though education is a central indicator of SES, it has not received focus in previous studies of screening disparity: the majority of related studies on CRC screening disparity have addressed race, ethnicity, income, and insurance status.19252627 A few studies have previously found education to be associated with screening participation,2829 and results from our analyses showed that education inequality is present in CRC screening. This is in line with previous publications on differences in CRC screening according to education levels. One study suggested that health literacy is an associated factor with educational attainment, and might have mediated the contribution of education to screening inequality, to some extent.20 In the context of CRC screening, previous studies have reported that a low level of health literacy results in more problems in seeking and understanding health-related information or completing screening procedures.303132 In Korea, one reason for this inequality could be a lack of knowledge about cancer screening or a lack of awareness of the existence of the nationwide screening program.33 Further, research should be conducted to investigate the pathway of how low education level influences the uptake of CRC screening.
In this study, results on income inequality in CRC screening were inconsistent throughout the study period, and therefore, no distinct income inequality was found. Although overall findings did not show income inequality for the total study population or each gender separately, significant results were observed in 2007 and 2015 among women participants. Opposite outcomes were also observed in other years with negative values for both absolute and relative measures; however, these were not statistically significant. A previous study reported that higher CRC screening rates were observed among men of higher income status, whereas income disparities were not seen among women.11 There could be many reasons for income inequalities in CRC screening. We suspect that differences in eligible criteria for being tested by FOBT and colonoscopy might contribute to income inequality in CRC screening. While NCSP ensures free-of-charge FOBT testing for all individuals, only those with positive FOBT results are provided free-of-charge endoscopy testing. Furthermore, the NHI only reimburses colonoscopy costs for those with symptoms or colorectal problems. Therefore, income inequalities in CRC might be due to a greater use of endoscopy tests among individuals of higher income status. Indeed, another study reported that low household income was associated with lower screening rates with colonoscopy in urban areas in Korea.18 Meanwhile, one study hypothesized that nationwide expansion of public cancer screening would likely increase both total screening rates and income inequality in the uptake of cancer screening services.34 One plausible explanation mentioned by the authors is that, while income mainly represents an individual's ability to pay for services, utilization of cancer screening services might be influenced by other factors.34 For example, even though national screening services are free to all target individuals, those with low income occupations might face more difficulties in leaving work to receive screening.
Our study has several limitations. The KNCSS survey is heavily reliant on self-reported screening information. Therefore, our screening information may reflect recall bias in describing past screening experiences. However, previous studies have shown that self-reported cancer screening history is reliable and agrees well with medical records.3536 Thus, the impact of recall bias on the outcomes would likely be small. Further, only income and education levels were considered among various socioeconomic factors that can influence health care utilization. Finally, using SII and RII as inequality indices limited our choice of SES variables for analysis, as variables must be able to be hierarchically ordered.
This study provides evidence on changes in education and income inequalities in CRC screening in Korea over an 11-year period. Here, we discovered education inequalities in screening experience for CRC among individuals targeted for screening in the NCSP and these inequalities tended to decrease toward the end of the study period. No apparent trend was noted in income inequalities. The introduction of free CRC screening appears to have been effective in increasing CRC screening rates among low-income groups in Korea. However, around half of adults in Korea still do not participate in CRC screening. It will be important to continue to monitor inequality trends in screening, as well as to investigate factors associated with CRC screening particularly among those with low educational level. Moreover, further studies are needed to thoroughly outline SES inequalities in CRC screening, as well as factors associated therewith.
 XML Download