

 PDF
PDF ePub
ePub Citation
 Print
Print


INTRODUCTION
Cervical and breast cancers threaten many women's lives, accounting annually for two million newly developed cases and 800000 cancer deaths worldwide.1 Interestingly, socioeconomic and regional differences in the incidences and mortalities of cervical and breast cancer have also been described within countries.234 The striking inequalities in cervical and breast cancer are, in part, attributable to the availability and accessibility of early detection and treatment services. In several countries, implementing screening programs and services has facilitated substantial progress in raising screening rates.45 However, increases in screening rates are not equal from country to country. Indeed, numerous studies have found several socioeconomic factors to affect adherence to cervical and breast cancer screening, including lower educational attainment and income, residence in rural areas, ethnicity, and so on.678 Less disparity in cancer screening, however, has been reported among women who were commercially insured or were residents of countries with national organized screening programs.45 Notwithstanding, most studies have not applied inequality-specific indicators with which to analyze and compare trends in changing inequalities.
In Korea, age-standardized rates of cervical for incidence and mortality are 9.0 and 2.1 per 100000 individuals, respectively, ranking higher than those in countries in Northern America and Western Europe.9 Breast cancer in Korean women is the most commonly diagnosed cancer, except for thyroid cancer,10 and breast cancer screening has proven to be effective in reducing breast cancer mortality. Meanwhile, cervical cancer is largely preventable and an easily treatable cancer when detected at early stage of the disease. Therefore, cervical and breast cancer screening programs were implemented in 2002 as part of the National Cancer Screening Program (NCSP) in Korea. The NCSP is a nationwide organized program, offering cancer screening for major five types of cancer, including breast, cervical, liver, stomach, and colorectal cancer, at no charge or an affordable cost, with coverage provided by National Health Insurance. According to national guidelines for cancer screening in Korea, which were recently revised in 2016, biannual Pap smear screening is available for women aged 30 years and over and biannual mammography for women aged 40 years and over.11
Followed by introduction of the NCSP, lifetime screening rates for cervical and breast cancer screening rates increased up to 76.2% and 83.1% in 2013; screening rates in compliance with the NCSP protocols also rose to 67.0% and 59.3% for cervical and breast cancer, respectively.12 However, as noted in the studies cited above, increases in screening rates might not always appreciate equitably across socioeconomic statuses. Indeed, a few studies have described inequalities in cervical and breast cancer screening utilization among Korean women. Kim, et al.13 demonstrated that introduction of the NSCP actually reduced payment from out of pocket money among Korean women intending to undergo breast cancer screening, resulting in a decrease in relative inequalities by achieving overall increases in the uptake of breast cancer screening, but no changes in absolute differences between the highest and lowest income quartiles. Furthermore, Lee, et al.14 described specific disparities in cervical cancer screening, indicating that lower educational level and income status were associated with lower screening rates. However, these studies analyzed inequalities with conventional logistic regression or direct simple comparison of rate differences or ratios between high and low socioeconomic groups. Furthermore, data in their analyses did not address the latest trends in screening behaviors among Korean women. In this study, we utilized the slope index of inequality (SII) and relative index of inequality (RII). Compared to traditional approaches, these measures have two ideal properties: First, because they are regression-based, they give an inequality measure across the full range of socioeconomic groups, not just a comparison of the two most extreme groups as in conventional logistic regression. Second, they both take into account changes in the distribution of socioeconomic groups over time.
This study was conducted to evaluate cervical and breast screening rates in Korea and trends therein from 2005–2015 using data collected via a population-based survey. We also assessed socioeconomic inequalities in cervical and breast cancer screening in Korean women using SII and RII according to education and income levels.
Go to : 
MATERIALS AND METHODS
Study population
Data were derived from the Korean National Cancer Screening Survey (KNCSS) from 2005 to 2015. The National Cancer Center has conducted the KNCSS annually. The KNCSS is a population-based cross-sectional survey of nationally representative data to investigate cancer screening rates and screening-related behaviors for five major cancers (i.e., stomach, liver, colorectal, breast, and cervix uteri).12 Multi-stage random sampling based on annual resident registration data was applied to obtain a representative sample. Face-to-face interview surveys were conducted by trained interviewers. Cancer-free men between 40 and 74 years of age and cancer-free women between 30 and 74 years of age comprised the eligible population of the KNCSS. The numbers of respondents were 3952, 2028, 2030, 2021, 2038, 2000, 4056, 4100, 4140, 4100, 4000, and 4000 for every survey year from 2005 to 2015. Sample sizes were doubled from 2010 in order to obtain more reliable and inferential data. Using a structured questionnaire, participants were asked about their experiences with screening for five types of cancer, as well as sociodemographic characteristics, including income level. Informed consent was obtained from all study participants.
In accordance with NCSP screening protocols, the present study included women aged 30–74 years for analysis of cervical cancer screening and women aged 40–74 years for analysis of breast cancer screening from 2005 to 2015. A total of 19910 women were finally included for analysis. This study was approved by the Institutional Review Board of the National Cancer Center, Korea (approval number: NCCNCS-08-129).
Measures
Using a structured questionnaire, participants were asked about their experiences with screening for breast and cervix uteri. The questions included “Have you ever undergone Pap smear test/mammography for cervical/breast cancer screening?” and “When did you last undergo Pap smear/mammography screening?” Screening status was defined as ‘screened’ for women who underwent Pap smear screening within 2 years for cervical cancer or who underwent mammography within 2 years in compliance with NCSP protocols.12 Otherwise, women were considered as ‘non-screened’, even if they underwent screening throughout their lives.
We analyzed household income and education levels as socioeconomic factors to assess their effects in changing inequalities in relation to screening participation. The variables have often been indicated in studies of factors affecting screening participation and socioeconomic inequalities in Korea.131415 Education level was categorized as elementary school graduates or lower, middle school graduates, high school graduates, and college graduates or higher. Household income was categorized into quartiles. In the KNCSS, monthly household income has been collected as a categorical variable with 13 categories, ranging from 1000 USD to 5000 USD in 2005 and from 1000 USD to 10000 USD since 2006. In Stata, we used a default quartile function that automatically makes quartile points of household income for a sample according to income categories. Therefore, different cutoff points were applied for different years to divide income levels by quartile. The 1st quartile represents the lowest income group, whereas the 4th quartile indicates the highest income group. For each study year, income levels were divided into four groups for analysis of cervical cancer as follows: <1500, 1500–2499, 2500–2999, and ≥3000 in 2005 and 2006; <2000, 2000–2999, 3000–3499, and ≥3500 in 2007 and 2008; <2000, 2000–2999, 3000–3999, and ≥4000 in 2009; <2500, 2500–3499, 3500–3999, and ≥4000 in 2010 and 2011; <2500, 2500–3499, 3500–4499, and ≥4500 in 2012; <3000, 3000–3999, 4000–4999, and ≥5000 in 2013, 2014, and 2015. Quartile cut-off values for breast cancers were as follows: <1500, 1500–1999, 2000–2999, and ≥3000 in 2005 and 2006; <1500, 1500–2499, 2500–3499, and ≥3500 in 2007 to 2009; <2000, 2000–3499, 3500–3999, and ≥4000 in 2010 to 2012, and <3000, 3000–3999, 4000–4999, and ≥5000 in 2013 to 2015.
Statistical analysis
Consecutive screening rates over 11 years were calculated with adjustment of weight reflected age structures of Korean women for each study year. Weighted screening rates are presented as annual percent changes (APCs) within a 95% confidence interval (CI) to assess significantly changing trends in cervical and breast cancer screening rates. APCs were estimated for levels of each socioeconomic variable, fitted by SEER*Stat software from the National Cancer Institute (Bethesda, MD, USA).
We calculated the slope index of inequality (SII) and the relative index of inequality (RII) as our primary measures to assess inequalities in cervical and breast cancer screening rates. The SII is the coefficient, regressed between the mean of cervical and breast cancer screening rates in each socioeconomic group and the midpoint of each cumulative range of hierarchically lined-up social groups. Therefore, SII reflects an absolute difference in screening rates between the theoretically most privileged and the least privileged individuals. With the identical equation, RII is obtained by dividing the screening rate of women in the most privileged category by that for the least privileged, hence RII reflects relative disparity. RII, relative disparity, provides an indication of progress, and SII, absolute disparity, describes an actual context of public health intervention in terms of percent changes in screening rates. Thus, estimation of both measures (RII and SII) is essential to deriving a complete outlook on potential inequalities.16 The obvious strength of these indicators is in comparing screening uptake across all socioeconomic groups, not just between the extreme ends of socioeconomic factors, such as conventional methods to calculate odds between the extreme ends (most privileged and least privileged).17 Both indices were calculated through age-adjusted Poisson regression.4 Positive SII values imply that screening rates among women of privileged socioeconomic status are absolutely higher than those in women of lower status. An RII value greater than 1 indicates fold changes in screening rates within the highest and lowest socioeconomic groups.
Forest plotting was applied to represent the obtained SII and RII values and to visualize statistically significant changes in trends for educational and household income inequalities in cervical and breast cancer screening uptake. Pooled estimates of SII and RII across study years were also calculated. All of the statistical analyses were weighted according to age structures of Korean women in each corresponding year using data from Statistics Korea, and were performed using Stata software (version 13; StataCorp. LP, College Station, TX, USA).
Go to :
RESULTS
The study population is outlined according to socioeconomic status in Table 1. Women aged 60–74 years comprised one fifth of all women in each study year (Table 1). Women graduating at least high school continuously garnered the highest percentages: the percentages of women with a high school education or more increased from 65.2% in 2005 to 84.3% in 2015 (Table 1).
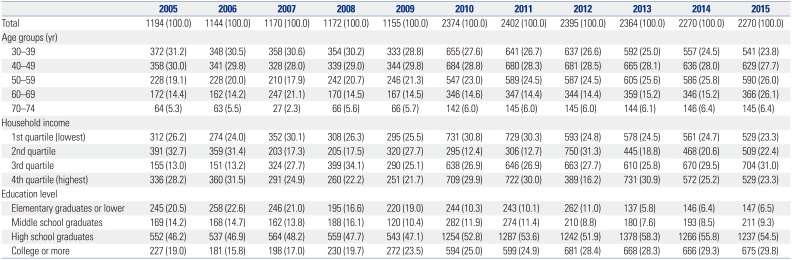
Table 1
Baseline Characteristics of the Study Population in the Korean National Cancer Screening Survey, 2005–2015
![]()
Table 2 provides the percentage of screened population from 2005 to 2015. The cervical cancer screening rates continuously increased from 54.8% in 2005 to 65.6% in 2015, with a significant APC of 1.9% (95% CI: 1.0 to 2.8). In particular, cervical cancer screening rates were highest in the highest income group. The APC in screening rates, however, was highest in the lowest income group (APC=3.5%, 95% CI: 2.0 to 5.0) and lowest in the highest income group (APC=0.8%, 95% CI: −0.1 to 1.6). Breast cancer screening rates also followed an increasing trend: An APC of 5.0% (95% CI: 1.0 to 9.0) was calculated for trends in total breast cancer screening during 2005 and 2015. Significant APCs were detected among women aged 40–49 years (APC=6.3%, 95% CI: 2.6 to 10.2); women in the second (APC=4.6%, 95% CI: 0.3 to 9.0), third (APC=6.0%, 95% CI: 2.5 to 9.5), and fourth (APC=4.9%, 95% CI: 1.6 to 8.4) quartiles of household income; and across all educational levels (Table 2).
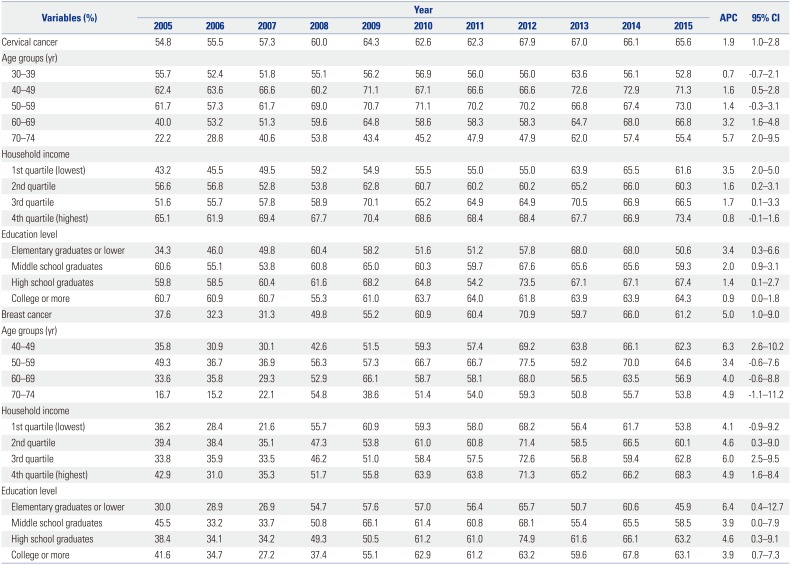
Table 2
Percentage of Women Screened for Cervical and Breast Cancer within Two Preceding Years according to Socioeconomic Status, 2005–2015 (%)
![]()
Inequality indicators (SII and RII) revealed changing patterns in socioeconomic inequalities in cervical and breast cancer screening participation (Figs. 1 and 2). Regarding educational inequalities in cervical cancer screening participation, absolute and relative inequalities were significant in 2005 (SII: 17.7% and RII: 2.1), 2006 (SII: 16.0% and RII: 1.9), and 2011 (SII: 9.2% and RII: 1.5), favoring women with higher educational attainment (Fig. 1A and C). Inequalities in household income were far higher and frequently observed for cervical cancer screening, especially between 2007 and 2011 of the study period. Significant inequalities were detected in 2007, 2008, 2009, 2010, 2011, and 2015 for both SII and RII estimates, demonstrating much higher cervical screening rates in women with higher levels of household income than in women with lower levels thereof (Fig. 1B and D). Overall, educational inequality in absolute terms was significant with a pooled estimate of 4.7% (95% CI: 1.9 to 7.5). Also, overall absolute inequality in household income status in cervical cancer screening status was significant (pooled coefficient: 10.6%, 95% CI: 8.1 to 13.2). In relative terms, the pooled estimate of educational inequality was 1.1 (95% CI: 0.9 to 1.2), indicating no significant changes therein over time. Nevertheless, relative inequalities according to household income followed similar trends as those for absolute inequalities.
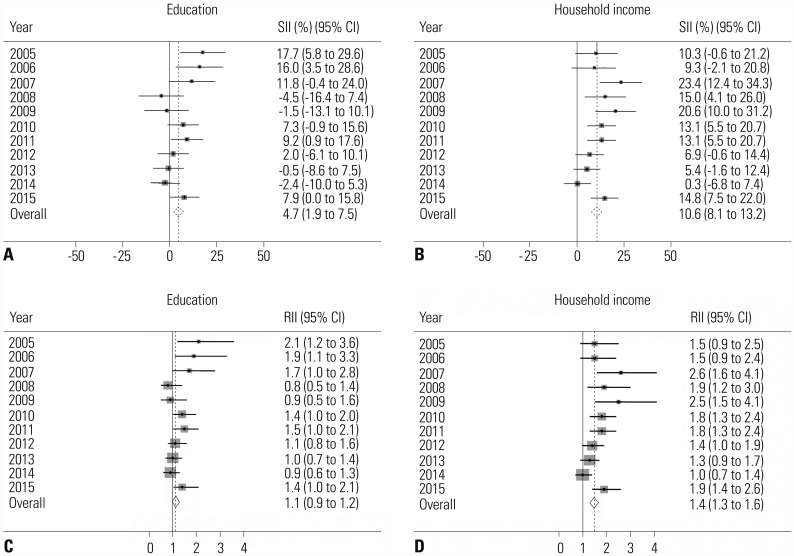 | Fig. 1Absolute and relative inequalities in cervical cancer screening from 2005 to 2015. (A) Absolute educational inequalities in cervical cancer screening rates. (B) Absolute inequalities in household income in cervical cancer screening rates. (C) Relative educational inequalities in cervical cancer screening rates. (D) Relative inequalities in household income in cervical cancer screening rates. Solid line is line of equality; dotted line is pooled coefficient. SII, slope index of inequality; RII, relative index of inequality; CI, confidence interval.
|
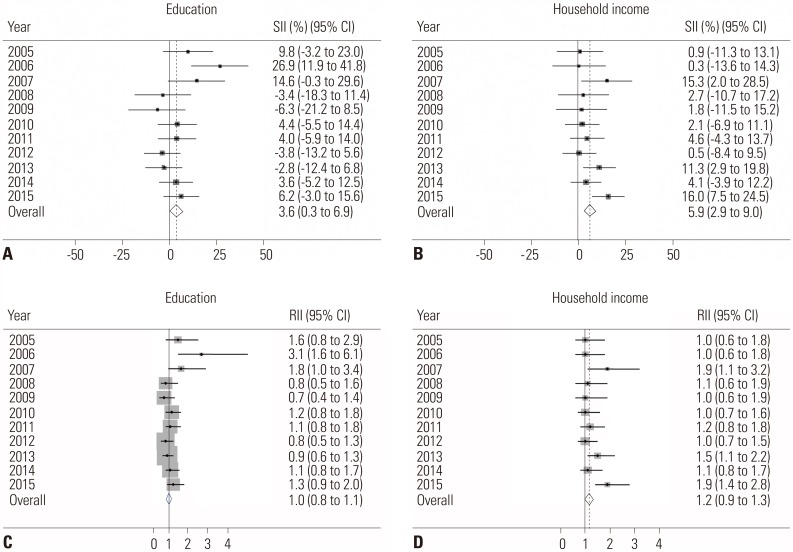 | Fig. 2Absolute and relative inequalities in breast cancer screening from 2005 to 2015. (A) Absolute educational inequalities in breast screening rates. (B) Absolute inequalities in household income in breast screening rates. (C) Relative educational inequalities in breast screening rates. (D) Relative inequalities in household income in breast screening rates. Solid line is line of equality; dotted line is pooled coefficient. SII, slope index of inequality; RII, relative index of inequality; CI, confidence interval.
|
Regarding breast cancer screening, no educational inequalities were found between 2005 and 2015, except only in 2006, while SII and RII estimates of inequalities in household income were significant in 2007, 2013, and 2015 (Fig. 2). Absolute and relative inequalities in relation to household income were stagnant over the 11-year study period, with a significant pooled SII estimate of 5.9% (95% CI: 2.9 to 9.0) and pooled RII estimate of 1.2 (95% CI: 0.9 to 1.3) (Fig. 2B and D).
Go to :
DISCUSSION
Consistent evidence throughout the world supports that socially deprived people suffer a heavier burden of cervical and breast cancer, stemming from disparities in the utilization of screening services. In the current study, we noted trends of increasing uptake of cervical and breast cancer screening among Korean women from 2005 to 2015. Educational inequalities decreased to none for both cervical and breast cancer among Korean women, while inequalities according to household income remained significant. Despite fluctuations from 2005 to 2015, inequalities in household income status in relation to cervical cancer screening rates were generally higher than those in breast cancer screening. In the case of breast cancer screening uptake, inequalities according to household income status began very low, but significant values were observed in 2007, 2013, and 2015. Although cervical cancer screening rates did not increase much, inequalities in cervical cancer screening were wider than those for breast cancer screening and frequently significant, which requires careful consideration in public health interventions. A possible explanation for the greater inequalities in cervical cancer than in breast cancer screening is partly explained by the fact that cervical cancer screening involves women in their 30s who typically have lower income level than women of other age groups. Also, in general, there are more single women in lower income groups, and single women have been found to be less likely to participate in cervical cancer screening due to the nature of tests. Thus, some of these factors may explain the greater inequalities associated with income status in cervical cancer screening than in breast cancer screening. However, further research is needed to explain the different magnitudes of inequalities between cervical and breast cancer screening.
Educational attainment is considered a more stable indicator of various health outcomes than income or occupational status due to its pan-national characteristics, especially among women.16 In one European study of the utilization of breast and cervical cancer screening services, researchers reported consistently higher educational inequalities in screening participation in countries without organized cancer screening programs at the regional or national level.4 Taiwan also reported decreased inequality in cervical cancer screening rates across educational attainment in a population-based screening program.18 In our results, however, educational attainment contributed to significant socioeconomic inequalities in cervical cancer screening uptake. We suggest that the inequality is attributable, in part, to a recent demographic change toward higher educational attainment. In our study results, the proportion of women who were elementary school graduates was 20.5% in 2005, but reduced to 6.5% in 2015, whereas women with educational level of college or more doubled over the 11-year study period. Indeed, rapid increases in educational attainment have been reported for Korean women in a national report.19 Nonetheless, the magnitude of educational inequality in cervical cancer screening was still higher for Korea than that for other countries, suggesting an area with room for improvement.
Inequalities in household income were even wider than those in educational attainment and were significant for both cervical and breast cancer screening. Income inequalities in several countries with subsidized population-based cancer screening programs have been also demonstrated.182021 Despite the lack of a nationwide health insurance program, the Medicaid program in the United States supports cancer screening and diagnostic services through the Breast and Cervical Cancer Early Detection Program. Nevertheless, several problems in reaching uninsured and underinsured women have been shown to affect income inequalities in breast and cervical cancer screening.20 In the UK, women with a car in the household, as an indicator of income inequality, were more likely to undergo mammography, although possible mechanisms were not defined.21 The “inverse equity hypothesis” was developed to explain income inequalities in Taiwanese cancer screening programs.18 Although the Taiwanese national cancer screening program also covers cervical cancer screening, inequalities in household income were found to have increased from 2001 to 2009. The authors explained that household income inequalities could be transient effects of the hypothesis, and also proposed an interaction between urbanization and household income levels.18 In Korea, lower income levels were shown to lower the odds of undergoing cervical cancer screening.4 In addition, despite reducing out-of-pocket expenses with the introduction the NSCP, inequalities in household income levels did not change much in absolute terms. In potential explanation thereof, more advantaged groups have been found to be more likely to participate in both organized and opportunistic screening. This is partly explained by the fact that more advantaged individuals are more concerned about their health. Further, lack of accessibility and availability of screening facilities, lack of time, and economic reasons may be as possible mechanisms causing income inequalities to remain in cancer screening services.
Our study has a few limitations. We administered self-reported surveys to the participants, possibly introducing recall bias in describing past screening experiences or socioeconomic variables. Further, several factors influencing participation in cervical and breast cancer screening, beyond education and income level, such as accessibility and availability of screening facilities, were not considered and should be further studied.
In spite of the limitations, this study is important in that we analyzed nationwide socioeconomic inequalities in cervical and breast cancer screening uptake among Korean women. Although the NCSP is designed to increase availability of cancer screening services, inequalities in household income levels remain significant among Korean women. Specifically, socioeconomic inequalities in cervical cancer screening participation were found to be more profound than those in breast cancer screening. Thus, further study is needed with additional information to outline longitudinal trends and identify other factors related with inequalities in cervical and breast cancer screening.
Go to :
 XML Download