

 PDF
PDF ePub
ePub Citation
 Print
Print


Abstract
Purpose
Methods
Results
Conclusions
Figures and Tables
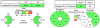 | Figure 1Peripapillary retinal nerve fiber layer (RNFL) and macular ganglion cell-inner plexiform layer (GCIPL) thickness in Cirrus optical coherence tomography (OCT). (A) OCT shows the RNFL thicknesses of average and four-quadrant in both eyes. (B) OCT shows GCIPL thicknesses of average and six-sector in both eyes. OD = oculus dexter; OS = oculus sinister; GCL = ganglion cell layer; IPL = inner plexiform layer; S = superior; T = temporal; N = nasal; I = inferior; NA = non-available.
|
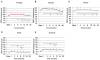 | Figure 2Longitudinal changes in the average and four-quadrant thicknesses (µm) of the peripapillary retinal nerve fiber layer (RNFL) after panretinal photocoagulation (PRP). The RNFL thicknesses (average and four-quadrant) increased at 1 month after PRP and had declined continuously since then (A–E). Repeated-measures analysis of variance corrected by Bonferroni method showed that the RNFL thicknessess (average and four-quadrant) increased at 1 year after PRP (all p < 0.05), but there was no statistically significant difference of the average, inferior, nasal and temporal thicknesses of the RNFL between pre-PRP and 3 years after PRP (A, C–E). The superior RNFL thickness (93.93 ± 7.49 µm) decreased at 3 years after PRP from the thickness (92.27 ± 7.76 µm) before PRP (p = 0.442) (B). *p < 0.05 by repeated-measures analysis of variance corrected by the Bonferroni methods; †p < 0.05 by paired t-test.
|
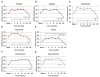 | Figure 3Longitudinal changes in the average and six-sector thicknesses (µm) of the macular ganglion cell-inner plexiform layer (GCIPL) after panretinal photocoagulation (PRP). Repeated-measures analysis of variance corrected by Bonferroni method showed that macular GCIPL thicknesses (average and 6-sector) increased in 1 year after PRP (all p < 0.05). The average GCIPL thickness showed a tendency to increase until 1 year, but to decrease continuously from 2 year after PRP. There was no statistically significant difference of the average, superior, superonasal, inferior, inferotemporal and superotemporal GCIPL thicknesses between pre-PRP and 3 years after PRP (A–C, E–G). The inferonasal GCIPL thickness (81.87 ± 19.0 µm) decreased at 3 years after PRP from the thickness (85.00 ± 4.80 µm) before PRP (p = 0.544) (D). *p < 0.05 by repeated-measures analysis of variance corrected by the Bonferroni methods; †p < 0.05 by by paired t-test.
|
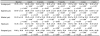
Table 1
Demographics and clinical data
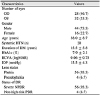
Values are presented as mean ± SD or n (%) unless otherwise indicated.
OD = oculus dexter; OS = oculus sinister; HTN = hypertension; DM = diabetes mellitus; HbA1c = hemoglobin A1c; BCVA = best-corrected visual acuity; IOP = intraocular pressure; DR = diabetic retinopathy; NPDR = non-proliferative diabetic retinopathy; PDR = proliferative diabetic retinopathy.
![]()
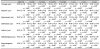
Table 2
Longitudinal changes in peripapillary retinal nerve fiber layer thickness after panretinal photocoagulation
![]()
Notes
Dong Ho Park was financially supported by the Basic Science Research Program of the National Research Foundation of Korea (NRF), funded by the Ministry of Education (NRF-2017R1D1A1B03027966), and the Korea Health Technology R&D Project of the Korea Health Industry Development Institute (KHIDI), funded by the Ministry of Health & Welfare, Republic of Korea (HI16C1501).
Dai Woo Kim was financially supported by the Basic Science Research Program of the National Research Foundation of Korea (NRF), funded by the Ministry of Education (NRF-2017R1D1A1B03035483).
 XML Download