Abstract
Objective
To investigate the effect of incomplete antenatal corticosteroid therapy (ACST) prior to delivery on clinical outcomes of preterm infants.
Methods
Preterm infants born between 24 0/7 and 33 6/7 weeks of gestation from 2010 through 2016 were included and divided into the three groups according to the ACST; the no ACST group, the incomplete ACST group (inadequate dose of antenatal corticosteroid in pregnancy), and the complete ACST group (recommended dose of antenatal corticosteroid in pregnancy). The effect of risk factors including ACST on clinical outcomes of preterm infants was further explored using logistic regression analysis.
Results
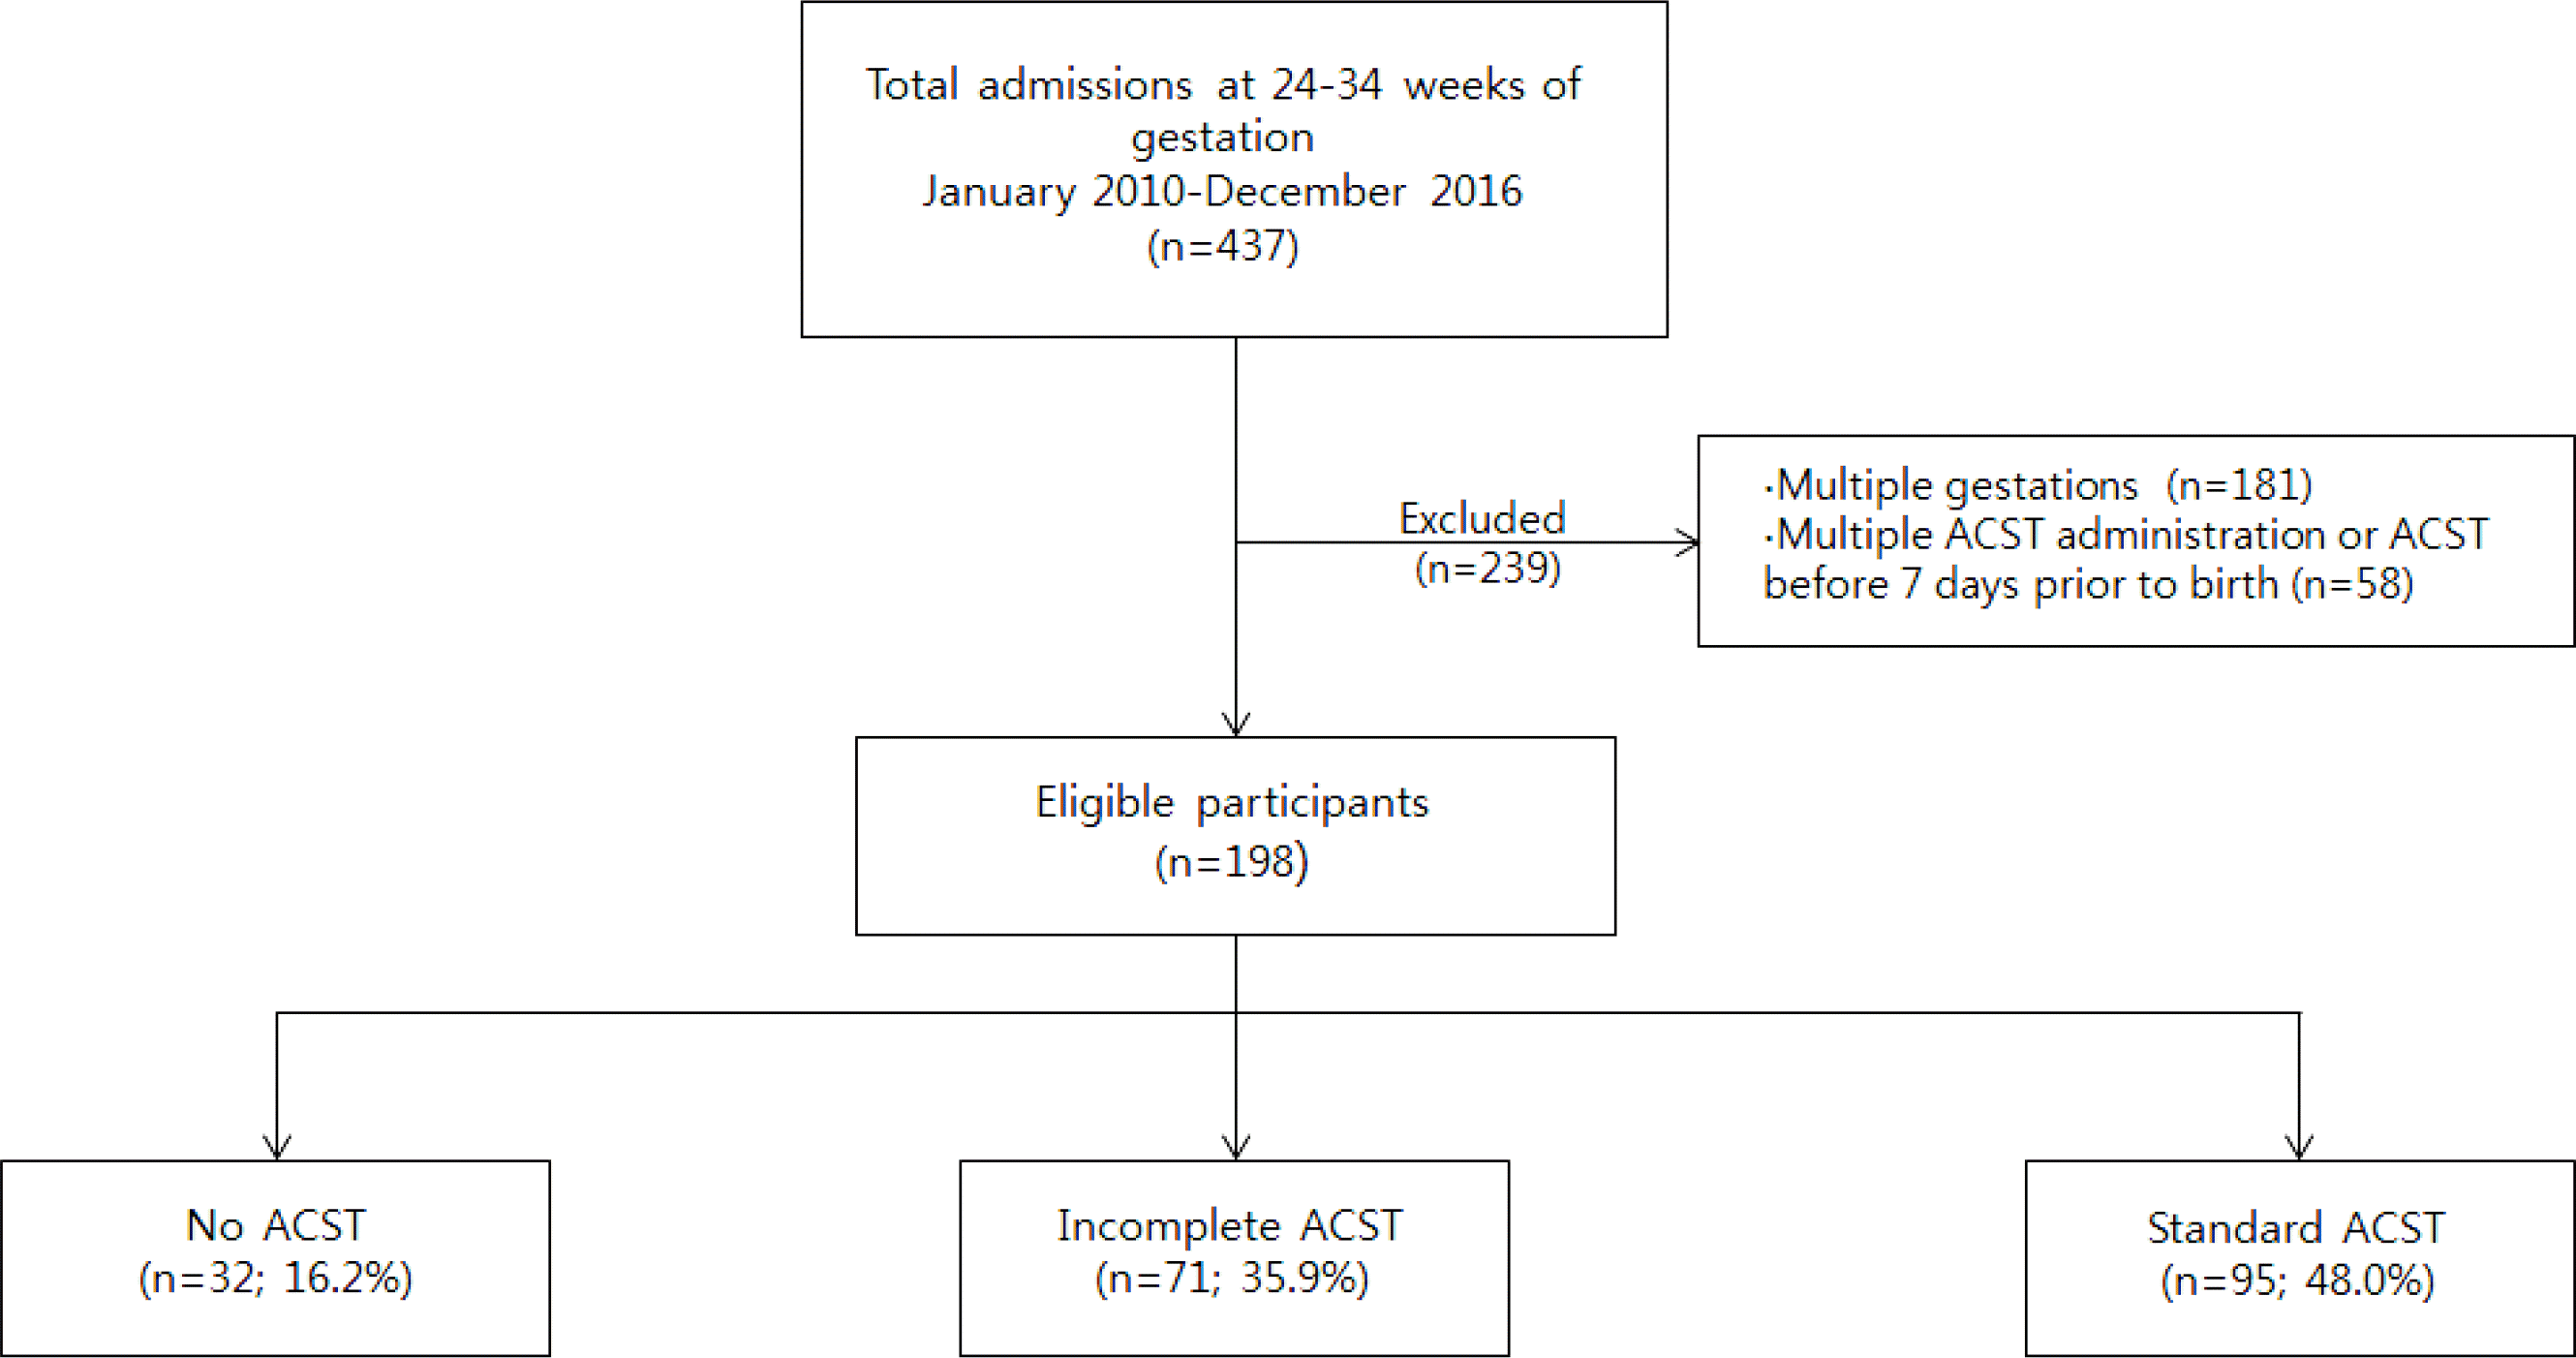
Among 198 infants who fulfilled the study criteria, 32 (16.2%) were classified as the no ACST group, 71 (35.9%) as the incomplete ACST group, and 95 (48.0%) as the complete ACST group. The incidence of low Apgar score at 5-minutes (≤4) was significantly higher in the no ACST group than in the complete ACST group (adjusted odds ratio [OR] 4.49; 95% confidence interval [CI] 1.41-14.32; P=0.011). The incidence of necrotizing enterocolitis (NEC, stage ≥2a) was not different between the no ACST group and the incomplete/the complete group, but significantly higher in the incomplete ACST group than in the complete ACST group (adjusted OR 10.49; 95% CI 1.13-97.28; P=0.039).
Go to : 
REFERENCES
1). Crowley P., Chalmers I., Keirse MJ. The effects of corticosteroid administration before preterm delivery: an overview of the evidence from controlled trials. Br J Obstet Gynaecol. 1990. 97:11–25.

2). Wright LL., Verter J., Younes N., Stevenson D., Fanaroff AA., Shankaran S, et al. Antenatal corticosteroid administration and neonatal outcome in very low birth weight infants: the NICHD Neonatal Research Network. Am J Obstet Gynecol. 1995. 173:269–74.

3). Liggins GC. Premature delivery of foetal lambs infused with glucocorticoids. J Endocrinol. 1969. 45:515–23.

4). Ahn HM., Park EA., Cho SJ., Kim YJ., Park HS. The association of histological chorioamnionitis and antenatal steroids on neonatal outcome in preterm infants born at less than thirty-four weeks' gestation. Neonatology. 2012. 102:259–64.

5). Higgins RD., Mendelsohn AL., DeFeo MJ., Ucsel R., Hendricks-Munoz KD. Antenatal dexamethasone and decreased severity of retinopathy of prematurity. Arch Ophthalmol. 1998. 116:601–5.

6). Cho JS. Recommended protocol for antenatal corticosteroid. Korean J Perinatol. 2004. 15:7–13.
7). Ballard PL., Ballard RA. Scientific basis and therapeutic regimens for use of antenatal glucocorticoids. Am J Obstet Gynecol. 1995. 173:254–62.

8). Committee on Obstetric Practice. Committee opinion No. 713: antenatal corticosteroid therapy for fetal maturation. Obstet Gynecol. 2017. 130:e102–9.
9). Roberts D., Brown J., Medley N., Dalziel SR. Antenatal corticosteroids for accelerating fetal lung maturation for women at risk of preterm birth. Cochrane Database Syst Rev. 2017. 3:CD004454.

10). Melamed N., Shah J., Soraisham A., Yoon EW., Lee SK., Shah PS, et al. Association between antenatal corticosteroid administration-to-birth interval and outcomes of preterm neonates. Obstet Gynecol. 2015. 125:1377–84.

11). Wong D., Abdel-Latif M., Kent A. NICUS Network. Antenatal steroid exposure and outcomes of very premature infants: a regional cohort study. Arch Dis Child Fetal Neonatal Ed. 2014. 99:F12–20.

12). Park SH., Kim JS., Lim DO. Adverse child's birth outcomes and maternal age at birth: 1997-98, 2014-15 birth certificate data of Korea. J Health Info Stat. 2017. 42:294–300.

13). Kim SM., Park CW. Progesterone for the prevention of preterm birth. Korean J perinatol. 2010. 21:211–20.
14). Bartholomew J., Kovacs L., Papageorgiou A. Review of the antenatal and postnatal use of steroids. Indian J Pediatr. 2014. 81:466–72.

15). Apgar V. A proposal for a new method of evaluation of the newborn. Classic Papers in Critical Care. 1952. 32:97.
16). Horbar JD., Badger GJ., Carpenter JH., Fanaroff AA., Kilpatrick S., LaCorte M, et al. Trends in mortality and morbidity for very low birth weight infants, 1991-1999. Pediatrics. 2002. 110(1 Pt 1):143–51.

17). Holman RC., Stoll BJ., Clarke MJ., Glass RI. The epidemiology of necrotizing enterocolitis infant mortality in the United States. Am J Public Health. 1997. 87:2026–31.

18). Been JV., Lievense S., Zimmermann LJ., Kramer BW., Wolfs TG. Chorioamnionitis as a risk factor for necrotizing enterocolitis: a systematic review and meta-analysis. J Pediatr. 2013. 162:236–42. .e2.
19). Yan X., Liu X., Managlia E., De Plaen I. Prenatal exposure to inflammation decreases endothelial cell proliferation in the mouse intestinal mucosa. FASEB J. 2015. 29(1_supplement):LB421.

20). Kim SM., Yoon HS., Kim KS., Bae CW. The importance and the need of early pulmonary surfactant therapy in premature infant with respiratory distress syndrome. J Korean Soc Neonatol. 2009. 16:101–9.
Go to : 
 | Fig. 1Flow diagram showing the study design of 198 preterm infants included in this study. ACST, antenatal corticosteroid therapy. |
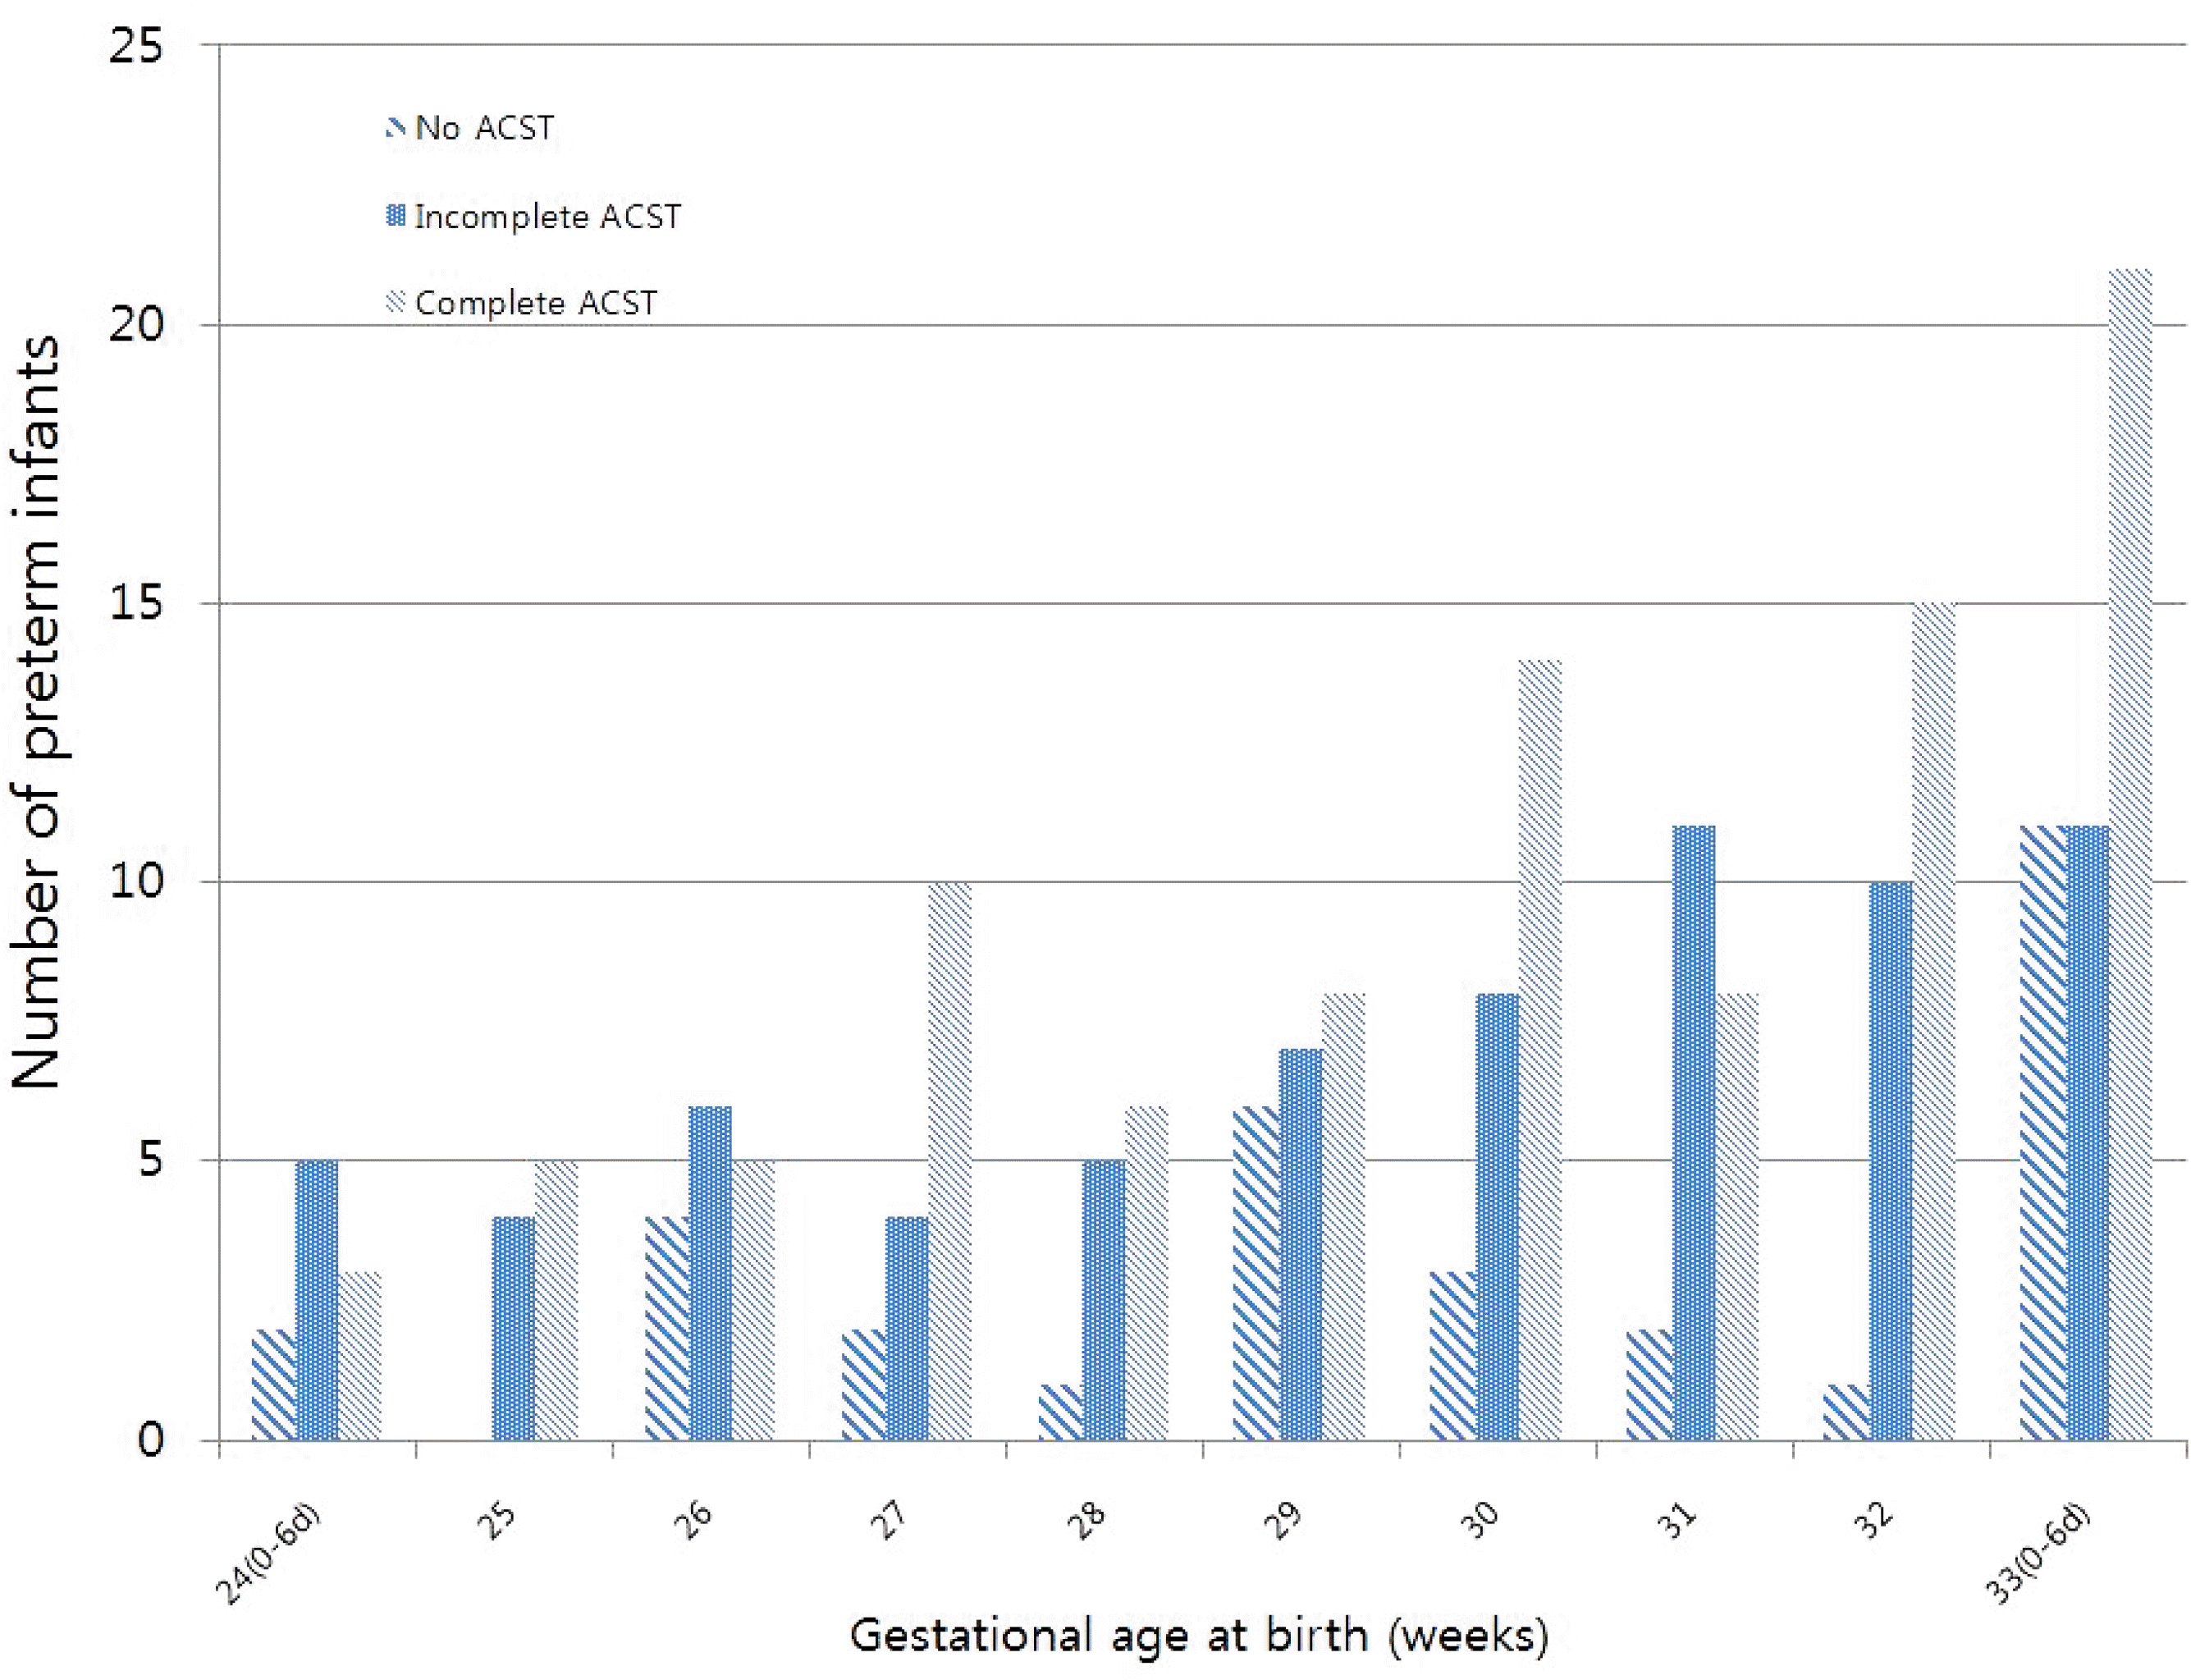
 | Fig. 2Distribution of gestational age at birth of each subgroup. ACST, antenatal corticosteroid therapy. |
Table 1.
Clinical Characteristics of the Study Subjects by Group
| Characteristic | No ACST (n=32) | ACST | Total (n=166) | |
|---|---|---|---|---|
| Incomplete ACST (n=71) | Complete ACST (n=95) | |||
| Male | 16 (50) | 30 (42) | 54 (57) | 84 (51) |
| Cesarean section | 12 (38) | 51 (72) | 56 (59) | 59 (36) |
| Gestational age (weeks) | 30.0±2.9 | 29.5±2.8 | 30.0±2.7 | 29.84±2.9 |
| Birth weight (g) | 1,580.2±704.6 | 1,465.6±626.4 | 1,426.5±547.0 | 1,443.2±537.0 |
| Head circumference (cm) | 27.6±3.5 | 27.5±3.8 | 27.3±3.0 | 27.4±3.1 |
| 1-min Apgar scores | 5.0 (4.0-7.0) | 5.0 (4.5-7.0) | 6.0 (5.0-8.0) | 6.0 (5.0-7.0) |
| 5-min Apgar scores | 8.0 (6.0-9.0) | 8.0 (7.0-9.0) | 8.0 (7.5-9.0) | 8.0 (7.0-9.0) |
| Gestational diabetes | 1 (0) | 3 (4) | 6 (6) | 9 (5) |
| Preeclampsia | 3 (1) | 10 (14) | 22 (23) | 32 (19) |
| PPROM | 5 (16) | 12 (17)∗ | 39 (41)† | 51 (31) |
| HCAM | 14 (44) | 30 (42) | 44 (46) | 74 (45) |
Table 2.
Neonatal Outcomes of the Study Subjects by Group
| Outcome | No ACST (n=32) | ACST | Total (n=166) | |
|---|---|---|---|---|
| Incomplete ACST (n=71) | Complete ACST (n=95) | |||
| Mortality | 4 (12) | 6 (8) | 5 (5) | 11 (7) |
| BPD (≥moderate) | 7 (22) | 9 (13) | 10 (11) | 19 (11) |
| 5-min Apgar scores (≤4) | 11 (34) | 11 (15)∗ | 15 (16)∗ | 26 (16)∗ |
| Sepsis (early-onset) | 1 (3) | 4 (5) | 6 (6) | 10 (6) |
| IVH (stage ≥3) | 2 (6) | 5 (7) | 5 (5) | 10 (6) |
| ROP (stage ≥3) | 1 (3) | 4 (6) | 6 (6) | 10 (6) |
| NEC (stage ≥2a) | 2 (6) | 6 (8)† | 1 (1) | 7 (4) |
| PDA | 16 (50) | 29 (41) | 39 (41) | 68 (41) |
| RDS | 17 (53) | 39 (55) | 45 (47) | 84 (50) |
Table 3.
Multiple Logistic Regression Analysis for Neonatal Outcomes According to the Antenatal Corticosteroid Therapy to Birth Interval
| Outcome | No ACST relative to complete ACST | No ACST relative to incomplete ACST | Incomplete ACST relative to complete ACST | ||||||
|---|---|---|---|---|---|---|---|---|---|
| Adjusted OR∗ | CI | P-value | Adjusted OR∗ | CI | P-value | Adjusted OR∗ | CI | P-value | |
| Mortality | 2.64 | 0.40-17.47 | 0.31 | 2.72 | 0.53-14.05 | 0.23 | 1.99 | 0.45-8.82 | 0.37 |
| 5-min Apgar scores (≤4) | 4.49 | 1.41-14.32 | 0.011 | 3.38 | 1.19-9.59 | 0.022 | 0.91 | 0.36-2.32 | 0.85 |
| Sepsis (early-onset) | 0.24 | 0.02-2.61 | 0.24 | 0.41 | 0.04-4.62 | 0.47 | 0.91 | 0.21-3.88 | 0.90 |
| BPD (≥moderate) | 1.54 | 0.49-4.89 | 0.46 | 1.15 | 0.36-3.72 | 0.82 | 1.11 | 0.43-2.87 | 0.84 |
| IVH (stage ≥3) | 0.79 | 0.09-6.72 | 0.83 | 1.14 | 0.17-7.57 | 0.89 | 1.46 | 0.33-6.50 | 0.62 |
| ROP (stage ≥3) | 2.54 | 0.13-47.98 | 0.54 | 1.14 | 0.07-17.91 | 0.92 | 0.68 | 0.14-3.36 | 0.64 |
| NEC (stage ≥2a) | 6.16 | 0.47-81.24 | 0.17 | 0.74 | 0.11-5.20 | 0.76 | 10.49 | 1.13-97.28 | 0.039 |
| RDS | 1.62 | 0.41-4.26 | 0.33 | 1.11 | 0.44-2.84 | 0.82 | 1.45 | 0.71-2.96 | 0.32 |
| PDA | 1.86 | 0.73-4.74 | 0.19 | 2.06 | 0.75-5.69 | 0.16 | 1.00 | 0.44-2.23 | 0.99 |


 PDF
PDF ePub
ePub Citation
 Print
Print


 XML Download