Abstract
Purpose
The purpose of this study is to develop a simple method to measure magnetic susceptibility of arbitrarily shaped materials through MR imaging and numerical modeling.
Materials and Methods
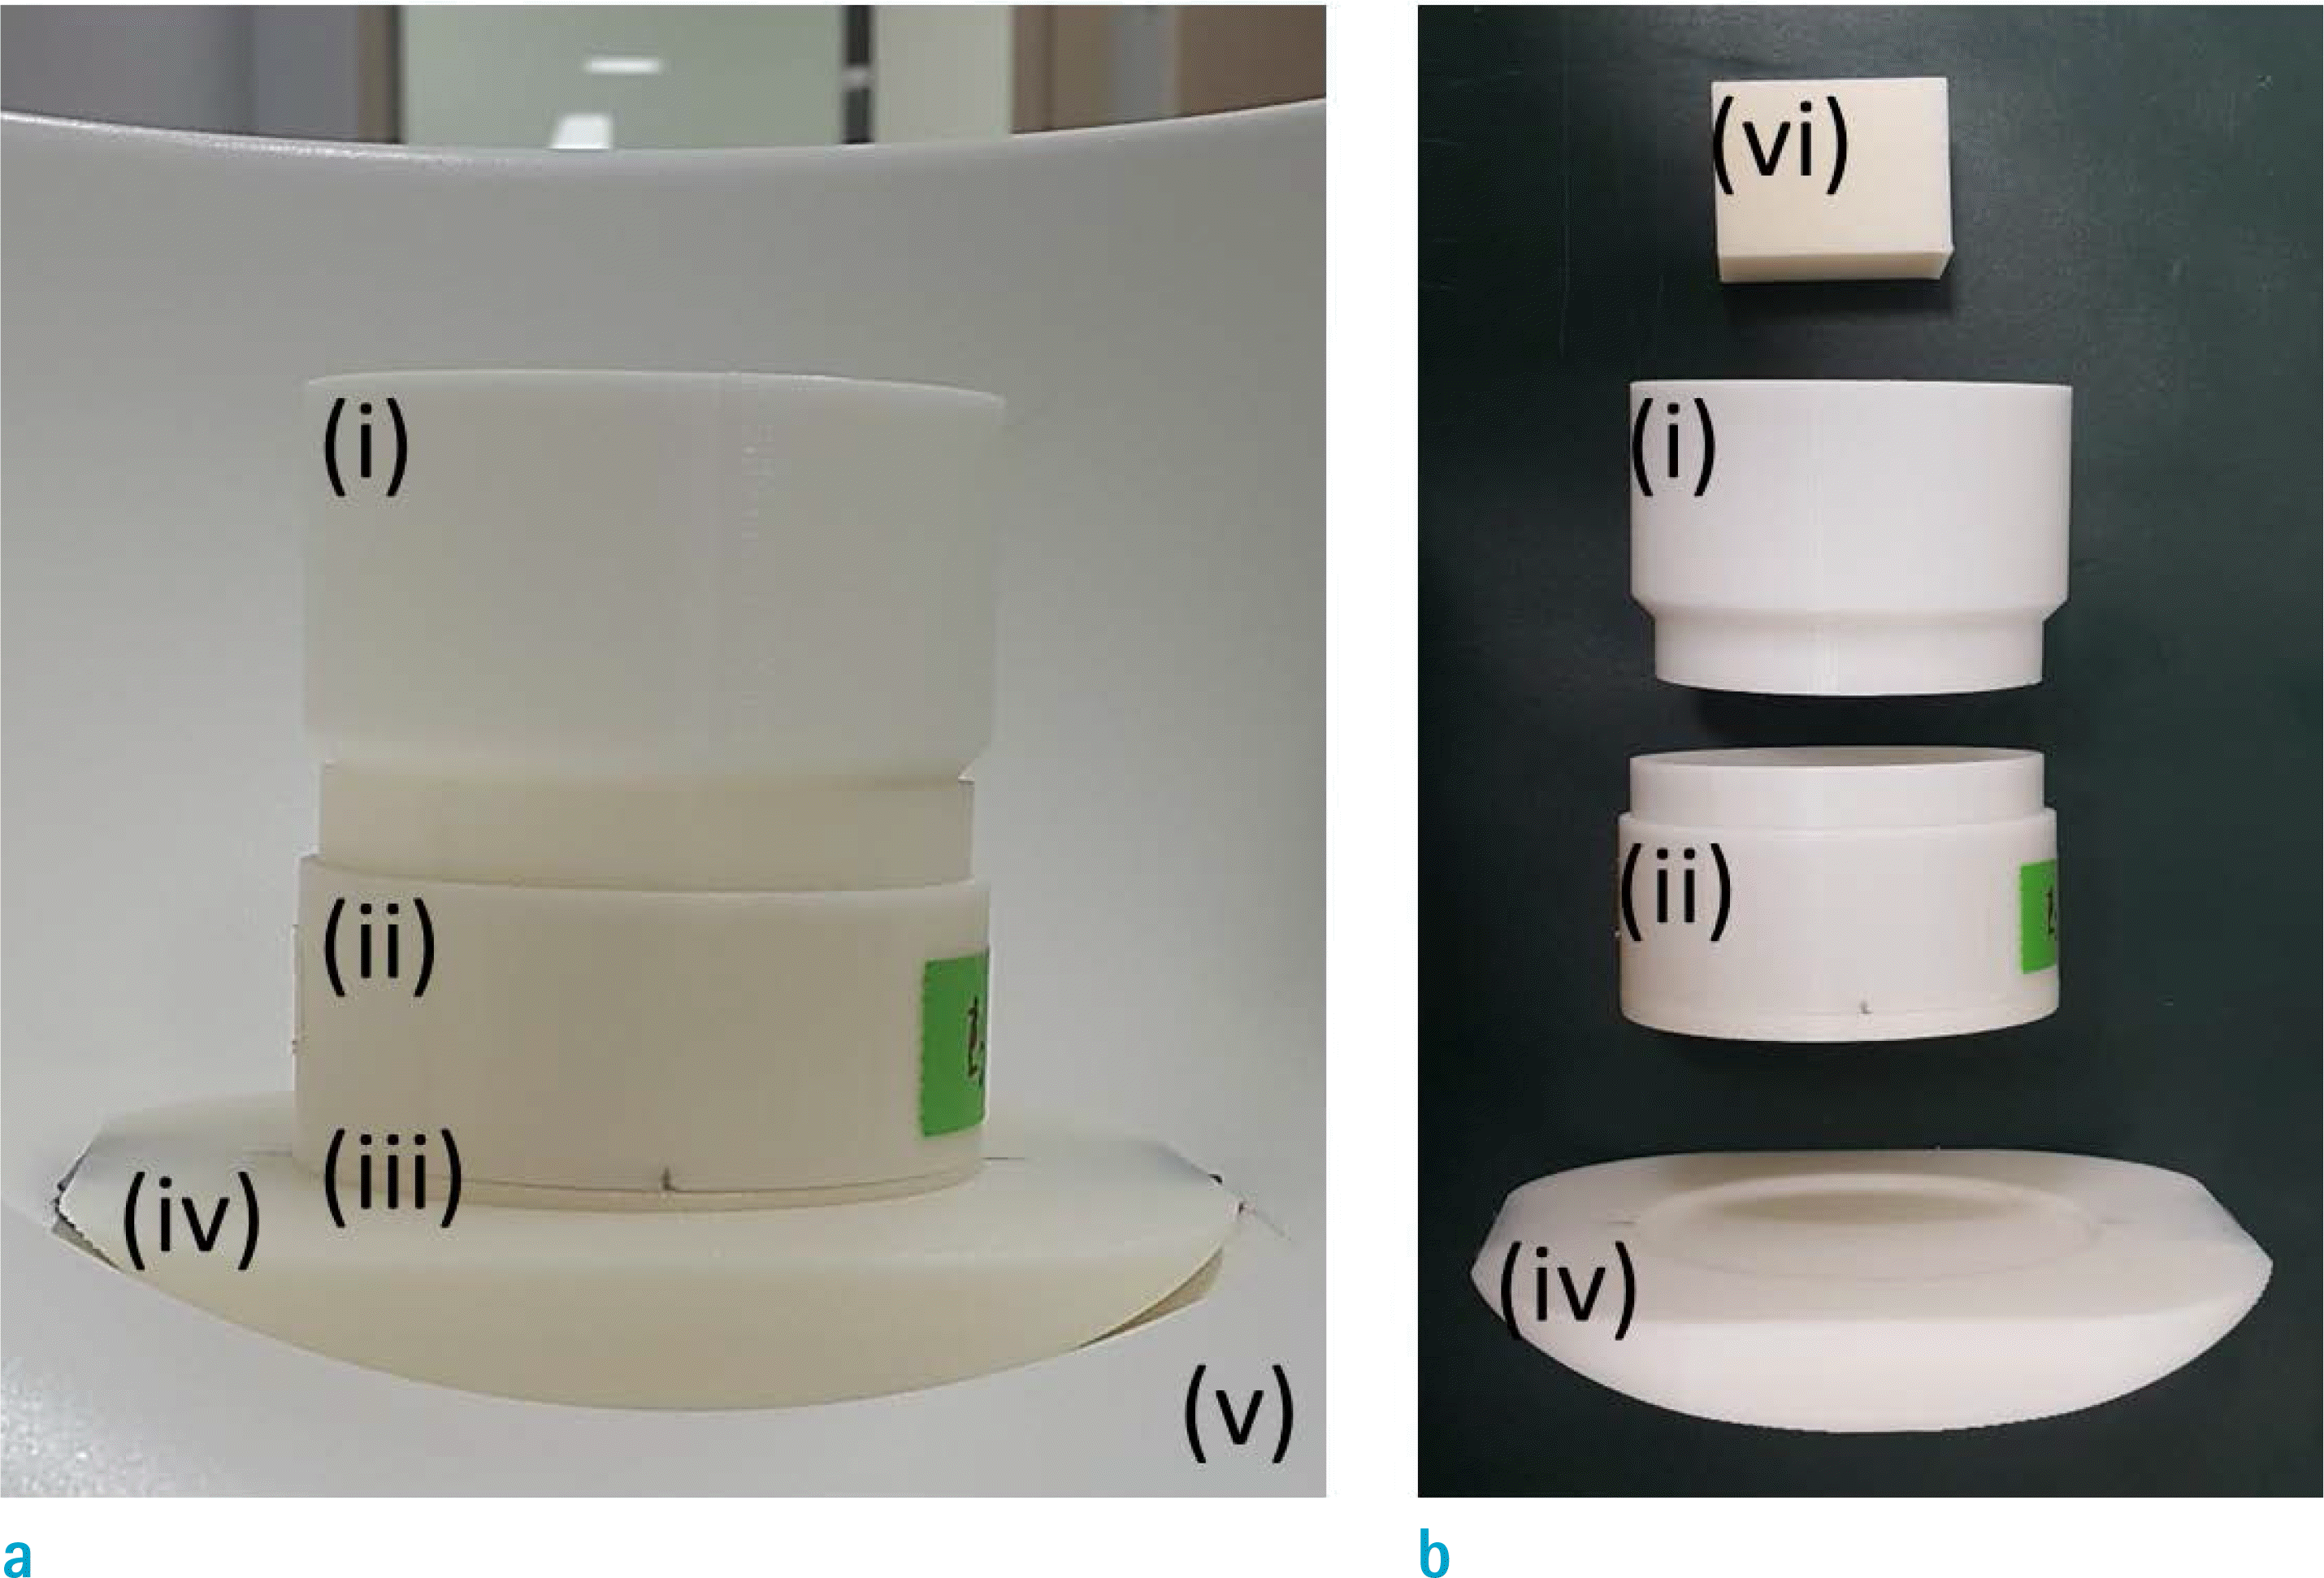
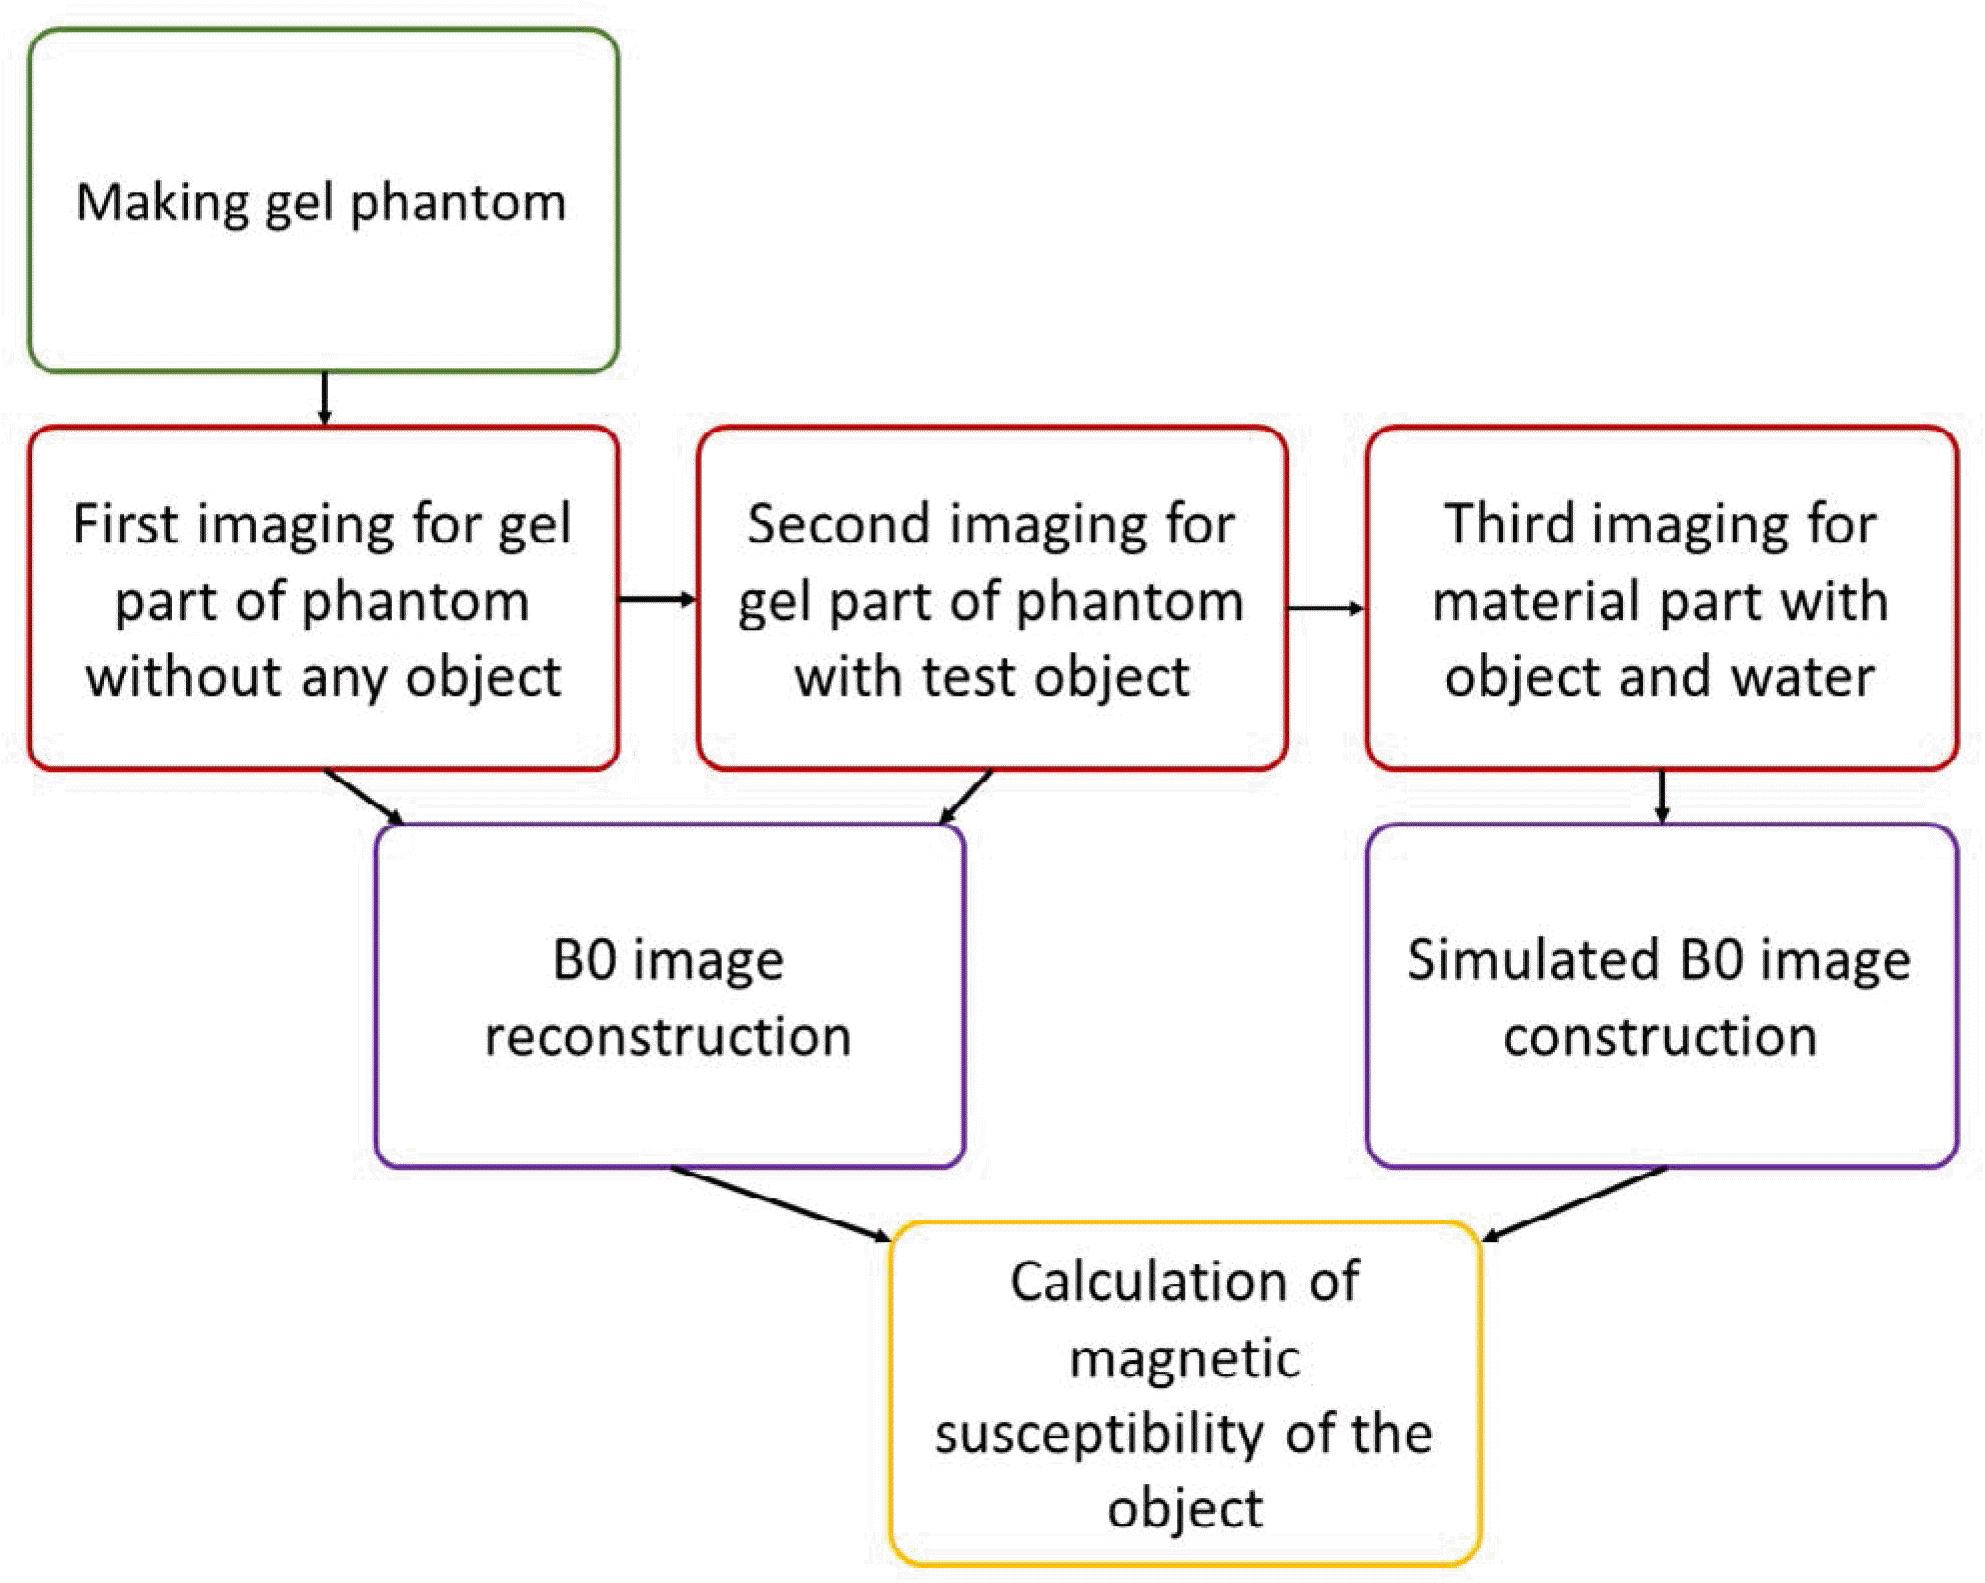
Our 3D printed phantom consists of a lower compartment filled with a gel (gel part) and an upper compartment for placing a susceptibility object (object part). The B0 maps of the gel with and without the object were reconstructed from phase images obtained in a 3T MRI scanner. Then, their difference was compared with a numerically modeled B0 map based on the geometry of the object, obtained by a separate MRI scan of the object possibly immersed in an MR-visible liquid. The susceptibility of the object was determined by a least-squares fit.
Results
A total of 18 solid and liquid samples were tested, with measured susceptibility values in the range of −12.6 to 28.28 ppm. To confirm accuracy of the method, independently obtained reference values were compared with measured susceptibility when possible. The comparison revealed that our method can determine susceptibility within approximately 5%, likely limited by the object shape modeling error.
Go to : 
References
1. Schenck JF. The role of magnetic susceptibility in magnetic resonance imaging: MRI magnetic compatibility of the first and second kinds. Med Phys. 1996; 23:815–850.

2. Schwartz B. Superconductor applications: SQUIDs and machines. Springer Science & Business Media New York: Springer US,. 2013.
3. MPMS 3 Product Description. Available from:. https://www.qdusa.com/sitedocs/productBrochures/1500-102.pdf. Accessed September 8,. 2018.
4. Wapler MC, Leupold J, Dragonu I, von Elverfeld D, Zaitsev M, Wallrabe U. Magnetic properties of materials for MR engineering, micro-MR and beyond. J Magn Reson. 2014; 242:233–242.

5. Neelavalli J, Cheng YC, Haacke EM. A fast and robust method for quantifying magnetic susceptibility of arbitrarily shaped objects using MR. Proc Intl Soc Mag Reson Med. 2008; 16:3056.
6. Yoder DA, Zhao Y, Paschal CB, Fitzpatrick JM. MRI simulator with object-specific field map calculations. Magn Reson Imaging. 2004; 22:315–328.

7. Lee SK, Hwang SH, Barg JS, Yeo SJ. Rapid, theoretically artifact-free calculation of static magnetic field induced by voxelated susceptibility distribution in an arbitrary volume of interest. Magn Reson Med. 2018; 80:2109–2121.

8. Chu SC, Xu Y, Balschi JA, Springer CS Jr. Bulk magnetic susceptibility shifts in NMR studies of compartmentalized samples: use of paramagnetic reagents. Magn Reson Med. 1990; 13:239–262.

9. Joe E, Ghim MO, Ha Y, Kim DH. Accurate localization of metal electrodes using magnetic resonance imaging. J Korean Soc Magn Reson Med. 2011; 15:11–21.

10. Czervionke LF, Daniels DL, Wehrli FW, et al. Magnetic susceptibility artifacts in gradient-recalled echo MR imaging. AJNR Am J Neuroradiol. 1988; 9:1149–1155.
Go to : 
 | Fig. 1.(a, b) Pictures of the phantom. The phantom consists of an object part (i), gel part (ii), cap for the gel part (iii), supporter (iv), and the object (vi), and is placed in the posterior half of a head coil (v). The gel part and the object part can be detached as shown in (b). |
 | Fig. 2.Illustration of the workflow of the method to measure magnetic susceptibility by MRI. |
 | Fig. 3.Images of the object part (a) and the gel part (b) of the phantom, and their combination obtained by post-processing (c). (a) and (b) correspond to the third and the first images, respectively, on the transverse plane. |
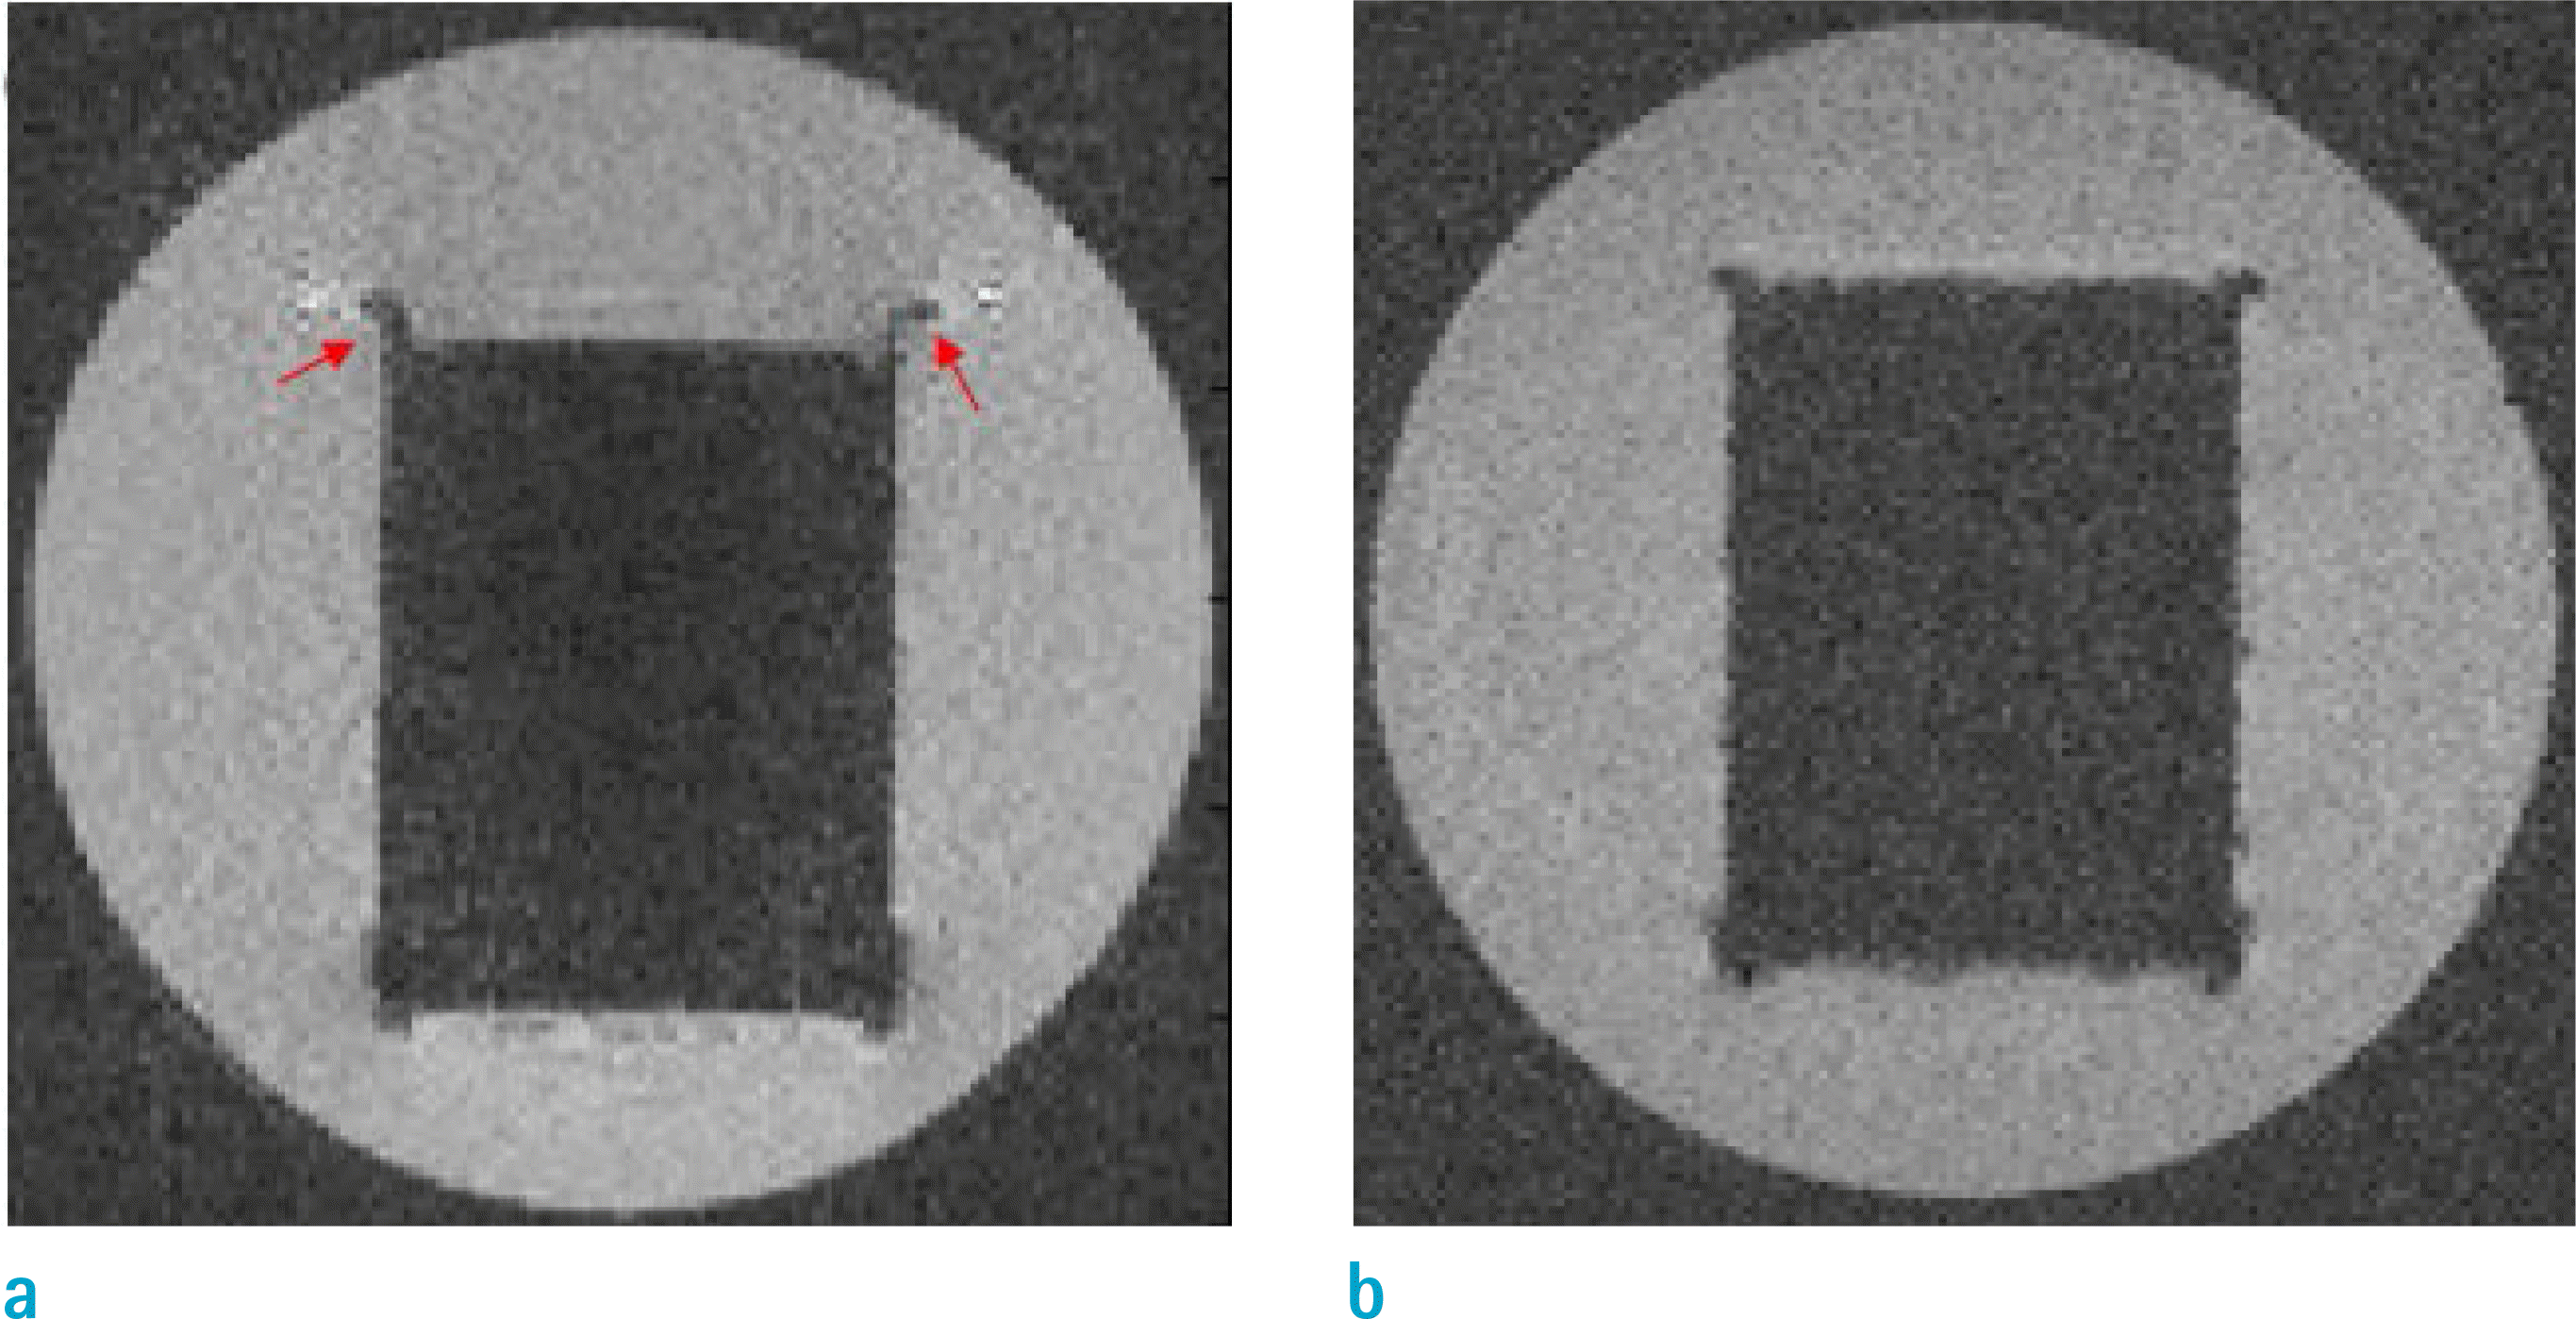
 | Fig. 4.Reduction of susceptibility artifacts on the object immersed in paramagnetic Gadolinium solution. (a) Magnitude image of a grey 3D printing material in tap water. (b) Magnitude image of the same material in a gadolinium solution (χ = 8.54 ppm). Red arrows indicate signal loss artifacts. Images are shown on a coronal plane. |
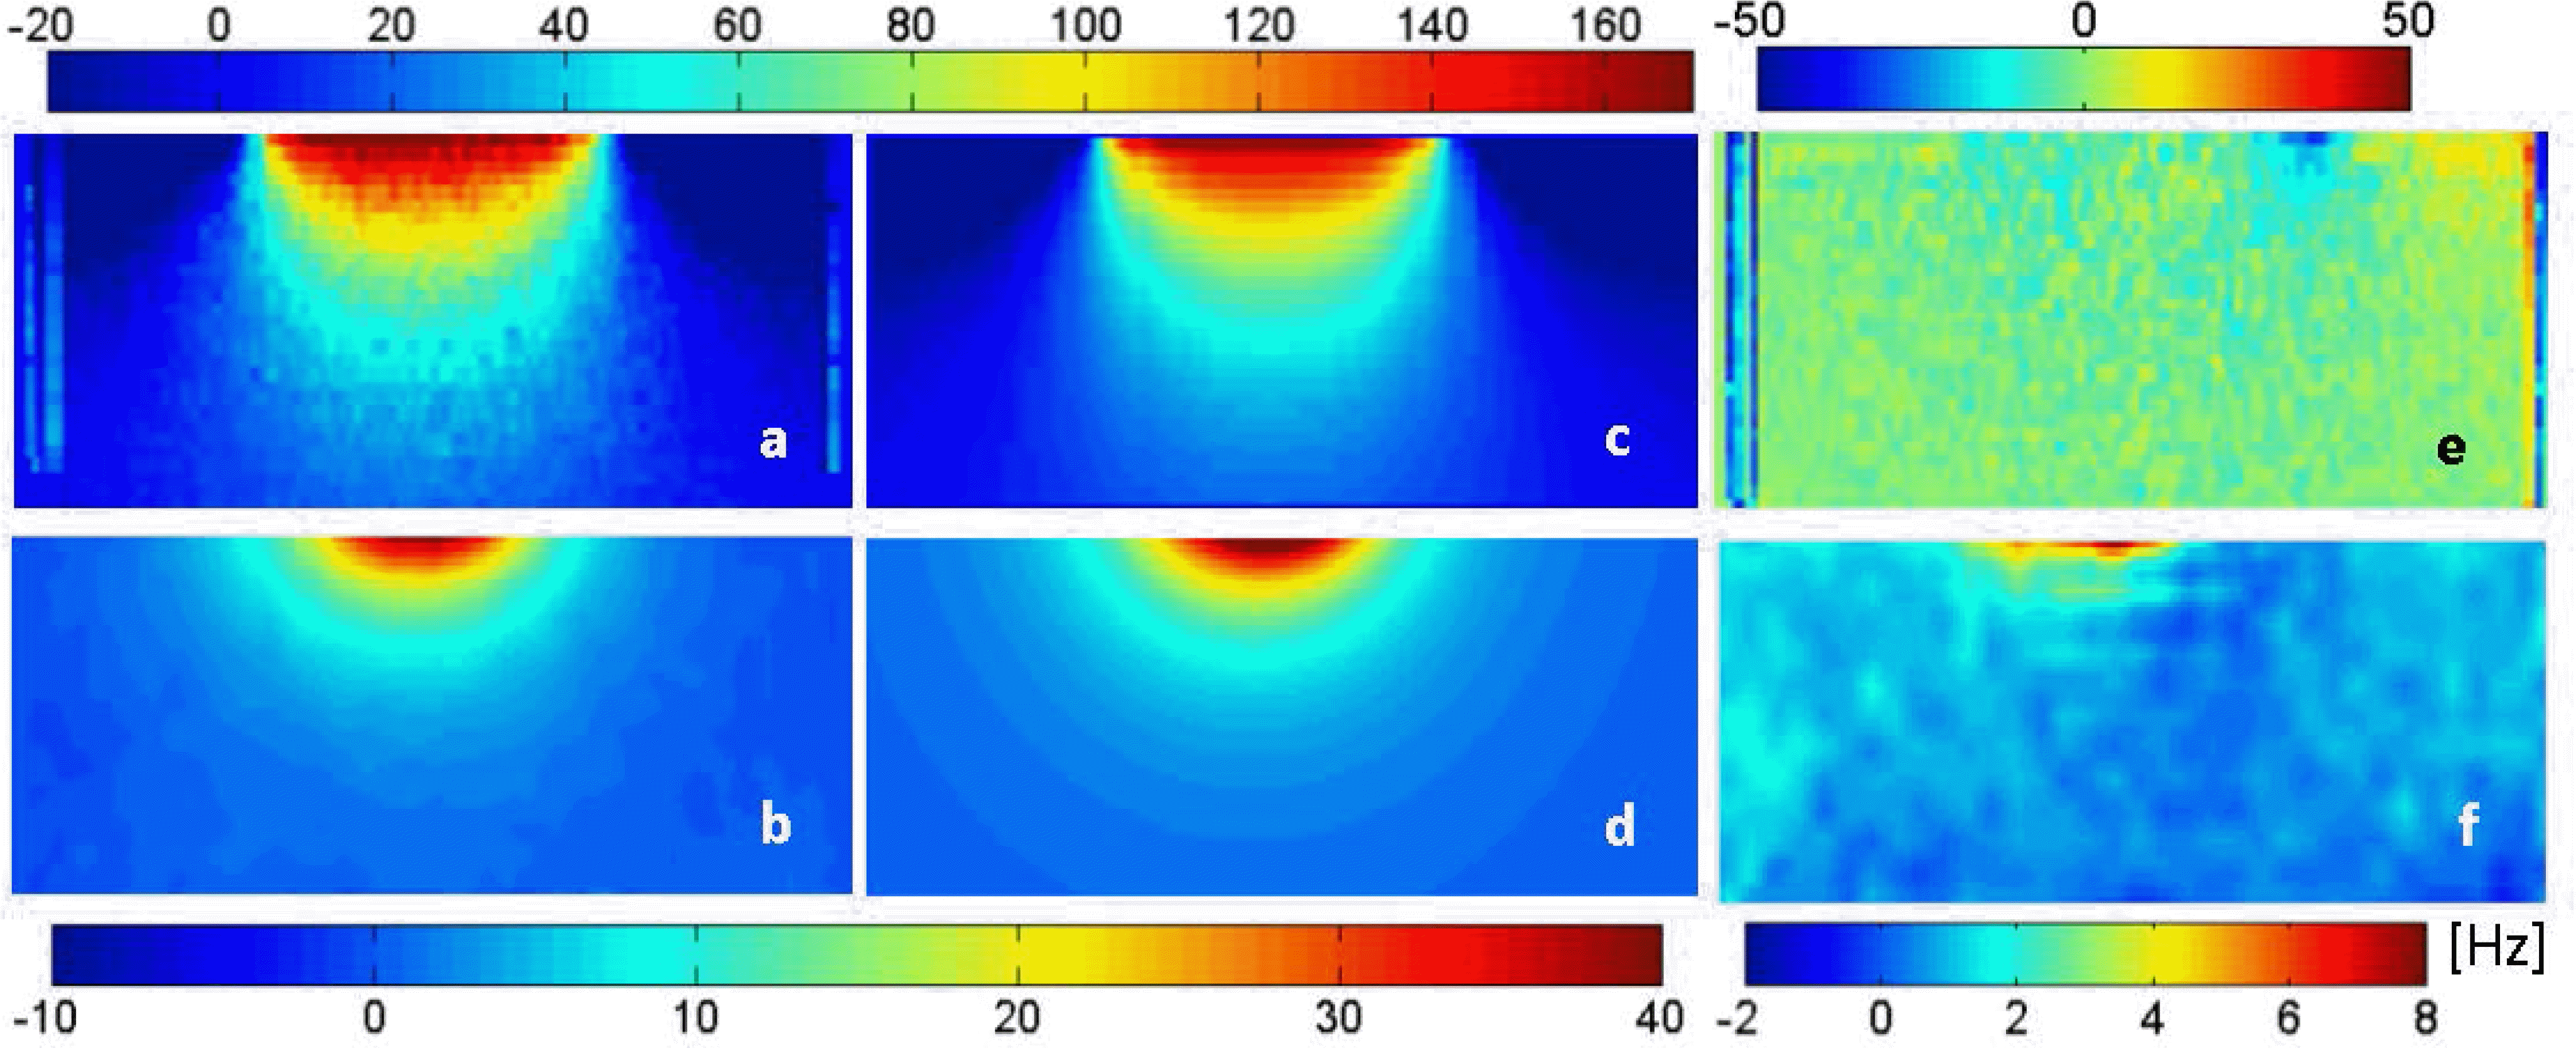
 | Fig. 5.B0 map comparison: measured B0 maps (a, b), simulated B0 maps (c, d), and error (= simulated minus measured) maps (e, f). Note differences in color scales. (a, c, e) are from the ivory cuboid sample and (b, d, f) are from ceramic screws which had fine features. |
Table 1.
(a) Magnetic susceptibility of several materials measured by the proposed method. (b, c) Comparison between the reference and measured values


 PDF
PDF ePub
ePub Citation
 Print
Print


 XML Download