Abstract
To determine the optimum extraction conditions that give the highest yield of isoquercitrin and caffeic acid from Aster scaber, the effects of four extraction variables (solvent concentrations, extraction time, number of repeated extraction, and solvent volumes) on isoquercitrin and caffeic acid yield was examined via HPLC-UV. Our results showed that the highest extract and isoquercitrin yield were observed when A. scaber was extracted with 450 mL distilled water for 8 hr repeatedly for three times. In case of caffeic acid, the content was higher in the two repeated extracts. Also, content analysis of isoquercitrin in Aster species was performed in which A. fastigiatus, A. ageratoides, and A. scaber exhibited the highest isoquercitrin content at 6.39, 5.68, and 2.79 mg/g extract, respectively. In case of caffeic acid, the highest content of A. scaber and A. glehni was 0.64 and 0.56 mg/g extract, respectively. This study reports an optimized method for extraction of isoquercitrin and caffeic acid from A. scaber and evaluates potential sources of the compounds.
Go to : 
REFERENCES
(1). Jung C. M., Kwon H. C., Seo J. J., Ohizumi Y., Matsunaga K., Saito S., Lee K. R.Chem. Pharm. Bull. 2001; 49:912–914.
(2). Kim H. M., Lee D. G., Cho E. J., Choi K., Ku J. J., Park K. W., Lee S. H.Hort. Environ. Biotechnol. 2013; 54:183–189.
(3). Nugroho A., Kim K. H., Lee K. R., Alam M. B., Choi J. S., Kim W. B., Park H. J.Arch. Pharm. Res. 2009; 32:1361–1367.
(4). Chung T. Y., Eiserich J. P., Shibamoto T. J.Agric. Food Chem. 1993; 41:1693–1697.
(5). Kwon H. C., Jung C. M., Shin C. G., Lee J. K., Choi S. U., Kim S. Y., Lee K. R.Chem. Pharm. Bull. 2000; 48:1796–1798.
(6). Woo J. H., Jeong H. S., Yu J. S., Chang Y. D., Lee C. H.Korean J. Plant Res. 2008; 21:52–59.
(7). Chung M. J., Lee S., Park Y. I., Lee J., Kwon K. H.Life Sci. 2016; 148:173–182.
(8). Choi N. S., Oh S. S., Lee J. M.Koeran J. Food Sci. Technol. 2001; 6:745–752.
(9). Nugroho A., Kim K. H., Lee K. R., Alam M. B., Choi J. S., Kim W. B., Park H. J.Arch. Pharm. Res. 2009; 10:1361–1367.
(10). Kim S. A., Kim J. S.Korean J. Food Sci. Technol. 2012; 6:686–691.
(12). Jeong Y. S., Lee S. H., Song J., Hwang K. A., Noh G. M., Jang D. E., Hwang I. G.Korean J. Food Nutr. 2016; 29:767–776.
(13). Price K. R., Casuscelli F., Colquhoun I. J., Rhodes M. J. C. J.Sci. Food Agric. 1998; 77:468–472.
(14). Rogerio A. P., Kanashiro A., Fontanari C., da Silva E. V., Lucisano-Valim Y. M., Soares E. G., Faccioli L. H.Inflamm. Res. 2007; 56:402–408.
(15). Jung S. H., Kim B. J., Lee E. H., Osborne N. N.Neurochem. Int. 2010; 57:713–721.
(16). Gasparotto Junior A., Gasparotto F. M., Lourenco E. L., Crestani S., Stefanello M. E., Salvador M. J., de Silva-Santos J. E., Marques M. C., Kassuya A. L. J.Ethnopharmacol. 2011; 134:363–372.
(17). Makino T., Kanemaru M., Okuyama S., Shimizu R., Tanaka H., Mizukami H. J.Nat. Med. 2013; 67:881–886.
(18). Valentová K., Vrba J., Bancí ová M., Ulrichová J., K en V.Food Chem. Toxicol. 2014; 68:267–282.
(20). Chiou S. Y., Sung J. M., Huang P. W., Lin S. D. J.Med. Food. 2017; 20:140–151.
(21). Kim A. R., Jin Q., Jin H. G., Ko H. J., Woo E. R.Arch. Pharm. Res. 2014; 37:845–851.
(22). Yun J. E., Woo E. R., Lee D. G. J.Funct. Foods. 2016; 22:347–357.
(23). Kim H. K., Kwon Y. J., Kim Y. E., Nahmgung B.Korean J. Food Preserv. 2004; 1:88–93.
(24). Thiruvengadam M., Praveen N., Yu B. R., Kim S. H., Chung I. M.Acta Biol. Hung. 2014; 65:144–155.
(25). Nugroho A., Kim M. H., Choi J., Choi J., Jung W. T., Lee K. T., Park H. J.Arch. Pharm. Res. 2012; 35:423–430.
Go to : 
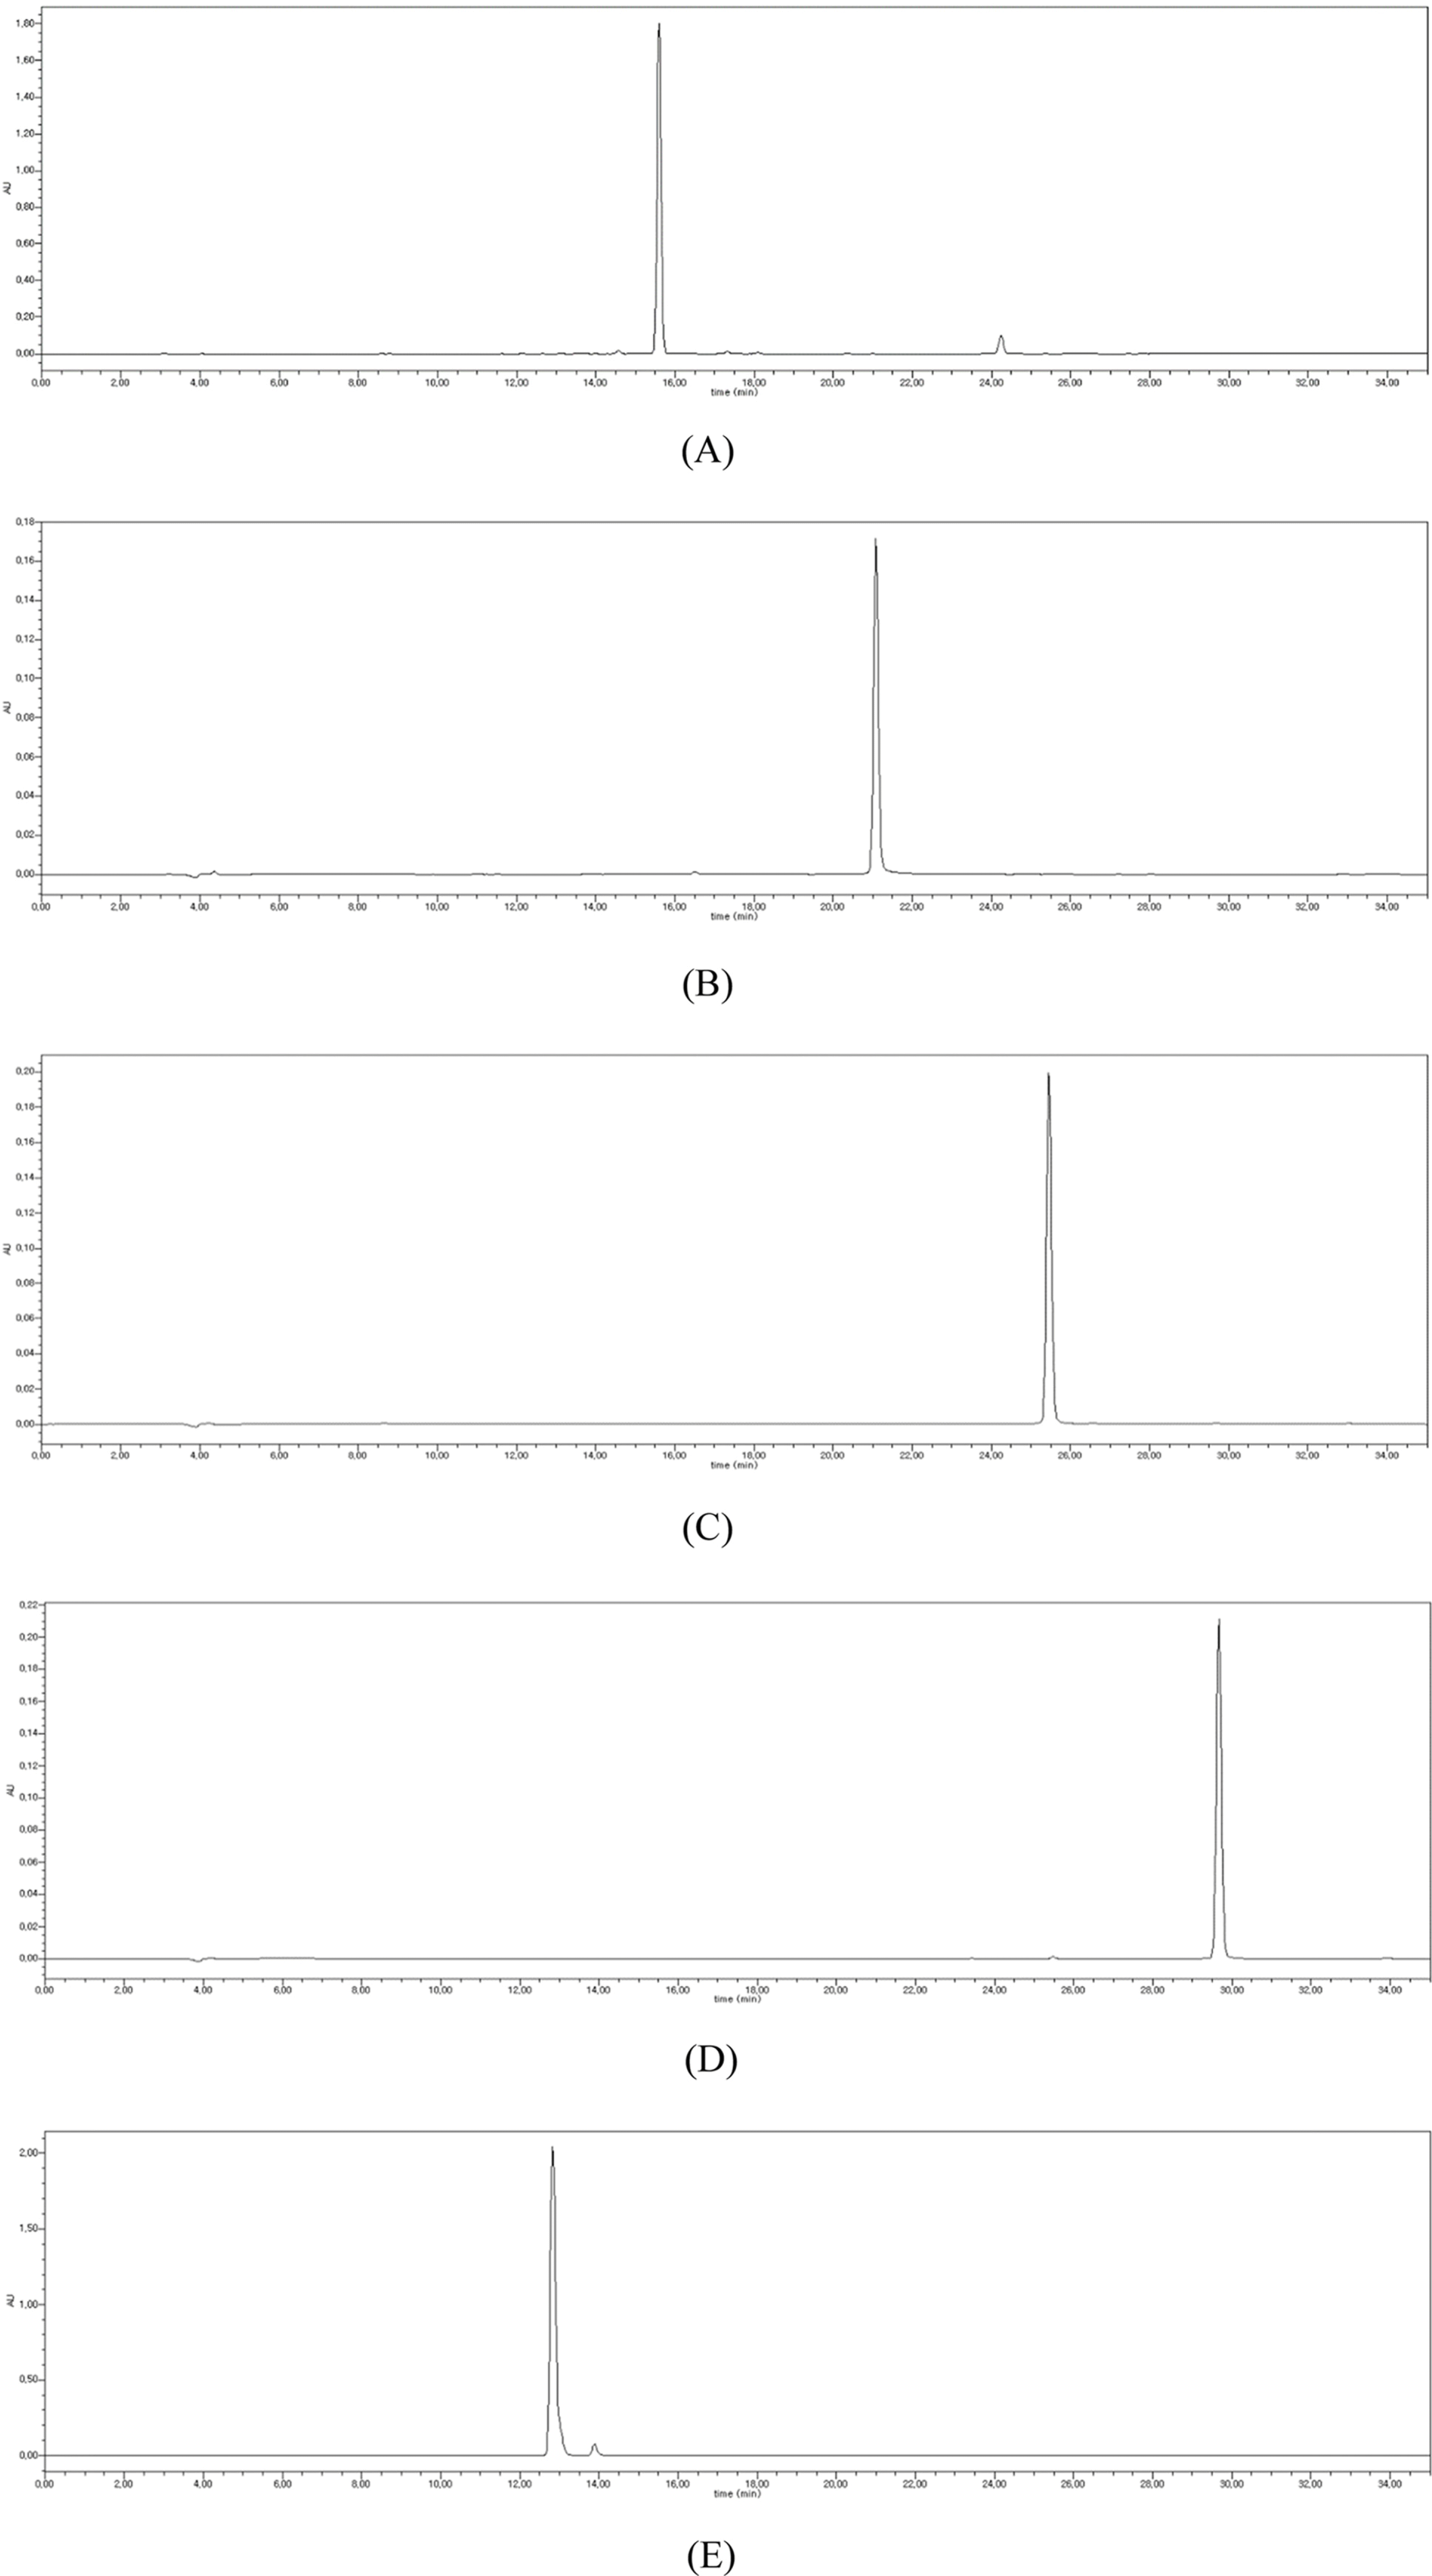
 | Fig. 2.HPLC chromatograms of isoquercitrin (A), myricetin (B), quercetin (C), kaempferol (D), and caffeic acid (E). |
 | Fig. 3.HPLC chromatograms of samples extracted under different conditions: distilled water (A), 8 hr extraction (B), 3-time extraction (C), and 450 ml solvent extraction (D) showing caffeic acid (dotted arrow) and isoquercitrin peaks (line arrow) |
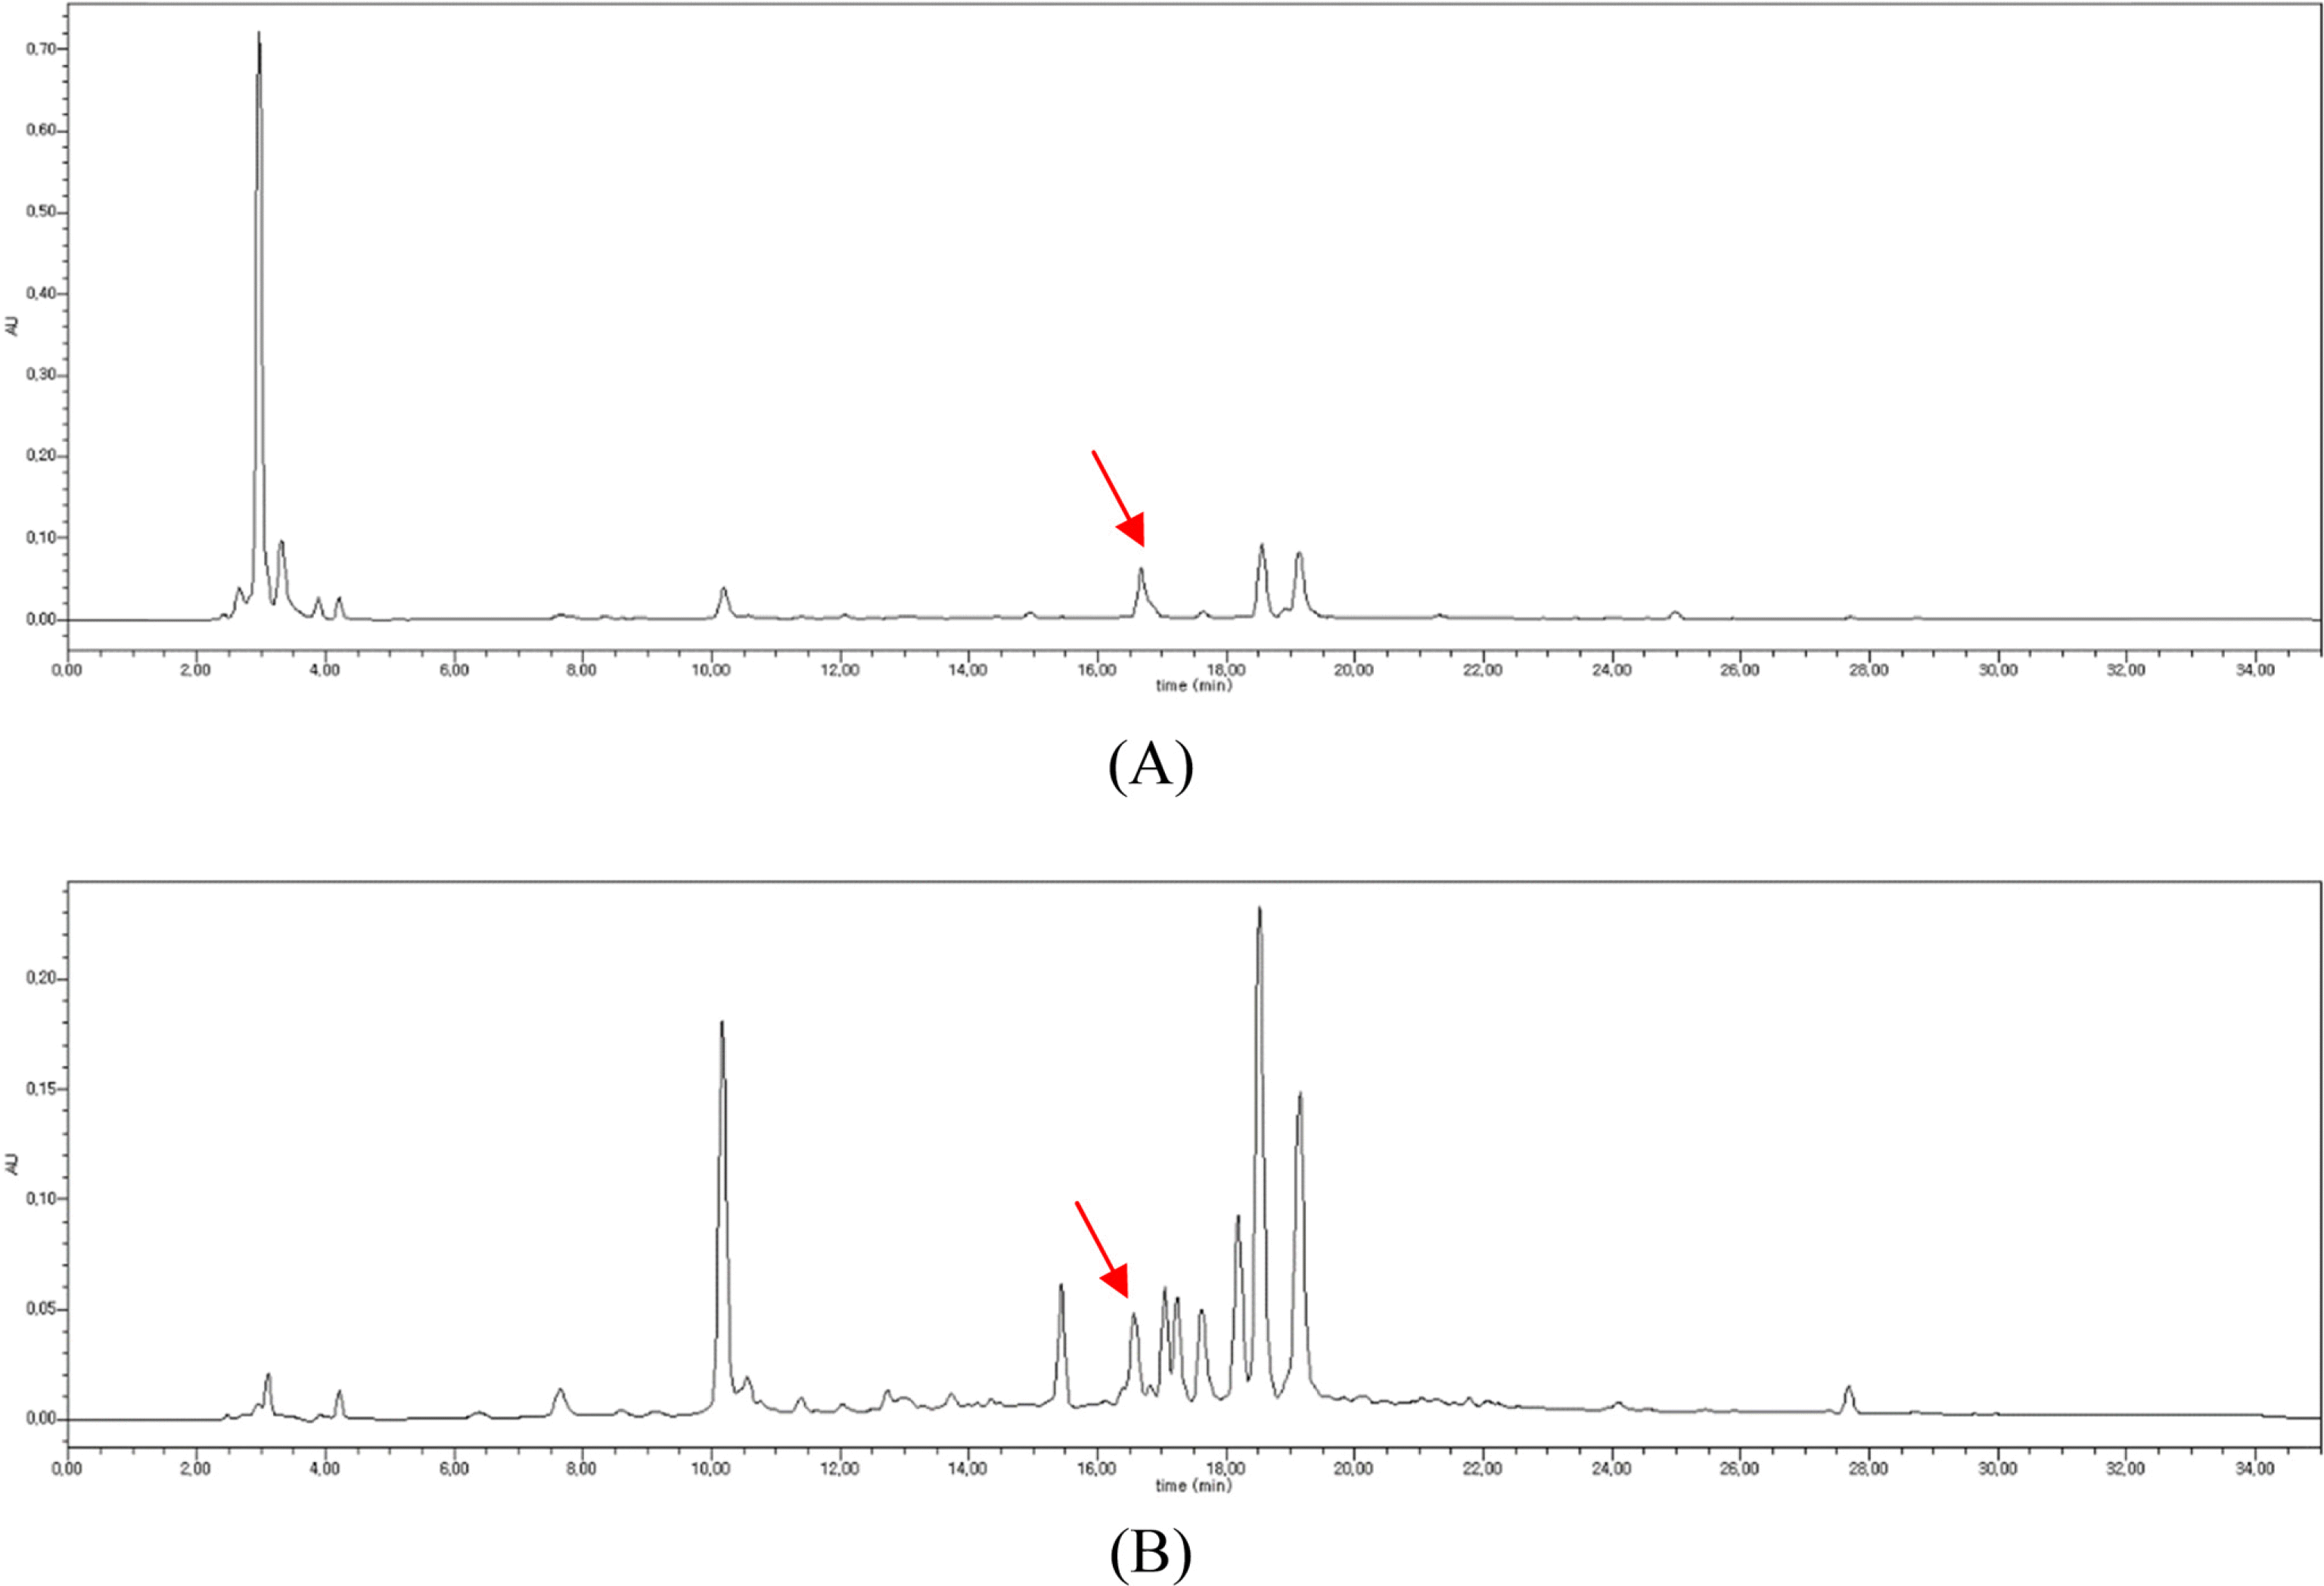
 | Fig. 4.HPLC chromatograms of the MeOH extracts of A. fastigiatus (A) and A. ageratoides (B) showing isoquercitrin peak (line arrow). |
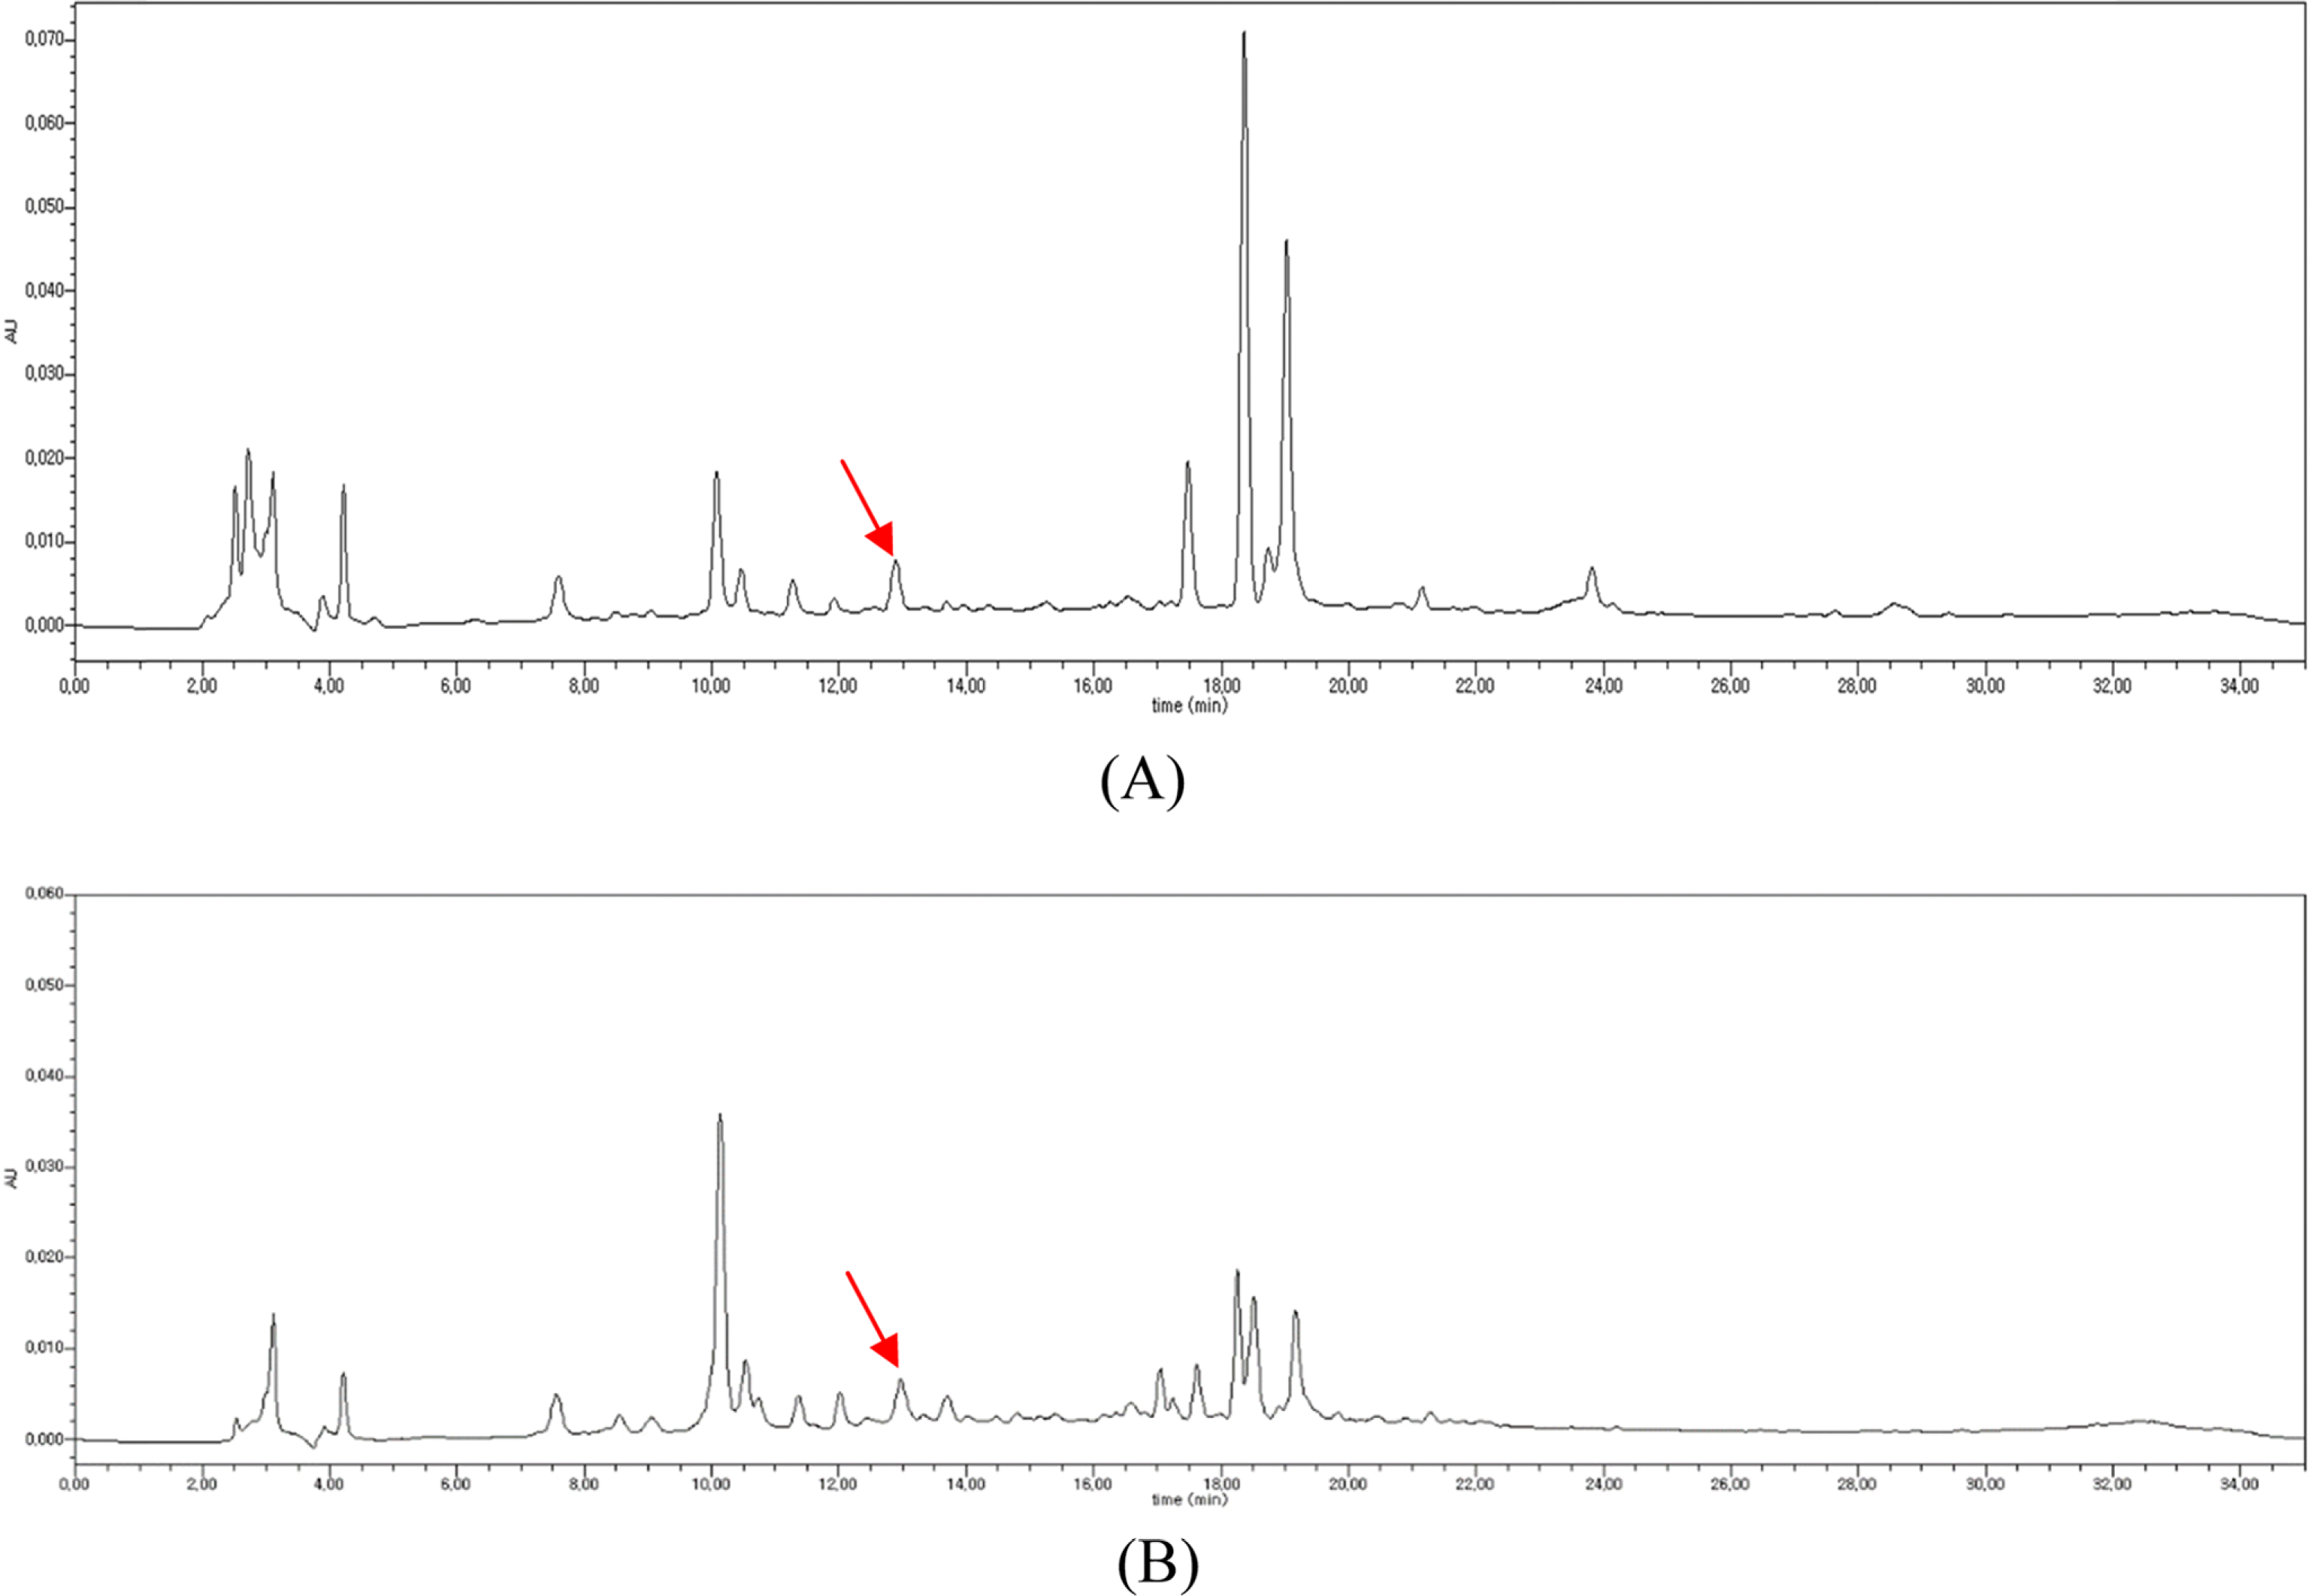
 | Fig. 5.HPLC chromatograms of the MeOH extracts of A. scaber (A) and A. glehni (B) showing caffeic acid peak (line arrow). |
Table 1.
Calibration curves of isoquercitrin and caffeic acid
| Compound | tR | Calibration equation a | Correlation factor, r2 b |
|---|---|---|---|
| Isoquercitrin | 15.71 | Y = 1000000X + 16247 | 0.9982 |
| Caffeic acid | 12.83 | Y = 2000000X – 5935.4 | 0.9998 |
Table 2.
Extract yield fro conditions
Table 3.
Isoquercitrin and caffeic acid yield from A. scaber leaves following different extraction conditions
Table 4.
Isoquercitrin and caffeic acid content of the MeOH extracts of selected Aster species
| Species | Contents (mg/g extract) | |
|---|---|---|
| Isoquercitrin | Caffeic acid | |
| A. ageratoides | 5.69 ± 0.24 | 0.41 ± 0.01 |
| A. altaicus var. uchiyamae | ND | 0.20 ± 0.03 |
| A. ciliosus | 0.63 ± 0.26 | 0.54 ± 0.00 |
| A. fastigiatus | 6.39 ± 0.40 | 0.32 ± 0.02 |
| A. glehni | ND | 0.56 ± 0.03 |
| A. hayatae | 0.06 ± 0.01 | 0.31 ± 0.01 |
| A. incisa | 0.04 ± 0.03 | 0.37 ± 0.02 |
| A. koraiensis | 0.42 ± 0.01 | 0.23 ± 0.02 |
| A. maackii | 1.05 ± 0.11 | 0.25 ± 0.21 |
| A. pekinensis | 1.11 ± 0.08 | tr |
| A. pilosus | 0.68 ± 0.02 | 0.44 ± 0.01 |
| A. scaber∗ | 2.79 ± 0.06 | 0.64 ± 0.02 |
| A. spathulifolius | 0.14 ± 0.03 | 0.26 ± 0.00 |
| A. spathulifolius var. oharae | 0.01 ± 0.10 | 0.26 ± 0.01 |
| A. tataricus | 1.05 ± 0.09 | 0.27 ± 0.00 |
| A. tripolium | ND | 0.19 ± 0.00 |
| A. yomena | 0.02 ± 0.04 | 0.29 ± 0.02 |


 PDF
PDF ePub
ePub Citation
 Print
Print


 XML Download