

 PDF
PDF ePub
ePub Citation
 Print
Print


Introduction
Endophytes are the microorganisms that reside in the inner tissues of living plants during all or part of the microbial life cycle. In 1993, Strobel and coworkers reported that an endophytic fungus isolated from Taxus brevifolia can produce the taxol,1 which was a milestone event in natural product discovery history. After that initial report, the plant endophytes have attracted considerable attention of natural products chemists in the search for new natural products with novel structures and bioactivities. Examples for new bioactive natural products obtained from fungal endophytes include cytoskyrins A and B,2 antimalarial codinaeopsin,3 anticancer rvirgatolides A–C,4 tyrosine phosphatase B inhibitor asperterpenoid A,5 acetylcholine esterase inhibitor asperterpenols A and B,6 anti-TMV aspergillines A–E,7 and the antifungal compound varioxepine A.8
In the past two decades, the large number of natural products obtained from plant-associated endophytes showed an enormous increase. Nevertheless, more and more compounds with known structures are re-isolated reflecting the bottle neck of standard pure fermentation procedures that fail to activate all biogenetic gene clusters that are present in a given fungus.9 In the host plants, the endophytes are always part of complex microbial communities that influence each other metabolically leading to an enhanced production of bioactive natural products. These triggers are lacking in axenic cultures. In order to gain access to a wider variety of compounds, a new microbial culture method, called “black-box” co-culture, is proposed for the rapid discovery of new compounds exhibiting antimicrobial activity from plant-associated endophytes. This new method followed the “Acquired Immune Systems Theory”.10 It took advantage of the fact that all culturable endophytic microorganisms when cultured in the same culture vessel could influence each other and maximize the chemical productivity by inducing biogenetic gene clusters that remained silent when cultured axenically. For mimicking the situation in the host plant, the biomass of host plant is added to the fermentation. This dynamic cocultivation in a plant-like environment is expected to yield new bioactive compounds.
During our ongoing search for new bioactive compounds from endophytes from rare and endangered plants from the Shennongjia District (People's Republic of China), some metabolites such as tremulanes and 5, 6-secotremulane,11 penicitroamide,12 new glycosides13 and fusaodavinvin14 had been reported earlier by us. In this paper, the structural elucidation and antimicrobial activity of two new polyketides produced by endophytes from the Chinese plant Distylium chinense following our “black-box” approach are reported.
Experimental
General experimental procedures
Ultraviolet visible (UV) spectra were obtained on a SCINCO Spectrometer, 1D and 2D Nuclear Magnetic Resonance (NMR) spectra were recorded on a Bruker Ultrashield 400 MHz NMR spectrometer (Switzerland). Mass spectra (MS) were obtained on Thermo Fisher EI spectrometer and ESI HR MS data, and the X-Ray crystal data were obtained on the Bruker SMART APEX-II diffractometer. Silica gel GF254 (10 – 40 µm) prepared for thin layer chromatograph (TLC) and silica gel (200 – 300 mesh) for column chromatography (CC) were obtained from Qingdao Marine Chemical Factory (Qingdao, People's Republic of China). Fractions were monitored by TLC, and the spots were visualized under ultraviolet lamp at 254 nm and by immersing the TLC plates into an iodine cylinder. Semi-preparative HPLC was performed on a Dionex Ultra-3000 (USA) and Waters 1125 HPLC with a Cosmosil C-18 column (10 µm × 20 mm v 250 mm and 5 µm × 4.6 mm × 250 mm). And the circular dichroism (CD) spetra data were obtained from the qCD spectrometer from the Applied Photophysis Ltd.
“Black-box” co-culture method
Leaves, bark and roots of Distylium chinense were rinsed with tap water. Next, they were immersed in a 5% – 10% NaClO solution for 5 – 8 min, and in 75% alcohol/water solution for 3 min successively. Then, the surface sterilized tissues were transferred into sterile water, and washed twice with this sterile water. Finally, the sterile water on the surface of plant tissues was absorbed by sterile filter papers, and the plant tissues were cut into approximate 0.5 cm × 0.5 cm pieces and transferred to autoclaved rice as a solid culture medium. The endophytes were fermented for 40 days at room temperature. The base solid medium was composed of 140 g rice, 70 g bran and 200mL tap water in a 3000mL flask. The samples of Distylium chinense were collected at the bank of Gulongxi river in Huanghua Town (N30.9°/E 111.4°). The plant was identified by Prof. Yang Jin. In total, ten 3000 mL-flasks with the base solid medium were used to culture the endophytes from the leaves of Distylium chinense.
Extraction and isolation of compounds
The solid rice medium with the growing endophytes was crashed, and extracted with 20 L ethyl acetate for three times at room temperature for two weeks. Then, the extract was concentrated under vacuum to yield 10 g of crude extract. The crude extract was subjected to silica gel column chromatography and eluted from light petroleum ether to acetyl ester, then to methanol. The subfractions were merged into six fractions according to TLC results. The fraction E (1.2 g) was further subjected to C-18 reverse phase silica gel column chromatography with the gradient elution from 20% methanol-H2O to 80% methanol-H2O, and the fraction B was fractionated into five subfractions. The subfraction B-4 was further purified by semi-preparative reverse-phase HPLC with gradient elution from 35% – 55% acetronitrile-H2O to afford compound 1 (tR 16.5 min, 2.0 mg), 2 (tR 18.8 min, 1.2 mg). The subfraction B-5 was purified by repeated silica gel column chromatography, and recrystallized to yield the compound 3 (30 mg).
CD computational methods
Systematic conformational search of compound 1 and 2 was carried out by the Vega ZZ program with MMFF94 force field. All conformers were further optimized by the B3LYP/6-311G (d,p). The same level harmonic vibrational frequencies were calculated to confirm their stability and to estimate their relative Gibbs free energies at 298.15 K. The ECD spectra of compound 1 and 2 were calculated using the TDDFT method at the PCM/PBE0/6-311++G (d,p) level. The number of singlet excited states per conformer was 40. Solvent effects were considered by the Integral Equation Formalism Polarizable Continuum Model (IEFPCM) in methanol. Finally, the ECDs and the optical rotation of the conformers were Boltzmann weighted according to the calculated Gibbs free energies. The calculated ECD curves were generated using SpecDis1.64 with σ = 0.26 ev and UV shift 10 nm. All DFT calculations were performed using the Gaussian09 program.15
X-ray structure determinations
X-ray data for 3 were measured with CuKα radiation (λ = 1.54178 Å, rotating anode) on a Bruker SMART APEX-II diffractometer with a nitrogen gas-stream cooling device at a temperature of 100 K; The structure was solved by Direct Methods and refined by full-matrix least-squares procedures with anisotropic thermal parameters for all the non-hydrogen atoms using SHELXL-97.16 Hydrogen atoms were included and located from difference Fourier map but not refined anistropically. CCDC deposition number for 3 is CCDC 1550878, which contains the supplementary crystallographic data for this paper, and these data can be obtained free of charge from The Cambridge Crystallographic Data Centre via www.ccdc.cam.ac.uk/data_request/cif.
Chinoketide A (1)
colorless oil.  : −35 (c 0.1, CH3OH); UV(CH3OH): λmax (log ε) 245.3 (5.4) nm; Infra-Red (IR) (film): νmax 3215, 2930, 1680, 1450, 1358 cm−1; 1H and 13C NMR data (see Table 1); HRESIMS m/ e 213.1124 [M+H]+ (Calcd. for C11H17O4, 213.1127).
: −35 (c 0.1, CH3OH); UV(CH3OH): λmax (log ε) 245.3 (5.4) nm; Infra-Red (IR) (film): νmax 3215, 2930, 1680, 1450, 1358 cm−1; 1H and 13C NMR data (see Table 1); HRESIMS m/ e 213.1124 [M+H]+ (Calcd. for C11H17O4, 213.1127).Chinoketide B (2)
colorless oil, = +32 (c 0.1, CH3OH); UV (CH3OH) λmax (log ε) 218.5 (5.4), 231.3 (3.8), 282.7 (5.7) nm; IR (film): νmax 3218, 1682, 1658, 1430 cm−1; 1H and 13C NMR data (see Table 1). HREIMS m/e 196.0374 [M]+ (calcd. for C9H8O5, 196.0372).
= +32 (c 0.1, CH3OH); UV (CH3OH) λmax (log ε) 218.5 (5.4), 231.3 (3.8), 282.7 (5.7) nm; IR (film): νmax 3218, 1682, 1658, 1430 cm−1; 1H and 13C NMR data (see Table 1). HREIMS m/e 196.0374 [M]+ (calcd. for C9H8O5, 196.0372).Xylarphthalide A (3)
Colorless crystals. : +65 (c 0.1, CH3OH); m.p. 218 – 219℃. UV (CH3OH): λmax (log ε) 224.6 (5.6), 251.2 (4.4), 302.2 (1.2) nm; IR (film): νmax 3363, 3205, 2925, 1667, 1650, 1609, 1495, 1340 cm−1; 1H NMR (400 MHz in CD3OD-d4): δ 8.15 (d, 8.4, 1H), 6.94 (d, 8.4, 1H), 5.76 (s, 1H), 4.60 (dd, 6.2, 12.7, 1H), 1.45 (d, 6.5,3H); 13C NMR (100 MHz in CD3OD-d4): δ 20.9 (CH3), 67.2 (CH), 86.7 (CH), 114.7 (C), 117.1 (CH), 118.4 (C), 139.6 (CH), 154.0 (C), 161.8 (C), 167.5 (C), 171.5 (C); HRESIMS: m/e 237.0402 [M−H]− (Calcd. for C11H9O6, 237.0399).
: +65 (c 0.1, CH3OH); m.p. 218 – 219℃. UV (CH3OH): λmax (log ε) 224.6 (5.6), 251.2 (4.4), 302.2 (1.2) nm; IR (film): νmax 3363, 3205, 2925, 1667, 1650, 1609, 1495, 1340 cm−1; 1H NMR (400 MHz in CD3OD-d4): δ 8.15 (d, 8.4, 1H), 6.94 (d, 8.4, 1H), 5.76 (s, 1H), 4.60 (dd, 6.2, 12.7, 1H), 1.45 (d, 6.5,3H); 13C NMR (100 MHz in CD3OD-d4): δ 20.9 (CH3), 67.2 (CH), 86.7 (CH), 114.7 (C), 117.1 (CH), 118.4 (C), 139.6 (CH), 154.0 (C), 161.8 (C), 167.5 (C), 171.5 (C); HRESIMS: m/e 237.0402 [M−H]− (Calcd. for C11H9O6, 237.0399).Antimicrobial activity
antimicrobial assay against plant-pathogenic E. carotovora sub sp. carotovora (Jones) Bersey et al. was carried out using the paper disc method, amphotericin B was used as positive control for antimicrobial assay.17
Result and Discussion
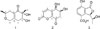
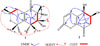
Chinoketide A (1) was obtained as colorless oil, = −35 (c 0.1, CH3OH). Its UV spectrum displayed maximum absorption peaks at 245.3 nm. Its molecular formula was determined as C11H16O4 by the pseudomolecular ion peak at [M+H]+ m/e 213.1124 (calcd. 213.1127) in the HRESIMS spectrum. The 1H and 13C NMR spectra of 1 showed seven groups of proton signals and eleven carbon resonance signals. In the 13C and DEPT NMR spectra, there were four quaternary carbon signals at δ 199.4, 151.9, 127.4 and 76.4, two methine groups at δ 71.4 and 68.8, three methylene groups at δ 63.1, 36.9 and 36.7, and two methyl groups at δ 21.0 and 18.1. In the 1H -1H COSY spectrum, the cross peak between δ 3.73 (m, 1H) (H-3) and 2.52 (m, 1H)/2.18 (m, 1H) (H-4) proved that H-3 was adjacent to H-4, and the proton signal at δ 3.52 (m, 1H) correlated to two proton signals at 1.16 (d, 6.1, 3H) (H-9) and 2.09 (m, 2H) (H-7), suggesting the existence of substructure of −CH2-CH(OR)-CH3. Following comprehensive analysis of the HSQC and HMBC spectra of compound 1, the planar structure of compound 1 was built up (shown in Fig. 1). In the HMBC spectrum of compound 1, H-10 correlated with C-1, C-2 and C-3, whereas H-3 correlated with C-1, C-2, C-4, C-5 and C-10, on the other hand, H-4 correlated with C-2, C-3, C-5 and C-6 indicating the presence of a six-membered ring with an α,β-unsaturated ketone core in chinoketide A. The cross peaks between H-11 and C-4, C-5, C-6 and between H-4 and C-5, C-6 suggested that C-11 was attached to an α,β-unsaturated ketone core at C-5. And H-7 correlated with C-1, C-5 and C-6, H-8 correlated with C-6 proving that C-7 was connected to C-6 of the six-membered ring. Then, the correlations from H-7 to C-8, C-9, from H-8 to C-7, C-9, from H-9 to C-8, C-9 verified the relative positions of C-7, C-8 and C-9. Finally, the correlations from H-8 to C-11 and from H-11 to C-8 proved that C-8 and C-11 were linked together to form a second six-membered ring in compound 1 via an ether bond. Thus, the structure of chinoketide A was established as shown in Fig. 1.
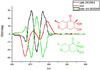
= −35 (c 0.1, CH3OH). Its UV spectrum displayed maximum absorption peaks at 245.3 nm. Its molecular formula was determined as C11H16O4 by the pseudomolecular ion peak at [M+H]+ m/e 213.1124 (calcd. 213.1127) in the HRESIMS spectrum. The 1H and 13C NMR spectra of 1 showed seven groups of proton signals and eleven carbon resonance signals. In the 13C and DEPT NMR spectra, there were four quaternary carbon signals at δ 199.4, 151.9, 127.4 and 76.4, two methine groups at δ 71.4 and 68.8, three methylene groups at δ 63.1, 36.9 and 36.7, and two methyl groups at δ 21.0 and 18.1. In the 1H -1H COSY spectrum, the cross peak between δ 3.73 (m, 1H) (H-3) and 2.52 (m, 1H)/2.18 (m, 1H) (H-4) proved that H-3 was adjacent to H-4, and the proton signal at δ 3.52 (m, 1H) correlated to two proton signals at 1.16 (d, 6.1, 3H) (H-9) and 2.09 (m, 2H) (H-7), suggesting the existence of substructure of −CH2-CH(OR)-CH3. Following comprehensive analysis of the HSQC and HMBC spectra of compound 1, the planar structure of compound 1 was built up (shown in Fig. 1). In the HMBC spectrum of compound 1, H-10 correlated with C-1, C-2 and C-3, whereas H-3 correlated with C-1, C-2, C-4, C-5 and C-10, on the other hand, H-4 correlated with C-2, C-3, C-5 and C-6 indicating the presence of a six-membered ring with an α,β-unsaturated ketone core in chinoketide A. The cross peaks between H-11 and C-4, C-5, C-6 and between H-4 and C-5, C-6 suggested that C-11 was attached to an α,β-unsaturated ketone core at C-5. And H-7 correlated with C-1, C-5 and C-6, H-8 correlated with C-6 proving that C-7 was connected to C-6 of the six-membered ring. Then, the correlations from H-7 to C-8, C-9, from H-8 to C-7, C-9, from H-9 to C-8, C-9 verified the relative positions of C-7, C-8 and C-9. Finally, the correlations from H-8 to C-11 and from H-11 to C-8 proved that C-8 and C-11 were linked together to form a second six-membered ring in compound 1 via an ether bond. Thus, the structure of chinoketide A was established as shown in Fig. 1.In chinoketide A (1), there are three chiral centers at C-2, C-3 and C-8, and C-2 and C-3 bear a diol function group. The relative configurations at the chiral carbons were elucidated by a thorough analysis of the NOESY spectrum of compound 1. The correlation from H-3 to H-10 suggested that the methyl group of H-10 and H-3 were oriented at the same side, and the two hydroxyl groups were oriented to the opposite side. The third chiral carbon C-8 was far away from C-2 and C-3. Hence, it was difficult to assign the relative configuration of C-8. However, a detailed analysis of the NOESY spectrum of compound 1, the correlations from H-9 to H-11a, then from H-11a to H-4b, and the cross peaks between H-8 and H-11b, and cross peaks between H-11b and H-4a, proved that H-8 was oriented to the same side as the two adjacent hydroxyl groups linking at C-2 and C-3. On the other hand, H-9 was oriented to the same side as H-10 and H-3, which was opposite to the two adjacent hydroxyl groups linking at C-2 and C-3. Finally, the relative configuration was established as shown in Fig. 1. Due to the presence of an α,β-unsaturated ketone chromophore in chinoketide A, the ECD of compound 1 was calculated to determine the absolute configurations of C-2,C-3 and C-8 using the TDDFT method. Comparing the theoretically calculated CD spectrum with the experimentally recorded CD spectrum (see Fig. 3), showed a significant similarity. Hence, the absolute configurations of C-2, C-3 and C-8 were determined as 2R, 3R and 8S. Thus, the structure of compound 1 was established as shown in Fig. 1. The new natural product of compound 1 was named as chinoketide A.
Chinoketide B (2) was obtained as obtained as a colorless oil, = +32 (c 0.1, CH3OH). Its UV spectrum displayed maximum absorption peaks at 218.5, 231.3, 282.7 nm. Its molecular formula was determined as C9H8O5 by the molecular ion peak at [M]+ m/e 196.0374 [M]+ (calcd. for C9H8O5, 196.0372) in the HR-EI-MS spectrum. The 1H and 13C NMR spectra were very simple, there were only five groups of proton signals in 1H NMR spectrum, and only nine carbon signals in 13C NMR spectrum. There were three quaternary carbon signals at δ 199.8, 164.6, 147.8 and 108.1, four methine groups at δ 108.2, 101.1, 71.6 and 69.8, one methylene group at δ 43.1 (see Table 1).
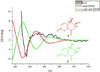
= +32 (c 0.1, CH3OH). Its UV spectrum displayed maximum absorption peaks at 218.5, 231.3, 282.7 nm. Its molecular formula was determined as C9H8O5 by the molecular ion peak at [M]+ m/e 196.0374 [M]+ (calcd. for C9H8O5, 196.0372) in the HR-EI-MS spectrum. The 1H and 13C NMR spectra were very simple, there were only five groups of proton signals in 1H NMR spectrum, and only nine carbon signals in 13C NMR spectrum. There were three quaternary carbon signals at δ 199.8, 164.6, 147.8 and 108.1, four methine groups at δ 108.2, 101.1, 71.6 and 69.8, one methylene group at δ 43.1 (see Table 1).Following inspection of the HSQC, HMBC and NOESY spectra, the structure of compound 2 was established as shown in Fig. 1. Similarly to compound 1, there was a diol group at C-5 and C-6. The only cross peak between H-5 and H-6 could be observed in the NOESY spectrum, which cannot appear that H-5 and H-6 lied at the same side only by NOESY spectrum. To determine the absolute configurations of C-5 and C-6, the calculation of four enantiomers' ECD spectra of compound 2 was carried out using the TDDFT method and comparing the calculated ECD with the experimentally recorded ECD spectrum. Only the 5R, 6S enantiomer's ECD spectrum showed significant similarity with the experimental CD spectrum of compound 2 (see Fig. 4). Thus the structure of compound 2 was established as shown in Fig. 1. and compound 2 was given the name chinoketide B.
The known compound 3 was determined its structure by comparing with their NMR data and X-ray diffraction to the reference compound xylarphthalide A,18 and we found that they were the same in NMR data and X-ray diffraction, Thus the compound 3 was identified as xylarphthalide A.
The antimicrobial activities of the isolated compounds were investigated using Erwinia carotovora sub sp. carotovora (Jones) Bersey et al as model organisms and employing the filter paper disc method with MIC value at 20.5, 30.4 and 10.2 µg/mL, amphotericin B was used as positive control with MIC value at 0.5 µg/mL.
 XML Download