

 PDF
PDF ePub
ePub Citation
 Print
Print


Introduction
Melicope glabra (Blume) T.G. Hartley locally known as ‘Ki Sampang’ belongs to the Rutaceae family found in all of Indonesia Island. The aqueous decoction of leaves of M. glabra are used in Indonesia as traditional medicine for the treatment of fever, infections, and cough.1 The Melicope genus has been shown to be prolific a number of secondary metabolites, particularly alkaloids,23 flavonoids,45 coumarins67 and showed biological activities such as anticancer, antifungal and antioxidant.
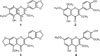
The phytochemical survey from the bark of M. glabra were isolated coumarins and lignan but the leaves until now has not been reported.6 In this paper, we wish to report the isolation and structural elucidation of a new flavonol, meliglabrin (1) along with three known compounds, ternatin (2), meliternatin (3), and 5,4′-dihydroxy-3,7,3′-trimethoxyflavon (4) from the leaves of M. glabra. The cytotoxic activity of compounds 1 – 4 against murine leukemia P-388 cells from this plant are also reported.
Experimental
General experimental procedures
UV spectra were measured with a Shimadzu 1800 spectrometer, FTIR spectrum One Perkin-Elmer instrument, respectively. 1H and 13C NMR spectra were recorded with a JEOL ECA 400 spectrometer operating at 400 (1H) and 100 (13C) MHz in CDCl3. Mass spectra were measured on an ESI-TOF Waters LCT Premier XE producing pseudo-molecular ions, [M-H]− negative ion mode. Vacuum liquid chromatography (VLC) and planar radial chromatography were carried out using Si gel 60 GF254 and Si gel 60 PF254, for TLC analysis, pre-coated silica gel plates (Merck Kieselgel 60 GF254, 0.25 mm thickness) were used.
Plant materials
The leaves of M. glabra were collected in March 2017 from Gunung Salak, Bogor, West Java, Indonesia. The plant material was identified by Mr. Ismail Rachman from the Herbarium Bogoriense, Bogor. A voucher specimen (PL 60325) was deposited in Herbarium Bogoriense, Center of Biological Research and Development, National Institute of Science, Bogor, Indonesia.
Extraction and isolation
The powdered and dried leaves of M. glabra (1.7 kg) were macerated in methanol at room temperature two times and, after evaporation of the methanol extract, gave a dark residue (210 g). The extract was redissolved in MeOH-water (9:1) and partitioned with n-hexane (95 g) and ethyl acetate (30 g) fractions. The ethylacetate extract (29 g) was further fractionated by vacuum liquid chromatography on silica gel (150 g) eluted with n-hexane-ethyl acetate of increasing polarity (9:1, 4:1; 7:3, 1:1, and 1:4) to give three major fractions A-C. Fraction A (4.68 g) was separated by column chromatography eluted with n-hexane-ethyl acetate (9:1 to 7:3) to produce subfractions A1–A3. Subfraction A1 was purified by planar radial chromatography using n-hexane-CHCl3 (from 4:1 to 1:4) to yield compound 1 (20 mg), 3 (15 mg), and 4 (23 mg). Fraction B (13 g) was refractionated using column chromatography and eluted n-hexane- ethyl acetate (from 8:2 to 3:7) to produce subfractions B1–B2. Subfraction B1 was purified by planar radial chromatography using n-hexane-acetone (from 9:1 to 1:1) to yield compound 2 (9 mg).
Meliglabrin (1)
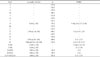
Yellow solid, mp. 119 – 121 ℃, UV (MeOH) λmax nm (log ε) : 245 (4.20), 255 (3.99), 296 (4.01) and 344 (4.20). IR (KBr) νmax cm−1: 3421, 1645, 1560, 1481 and 1132. 1H and 13C NMR see Table 1. HRESIMS: m/z [M-H]− calcd. for C18H13O8 357.0610, found 357.0613.
Ternatin (2)
Yellow solid. 1H NMR (CDCl3 400 MHz): δH 12.44 (1H, s, 5-OH), 7.79 (1H, dd, J = 9.1, 2.0 Hz, H-6′), 7.78 (1H, d, J = 2.0 Hz, H-2′), 7.06 (1H, d, J = 9.1 Hz, H-5′), 6.42 (1H, s, H-6), 6.01 (1H, s, 4′-OH), 3.98 (3H, s, 3′-OCH3), 3.94 (3H, s, 7-OCH3), 3.92 (3H, s, 8-OCH3), 3.87 (3H, s, 3-OCH3). 13C NMR (CDCl3 100 MHz): δC 179.1 (C-4), 158.4 (C-7), 157.4 (C-5), 155.8 (C-2), 148.5 (C-8a/4′), 146.4 (C-3′), 139.4 (C-3), 122.9 (C-6′), 128.8 (C-8), 122.7 (C-1′), 114.8 (C-5′), 110.8 (C-2′), 105.4 (C-4a), 95.5 (C-6), 61.7 (8-OCH3), 60.2 (3-OCH3), 56.5 (7-OCH3), 56.1 (3′-OCH3). HRESIMS: m/z [M-H]− calcd. for C19H17O8 373.1916, found 373.1912. The 1H and 13C NMR spectral data are consistent with published data.8
Meliternatin (3)
Pale white solid, mp. 167 – 169 ℃. UV (MeOH) λmax nm (log ε) : 247 (4.22), 270 (4.08) and 336 (4.34). IR (KBr) νmax cm−1: 1641, 1524, 1479 and 1114. 1H NMR (CDCl3 400 MHz): δH 7.63 (1H, dd, J = 8.4, 1.8 Hz, H-6′), 7.56 (1H, d, J = 1.8 Hz, H-2′), 6.91 (1H, d, J = 8.4 Hz, H-5′), 6.65 (1H, s, H-8), 6.05 (2H, s, 3′,4′-OCH2-O), 6.04 (2H, s, 6,7-OCH2-O), 4.12 (3H, s, 5-OCH3), 3.86 (3H, s, 3-OCH3). 13C NMR (CDCl3 100 MHz): δC 174.0 (C-4), 153.7 (C-7), 153.7 (C-8a), 153.0 (C-4′), 152.6 (C-2), 149.4 (C-3′), 141.1 (C-5), 140.8 (C-3), 134.8 (C-6), 124.5 (C-1′), 123.1 (C-6′), 113.1 (C-4a), 108.5 (C-5′; 3′,4′-OCH2-O), 108.4 (C-2′; 6,7-OCH2-O), 93.0 (C-8), 61.3 (5-OCH3), 59.9 (3-OCH3). ). HRESIMS: m/z [M-H]− calcd. for C18H13O8 357.0610, found 357.0613. The 1H and 13C NMR spectral data are consistent with published data.9
5,4′-Dihydroxy-3,7,3′-trimethoxyflavon (4)
Yellow solid, 1H NMR (acetone-d6, 400 MHz): δH 12.72 (1H, s, 5-OH), 8.64 (1H, s, 4′-OH), 7.75 (1H, d, J = 2.0 Hz, H-2′), 7.67 (1H, dd, J = 8.4, 2.0 Hz, H-6′), 6.97 (1H, d, J = 8.4 Hz, H-5′), 6.62 (1H, d, J = 2.4 Hz, H-8), 6.27 (1H, d, J = 2.4 Hz, H-6), 3.91 (3H, s, 3′-OCH3), 3.87 (3H, s, 7-OCH3), 3.86 (3H, s, 3-OCH3). 13C NMR (acetone-d6, 100 MHz): δC 179.5 (C-4), 166.5 (C-7), 162.7 (C-5), 157.6 (C-8a), 156.8 (C-2), 150.5 (C-4′), 148.2 (C-3′), 139.3 (C-3), 123.3 (C-6′), 122.6 (C-1′), 116.1 (C-5′), 112.5 (C-2′), 106.4 (C-4a), 98.4 (C-6), 92.8 (C-8), 61.3 (3′-OCH3), 56.4 (7-OCH3), 56.5 (3-OCH3). HRESIMS: m/z [M-H]− calcd. for C18H17O7 344.0896, found 344.0900. The 1H and 13C NMR spectral data are consistent with published data.10
Cytotoxic activity
All isolated compounds (1 – 4) were subjected to cytotoxic evaluation against murine leukemia P-388 cells according to the MTT method with artonin E as the positive control.1112 The P-388 cells were seeded into each 96-well cell culture plate at a density of 3 × 10⁴ cells/well and incubated at 37 ℃ for 48 h. The number of cells that inhibited by each of compounds 1 – 4 were measured using microplate reader spectrometer at λ 540 nm after incubation for 24 hours in CO2 incubator at 37 ℃. All of isolated compounds by variations in concentration of 1000; 100; 30; 10; 3; 1; 0.3 and 0.1 µg/mL with triplicate treatment tested on cell cultures murine leukemia P-388. The IC50 value50 can be calculated through extrapolation 50% absorption lines to various concentrations of each compound using regression analysis.
Result and Discussion
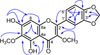
Compound (1) was isolated as yellow solid, mp. 119 – 121 ℃. The HRESIMS displayed a negative molecular ion peak [M-H]− at m/z 357.0613 (calcd. 357.0610) indicating a molecular formula of C18H14O8. The UV maximum absorption at λmax 245 (4.20), 255 (3.99), 296 (4.01) and 344 (4.20) nm typical for a flavonol chromophore.12 The IR spectrum indicated absorptions for hydroxyl (3421 cm−1), conjugated carbonyl (1645 cm−1), aromatic (1560 – 1481 cm−1) and ether (1132 cm−1) groups, respectively13. The 1H NMR (Table 1) spectrum of 1 showed an ABX system at δH 7.68 (1H, dd, J = 8.4; 1.8 Hz, H-6′), 7.59 (1H, d, J = 1.8 Hz, H-2′), 6.95 (1H, d, J = 8.4 Hz, H-5′), and a singlet at δH 6.54 (1H, s, H-8) in the aromatic region. The 1H NMR spectrum of 1 also showed a chelated hydroxyl group at δH 12.88 (1H, s, 5-OH), a hydroxyl signals at δH 6.50 (1H, s, 7-OH), two methoxyls at δH 4.04 (3H, s, 6-OCH3), 3.85 (3H, s, 3-OCH3), and a methylenedioxy at δH 6.08 (2H, s, 3′,4′-OCH2-O). Eighteen carbon signals were observed by 13C NMR spectrum. Two of them signals at δC 138.2 and δC 179.3 are characteristic for C-3 and C-4 of a flavonol structure.12 The placement of hydroxyl, methoxyl and methylenedioxy groups in flavonol structure was established by HMQC and HMBC spectra (Fig. 2). The proton signal of a chelated hydroxyl group (δH 12.33, 5-OH) correlated with three quaternary carbons [δC 151.8 (C-5); 130.1 (C-6); 106.3 (C-4a)]. The proton signal of methoxyl group at δH 4.04 correlated to δC 130.1 (C-6) showing that a methoxyl group was placed at C-6. A hydroxyl proton signal at δH 6.50 (7-OH) correlated with one quaternary carbon signal δC 155.1 (C-7), and one methine carbon signal δC 93.2 (C-8) indicating that a hydroxyl group was placed at C-7. The aromatic proton signal (δH 6.54, H-8) showed long-range correlations with four quaternary carbons [δC 155.1 (C-7), 153.9 (C-8a)], 130.1 (C-6); 106.3 (C-4a)]. In the 1H NMR spectrum, proton signal of an ABX system in the aromatic region at ring B indicated a methylenedioxy group fused at C-3′ and C-4′. Therefore, another methoxyl group was placed at C-3. The proton signal of methoxyl group at δH 3.85 correlated to δC 138.2 showing that a methoxyl group was placed at C-3. The proton signal of a methylenedioxy group (δH 6.08, 3′,4′-OCH2-O-) showed long-range correlations with two quaternary carbons at δC 149.7 (C-3′) and δC 150.0 (C-4′). One of aromatic proton signal of ABX system (δH 7.59, H-2′) showed correlations with two quaternary carbons δC 155.8 (C-2), 150.0 (C-4′), and one methine carbon signal δC 123.8 (C-6′). The aromatic proton signal (δH 6.95, H-5′) showed correlations with two quaternary carbons δC 124.2 (C-1′), and 149.7 (C-3′). Furthermore, the aromatic proton signal (δH 7.68, H-6′) showed correlations with two quaternary carbons δC 155.8 (C-2), 150.0 (C-4′), and one methine carbon signal δC 108.7 (C-2′). From these NMR data analysis, meliglabrin (1) was assigned as 5,7-dihydroxy-3,6-dimethoxy-3′,4′-methylenedioxyflavone. Other HMBC correlations consistent with the structure 1 are shown in Table 1 and Fig. 2.
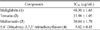
The isolated compounds 1 – 4 were assessed for their anticancer activity against murine leukemia P-388 cells. The result of anticancer activity are presented in Table 2, showing their IC50 were 48.30, 15.98, 30.04, and 5.02 µg/ mL, respectively (artonin E as a positive control, IC50 1.33 µg/mL). These anticancer activity data suggested that the compounds 1 – 3 were inactive and compound 4 showed moderate activity. The hydroxy group at C-4′ and methoxy group at C-3′ (compounds 2 and 4) enhances activity than methylenedioxy group at C-3′ and C-4′ (compounds 1 and 3). The same thing, the structureactivity relationship of flavonol from M. triphylla, the presence of hydroxy group at C-4′ and methoxy group at C-3′ showed moderate activity against murine leukemia P-388 cells.14 The presence of methoxy group at C-8 in compound 2 decreases anticancer activity compared to compound 4.
 XML Download