

 PDF
PDF ePub
ePub Citation
 Print
Print


INTRODUCTION
Children in pediatric intensive cares must be fed, adequately to meet the needs for critical illness but it is not an easy task. Malnourishment is not rare in pediatric intensive care units (PICUs) and is common when children are younger or have chronic diseases, such as congenital heart diseases or chronic lung diseases [1]. Feeding children is a dilemma and we don't know the answer to the question of how much. From a previous study, we know that achieving delivery more than two-thirds of planned nutrition improves survival [2]. One review study revealed that to achieve positive proteins balance, a critically ill child must intake at least 57 kcal/kg/day and 1.5 g protein/kg/day [3]. Also, we know that using feeding protocols improve early and aggressive enteral nutrition as well as reduce intolerance for enteral feeding [4].
Although using theoretical equations of energy requirement for critically ill children are advised, there are skeptical results regarding these equations [5]. A study revealed clinically unacceptable differences between values predicted and values calculated by indirect calorimetry [6]. Theoretical equations are not perfect for guiding nutrition in PICUs. Measurement of energy expenditure by indirect calorimetry is the advised method [7]; however, this method has limitations: i) system is costly and needs repetitive calibration; ii) patients must be intubated with limited leak (10%) and low FiO2 (<0.6); iii) it is a difficult method to perform on every patient in PICUs [8].
A marker not only correlated with nutrition but also not affected by severity of disease or inflammation is beneficial for intensivists to monitor adequacy of nutrition support. Prealbumin and retinol binding proteins (RBP) are regarded as most reflective of acute protein intake [9]. Prealbumin is a plasma protein with shorter half-life than albumin, approximately two days; so, it closely reflects the recent diet rather than overall nutritional status [910] and repeated levels may be used as an aid in nutritional assessment [11]. RBP are group of carrier proteins, single polypeptide chain with molecular weight close to 20,000 that bind retinol [12]. There are no significant differences in RBP and prealbumin levels between underweight patients and those with normal weight [13]. With this study we evaluate proficiency of prealbumin and RBP as nutrition bio-markers relative to daily calorie and protein intake of critically ill children in PICU.
MATERIALS AND METHODS
Design
This is a prospective observational study that includes patients admitted to a tertiary level multidisciplinary PICU. Our study was approved by Akdeniz University Medicine Faculty Non-interventional Studies' Ethical Committee at 03/07/2012 with unanimous approval, with the title “Evaluating Nutrition and Determining the Adequate Amount of Protein and Calories for Anabolic Process in Children in Pediatric Intensive Care Unit” and conclusion number 212. Also Scientific Research Project was granted. Written informed consent was obtained from all parents. We developed a nutrition protocol and used it before the study started (Supplementary Material 1: Algorithm for our feeding protocol). According to nutrition protocol every patient is to be fed enteral after the first morning visit: bolus feeding through nasogastric tube was the primary target but patients with retention more than 50% three times respectively or vomiting, switched to continuous feeding, and nasojejunal tube was used if needed. We used domperidone treatment to reduce retention in some patients. In 72 hours we targeted reaching daily protein intake 1.6 to 3 g/kg and daily calorie intake 60 to 100 kcal/kg. If there is a contradiction that enteral feeding or targets cannot be achieved, parenteral nutrition is started on the first day. For enteral feeding patients younger than one year received formula Infantrini Nutricia (Madrid, Spain; 2.6 g protein/100 mL) and older children received Formula Pediasure (Abbott, Hill County, TX, USA; 2.8 g protein/100 mL). However, we had no conflict of interest with these companies.
Patients
Inclusion criteria were admission to pediatric critical care with an estimated duration >72 hours, age between 1 month and 8 years. We preferred pre-pubertal children. Exclusion criteria were patients with brain death, acute fulminant hepatic failure or hepatic transplantation and ependymoma. We exclude patients with acute hepatic failure, since their prealbumin levels are not reliable [10]. Epandymomas secrete visceral proteins and these patients may have high levels of RBP. Patients with renal impairment can have elevated prealbumin and RBP levels, however in those patients both low levels are associated with protein energy malnutrition and increase in biomarkers are correlated with nutrition [1415]. So patients with renal impairment were not excluded. Patients admitted to our intensive care are grouped in nine groups according to their admission reason [16]. The study ended either when the patient was discharged or at the end of seventh day. None of the patients get intravenous retinol or retinoic acid that could affect RBP levels.
Measurements
Anthropometric measurements of patients including height, weight, middle arm circumstances were taken at administration with calibrated equipment. Daily weight for each patient was measured unless patient was too sick to be moved. Patients less than two years were measured on a scale with 10 g measurement precision. However older patients are carried by staff to be measured and precision is 100 g. Body mass index (BMI) is calculated. Malnourished patients are detected by using the World Health Organization Anthro [17]. Birth weight, Pediatric Risk of Mortality (PRISM3) scoring, chronic diseases, acute reasons for hospitalization, and system dysfunction are recorded for every patient on admission. Also days on ventilator, total intensive care, and total hospital care were recorded to evaluate secondary results.
Nutrition assessment and biomarkers
Daily calorie and protein intake were calculated by an independent dietician according to daily weight. Parenteral and enteral intakes were recorded separately. Prealbumin, RBP and C-reactive protein (CRP) levels were measured first, third, fifth and seventh mornings if blood sample was drawn from patients. We want to control the effect of infection on prealbumin and RBP because we know that their synthetic rate falls due to reprioritization of synthesis toward acute-phase proteins during infection, so we use CRP as a proxy of infection [10].
Prealbumin and RBP levels were detected by the nephelometric method [18]. Calculating daily nitrogen balance had been planned. However, because of difficulty in collecting 24-hour urine urea level, this measurement had been stopped.
Statistics
Descriptive statistics present mean, standard deviation, median, minimum, maximum, frequency and percentage values. Categorical data were compared with Pearson chi-square test. We test for normality (Kolmogrov-Smirnov test) and perform Kruskal-Wallis H-test in analyzing differences between age groups. When a significant difference is detected, Mann Whitney U-test with Bonferroni correction is used for pair-wise comparisons to identify source of the difference. Non-parametric Spearman correlation test is used to assess relationships between numerical variables. Linear regression analysis is used to investigate independent parameters affecting prealbumin and RBP. Statistical analysis was assessed with SPSS statistical package for Windows ver. 22.0 (IBM Co., Armonk, NY, USA). All tests are two-sided with significance level of 0.05.
RESULTS
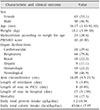
Data were collected between September 2012 and March 2014, at an eight-bed PICU in Akdeniz University Hospital. Four hundred and forty-three patients were admitted to PICU during this period. Eighty-one patients were accepted to study of which 53.1% were female, and 58 patients had at least one chronic disease before admission. Respiratory problems are the most frequent reason for intensive care admission, 79.0% were admitted with respiratory failure. Twenty three (28.4%) were malnourished according to weight for age z-scores and 17 (21.0%) were malnourished according to BMI for age z-scores. Fourteen patients died during intensive care stay hence mortality rate was 17.3%. PRISM3 score (p=0.024), day zero CRP value (p=0.003) and daily CRP (p<0.001) were found related with mortality.
For patients, median PRISM3 score was 10 (range, 0–30). Median age was 16.17 months (range, 1.43–92.10 months). Median intensive care and mechanical ventilator stay were eight days (range, 3–85 days) and five days (range, 0–85 days), respectively. Fifty percent of patients that died were malnourished; on the contrary, only 24.0% of survivors were malnourished for their ages. However, analysis reveals no relevant relationship for malnourishment, daily energy and protein intake with mortality. Summary of patient and intensive care admission characteristics are presented in Table 1.
We compare daily calorie intake and daily protein intake with prealbumin and RBP measured at the end of 24 hours. For example, we relate third day measurement with second day feeding. Because we didn't know day zero feeding amount, first day measurements had gone unassociated. Ratio of enteral protein intake to paraenteral protein were 49.7/50.3 for the first, 58.1/41.9 for the second, 68.6/31.4 for the third, 76.3/23 for the fourth day, 69.9/30.1 for the fifth, 67/33 for the sixth and 72.1/27.9 for the seventh days. Ratio of enteral nutrition protein to parenteral nutrition calorie were 45.2/54.8, 62.8/37.2, 75.2/24.8, 78.2/21.8, 77.5/22.5, 76/24 for the first to seventh day, respectively.
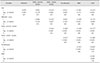
According to this evaluation, we affirmed strong positive correlation between daily calorie intake and daily protein intake. We found moderate correlation between daily calorie intake and prealbumin levels (r=0.432, p<0.001). Correlation of prealbumin level with daily protein intake is weaker (r=0.380, p<0.001), although worthy. Correlation between RBP level and daily protein intake (r=0.330, p<0.001) and daily calorie intake (r=0.282, p<0.001) are weaker but significant. Our study reveals no correlation between PRISM3 score and daily protein intake (r=−0.004), in addition PRISM3 score is weakly correlated with daily calorie intake. Correlation statistics are presented in Table 2.
When we looked for the relationship between different age groups, that include 0 to 12, 13 to 48, and 49 to 96 months, we found that daily calorie and protein intake of patients older than 48 months are less than others (p<0.001). Positive correlation between daily calorie intake and prealbumin levels are valid for each age group, and when patient is older than a year, correlation is much stronger (13–48 months, r=0.625; 49–96 months, r=0.414).
Parameters found relevant with prealbumin and RBP levels are re-evaluated with linear regression analysis. To prevent co-linearity, daily calorie intake and daily protein intake are analyzed separately. Regression analysis revealed that changes of pre-albumin levels can be explained by change in CRP, daily calorie intake, and protein intake but not with age or PRISM3 score. A unit increase in CRP decreases prealbumin level by 2.11 (p=0.009); and one kcal increase in daily calorie intake increases prealbumin level by 1.07 (p<0.001) (adjusted R-square, 0.149). Regression analysis revealed CRP levels and initial PRISM3 scores have no effect on RBP levels. In terms of factors affecting RBP, 1-g increase in daily protein intake increases RBP by 3.26 (p=0.021); and a unit increase in PRISM3 increases RBP by 1.92 (p<0.001) (adjusted R-square, 0.141).
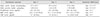
When we investigate levels of nutrition, CRP, and biomarkers at days 3, 5, and 7, we observed total calorie and protein intake increases at every measurement (p<0.001). However, for prealbumin, RBP and CRP levels changes at two day intervals are statistically insignificant. Between days 3 and 5; between days 5 and 7, change in prealbumin (p=0.742, 0.052), change in RBP (p=0.459, 0.307) and change in CRP (p=0.150, 0.707) levels are statistically insignificant. However, change between days 3 and 7 were statistically significant for all three: prealbumin (p=0.001), for RBP (p=0.007), and CRP (p=0.005) (Table 3).
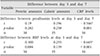
When we checked the relationship between changes of prealbumin, RBP, CRP, calorie and protein intake, we deduced that increase of prealbumin and RBP levels can only be explained by decrease of CRP levels. Correlation between increase of daily calorie or protein intake with prealbumin and RBP is weak and statistically insignificant (Table 4).
DISCUSSION
In this study we demonstrated that prealbumin levels were moderately correlated with daily calorie intake at pediatric intensive care patients, unlike Huang et al. [19] that reported no correlation between early enteral feeding and prealbumin levels. Even after adjusting for age, daily CRP levels and illness severity, prealbumin was positively correlated with daily protein and energy intake. This relationship was even stronger when the patient was older than a year. Besides correlation with daily calorie intake, prealbumin was also correlated with CRP levels even after adjusting with daily nutrition amount.
RBP levels were similarly correlated with daily calorie intake but relationship was stronger with daily protein intake. There was also correlation with PRISM3 score. After adjusting for age and severity of illness score, analysis revealed that the higher daily protein intake, the higher RBP levels.
However these regression analyses had low adjusted R-square that makes the effect of daily calorie intake on prealbumin levels and daily protein intake on RBP levels suspicious, so further analysis of data for difference between levels of prealbumin and RBP at third, fifth, and seventh days was needed. We analyzed our data for 34 patients' prealbumin, RBP, CRP and daily nutrition amounts at third, fifth, and seventh days. Davis et al. [20] found no correlation between change in prealbumin levels and delivered enteral calorie percentage. In that study changes in prealbumin levels are only significantly correlated with change in CRP. In further analysis, similar to literature, changes in prealbumin or RBP levels were significantly correlated with only changes in CRP and there was no relationship between change in prealbumin levels and daily calorie or protein intake. Similarly, there is no correlation for increase in daily protein or calorie intake and increase in RBP levels. Although we found correlation between prealbumin levels and daily calorie intake, neither changes in prealbumin levels nor RBP levels can be explained by increase in daily calorie or protein intake and we think that this makes it inappropriate to use prealbumin or RBP as nutrition assessment tools in PICUs.
In our study, duration of mechanical ventilation (five days), mortality (17.3%) and malnourishment based on weight or BMI z-scores were similar to previous studies [212223]. Insufficient nutrition and malnourishment are important parameters on outcome in PICUs [223]. In our study, malnutrition was twice common in deceased patients than surviving patients; however, we couldn't find a statistically important relationship between mortality and malnourishment. A larger number of patients may reveal a relationship for mortality and malnourishment.
In addition to PRISM3 score, we affirmed that high initial CRP level was correlated with higher mortality rate, a controversial finding in literature [2425]. Although it has revealed that severity of illness associated with delayed enteral nutrition [2627], we affirmed that, severity of illness had no effect on daily calorie and protein intake in our study that includes enteral and parenteral nutrition. Our feeding protocol, proponent of aggressive feeding and starting early total parenteral nutrition, may promote higher nutrition although not changing mortality or PICU duration.
Main limitation in our study is not using indirect calorimetry, the gold standard of adequate feeding. Our study population was not homogenous and maybe too diverse a population affects results. Also instead of using low and high calorie/protein intake groups, we fed all patients similarly. Further study with two groups with different protein and/or calorie intakes and measuring energy expenditure with indirect calorimetry is needed.
In conclusion, prealbumin and RBP are correlated with last 24 hours' diet, even after adjusting for severity of illness or age. However, they are not usable as follow up biomarker in PICU because their levels are related with CRP levels instead of related with nutritional uptake.
 XML Download