

 PDF
PDF ePub
ePub Citation
 Print
Print


INTRODUCTION
Dehydration is a significant depletion of body electrolytes and water, often secondary to acute gastroenteritis [1], or to other diseases that cause vomiting, diarrhea or polyuria [2]. In the United States, acute diarrhea is responsible for around 1.5 million outpatient visits, 200,000 hospitalizations and 300 deaths annually [3]. In Europe, according to an Italian study, it is estimated that rotavirus produces 3.6 million episodes of gastroenteritis [45].
Dehydration is a medical emergency, but there is no single standard parameter to evaluate it during the triage [6789] and there are no systematic reviews regarding the usefulness of history, objective examination, and laboratory tests to assess dehydration [10]. Weight loss recognized as an objective “gold standard” for dehydration rate [11] often cannot be calculated because recent or “baseline” hydrated weights are rarely available on acute-care visits [12]. Thus, several other related symptoms and signs should be considered including: urine output, sunken eyes, lack of tears, dry mucous membranes, heart rate (RR), respiratory rate (RR) and effort, capillary refilling time (RT), and skin turgor [11].
The European Society of Paediatric Gastroenterology Hepatology and Nutrition (ESPGHAN) guideline suggests different score systems to quantify dehydration, based on clinical signs and symptoms considered together (for example, RT, skin turgor, and urine output), called “dehydration scales” [13]. The American Academy of Paediatrics (AAP) guidelines recommend making clinical decisions based on the degree of dehydration: mild (3–5%), moderate (6–9%), or severe (>10%) [14].
In 2008, the Working Group of ESPGHAN [15] highlighted that none of the dehydration scales available at that time had a valid utility in individual patients and started a series of studies to validate the system introduced by Friedman et al. [16], the Clinical Dehydration Score (CDS). This scale consists in four clinical elements: general and eyes appearance, hydration of mucous and tears. Each item is rated from 0 to 2, and the total score is between 0 and 8. The three final categories are: no degree of dehydration (CDS score, 0), mild dehydration (CDS score, 1–4), and moderate/severe dehydration (CDS score, 5–8). In the last 15 years, the CDS has been validated by different studies [16171819]. In 2014, the Working Group of ESPGHAN published an update of the guidelines, which substantially confirm the results and conclusions obtained in 2008: the CDS scale had moderate interobserver reliability but should be used in combination with other criteria to guide the physician intervention [13].
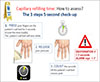
The RT is a simple and quick parameter to be obtained; the examiner presses fingernail for 5 seconds, and estimates the time needed to return at normal color after releasing the finger pressure [10]. The value for the non-dehydrated children is less than 2 seconds, whilst severity of dehydration increases with prolonged time up to 4 seconds which corresponds to severe shock [10].
Usefulness and validity of the RT in the assessment and severity of dehydration were attested in a systematic review included in the National Institute for Health and Care Excellence (NICE) guidelines of 2009 [11].
The aim of this study was to assess the reliability and validity of the RT in children who presented to the emergency department (ED) with symptoms suggestive of dehydration, such as diarrhea and vomiting. The second aim of the study was to demonstrate the feasibility of RT as a triage parameter.
MATERIALS AND METHODS
Setting and participants
This was a prospective comparative cohort pilot study. We collected data on children with symptoms at risk of dehydration, who presented to two Italian pediatric ED in Varese (between August 2015 and March 2017) and in Milano (between December 2016 and March 2017) whenever the physicians in charge of the study were on call. Informed consent was obtained from the guardians of all participants. The study was approved by the Institutional Review Board of Ospedale F. Del Ponte (No. 2015-0807).
Eligibility criteria included the presence of: acute diarrhea (at least three stools in liquid or semi-liquid consistency in the previous 24 hours) and/or vomiting (at least 3 episodes in the previous 24 hours). As exclusion criteria were considered: new born babies (correct age, <1 month), children on tube feeding, or with metabolic, or kidney or type 1 diabetes or mental retardation or severe neurological diseases, incomplete data collection form, poor Italian language comprehension and absence of informed consent.
Procedures
The study included two sequential parts, performed first by the nurse triage, and later by the attending clinician in the examining room. Eight nurses and four doctors participated in the study. We have included all nurses who were currently working in our accident and emergency (A&E) department as a fixed job and all doctors who were also working in the pediatric gastroenterology outpatient clinic. The decision to limit the number of health care professionals was based on personal willingness to participate to this pilot study and on frequent work overloading in A&E. Besides, we tried to have participants with both high motivation and similar experience to get better results.
Each nurse working in our ED was instructed about the study protocol and the correct way to elicit the RT prior to the study with a training session.
The nurses training on RT and dehydration assessment was based on a short frontal lecture on acute diarrhea and dehydration and explanation of the study performed by an expert physician (S.S.) followed by an interactive theorical and practical session during which doubts were clarified. The method of detecting the RT was first showed using slides, explained as reported in the literature and then practically performed and checked. Particularly it was highlighted that to obtain a correct measured the pressure should gradually be greater on the palmar surface of the distal fingertip, which must be released immediately after the capillary bed becomes pale, after which the elapsed time must be measured until the restoration of the normal color. A time less than 2 seconds means no dehydration; the longer the RT, the greater the dehydration. We then carried out practical tests on children admitted to A&E in the same day to make sure everyone has understood the method. All nurses found the explanation clear and the test simple to perform and the physicians were fully satisfied of the ability acquired by the nurses. We decided to repeat the training at the end of the first part of the study, to assess the nurses' performance and the re-evaluation was again excellent (Fig. 1).
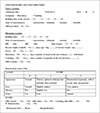
To all nurses the CDS scale appeared more subjective, difficult to score and time consuming than RT, so this scale was included only in the physician assessment. For data collection we used a standardized evaluation form which included items shown in Fig. 2.
At triage the nurses enrolled all children reporting symptoms of acute diarrhea or vomiting and filled in the first part of the form recording the RT. According to the triage code determining the time priority, the doctor reassessed the child performed a detailed history and physical examination, assigned a CDS score and RT, completed the form and started treatment. Whenever the nurse noticed a state of dehydration based on an alteration of the capillary RT, the physician was informed about the general condition of the child and the nurse assessment and authorized the administration of oral rehydration therapy (ORS) even before the visit, unless a suspicion of severe infection, lethargy or acute abdomen was raised.
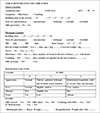
The partial results we obtained allowed us to create a new form (Fig. 3), which replaced the old one starting from July 2016. In this new form, we added the weight gain after rehydration, measured by a physician after the ORS rehydration therapy, to use it as an indicative weight of a state of good hydration and compare it with the weight measured at triage. At the beginning we not consider the patients' waiting time between nurse's and physician's RT assessment, so in the new form we introduce this measure and the quantity of ORS assumed by the dehydrated child.
Patient assessment and data collection
The data collected by the triage nurse included basic demographics, presenting symptoms (diarrhea, vomiting), general appearance and state of consciousness (unconscious, lethargic, normal, irritable), RT at the arrival in ED and the providing of ORS (after triage rating). The physician completed the assessment and filled in the second part of the same standardized form, recording the general appearance and state of consciousness; HR and RR, temperature, current weight and the previous weight (if available); symptoms (presence and type of diarrhea or vomiting, timing of onset, number of episodes in the previous 24 hours); RT, skin turgor, urine output reported at home, intake of ORS or other drink at home and CDS scale. RR was measured for 60 seconds by observing chest wall movements with the child quiet and comfortable [20]. We have defined tachycardia and tachypnea when HR and RR were above the 90th centiles, according to different age, as reported by a systematic review by Fleming et al. in 2011 [21].
Capillary RT was assessed at the fingertip by using a standardized technique [20]. Skin turgor was assessed by pinching a small skin fold between the thumb and index finger on the lateral abdominal wall at the level of the umbilicus [22].
Type of rehydration needed and the pop up of episodes of vomiting during oral rehydration were also reported. Finally, we considered the patient evolution in terms of discharge timing or hospitalization. In the new form we considered weight gain after rehydration to overcome the lack of an available previous weight in most of cases.
Outcomes
The primary outcome of our project was reliability of RT; to demonstrate the equivalence between triage nurse and clinician assessments of the RT, by comparing results of the tests and finding out if they match for every child or if they were different. Our final purpose is to introduce this parameter in the triage line up for quantification of dehydration and assignment of the priority code.
The secondary outcome was to demonstrate the validity of RT for the rapid quantification of presence and degree of dehydration. We compared RT with parameters thought to be reflective of dehydration presence and severity; the CDS scale, the number of episodes of vomiting and diarrhea before presentation to the ED, RR, HR, length of hospital staying, percentage of weight loss [17]. Discriminative validity was assessed by the need of intravenous rehydration therapy.
Analysis
Characteristics of the study sample were described with frequency counts and percentages for categorical variables. The triage nurse evaluation of general aspect and RT were compared with the valuation of attending physician by using chi-squre test of Pearson's and Cohen's kappa to demonstrate interobserver reliability. A p-value less than 0.05 was considered statistically significant. Results were interpreted according to the criteria of Landis and Koch [23], in which κ values of 0.21 to 0.40, 0.41 to 0.60, 0.61 to 0.80, and 0.80 signify fair, moderate, substantial, and almost perfect agreement, respectively. In estimating validity, correlations were quantified by using Pearson correlation coefficient (Pearson's ρ). We sought statistical associations between variables indicative of dehydration (weight loss, cardiac and respiratory frequency, the number of episodes of diarrhea, vomiting, combination of diarrhea and vomiting, and the discharge time) and the RT; we repeated the analysis also for the score obtained on the CDS scale. Finally, discriminative validity was assessed as the area under the receiver operating characteristic (ROC) curve. We calculated the area under the curve (AUC), to estimate the specificity and sensitivity of RT and CDS, using as discriminating positive for the state of dehydration the start of intravenous therapy, then measuring the difference between the two AUC. Sensitivity, specificity, positive likelihood ratio, positive predictive value, and negative predictive value were quantified by using the start of intravenous therapy as parameter reflective of dehydration severity.
RESULTS
We included 242 children aged 9 months to 17 years. In our population 133 (55.0%) children aged between 0 and 3 years, 92 (38.0%) children aged between 4 and 12 years and only 17 (7.0%) adolescents were between 13 and 17 years old. The presenting symptom was: diarrhea in 39 (16.1% of the population), vomiting in 112 (46.3%), association of vomiting and diarrhea in 89 (36.8%) children, whilst only one case (0.4%) complete refuse to feed and to drink was reported.
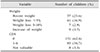
Only 57 (23.6%) patients had a documented previous weight assessed by a physician or, in the new form, a weight after the rehydration therapy (which was found in 24 children [9.9% of the total]). Among this group, 41 (71.9%) showed a <5% weight loss (respect to the previous evaluation) and 7 (12.3%) a weight loss between 5% and 10% of the usual weight. The others 9 children (15.8%) showed an increased weight: only one pointed out signs of dehydration (RT=2, CDS=1) (Table 1).
The new form allowed us to analyse patients' waiting time between nurse's and physician's RT assessment in 70 children: the average expectation between patients with altered RT at the triage was 24 minutes, with a median of 20 minutes, compared to an average of 41 minutes and a median of 30 minutes in children with a normal RT.
A post-rehydration weight was collected in 24 children: 41.7% showed a <1% weight gain; 33.3% a weight gain between 1% and 2%; 20.8% between 2% and 3%; only 4.2% a >3% weight gain.
The CDS at the visit was found equal to 0 in 151 (62.4%) cases and between 1 and 4 in 83 (34.3%) children. There were no cases with CDS above 4, as we can see in Table 1. The physician reported that the lack of crying limit the validity of assessment for the presence of tears in 27 cases (11.2%) and because of this uncertain parameter the score was not completed in 8 children (3.3%).
RT reliability
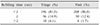
The RT evaluated by the triage nurse was <2 seconds in 196/242 children (81.0%) and ≥2 seconds in 46 cases (19.0%). The attending physician found the RT <2 seconds in 208/242 children (86.0%) and, ≥2 seconds in just 34 (14.0%) cases (Table 2).
We compared the RT test results obtained by nurses and physicians. The evaluation was concordant in 207 cases (85.5%), discordant in 35 cases (14.5%): among these, in 26 children (74.3%, or 10.7% of the total) the triage nurse overestimated the dehydration compared to the physician's one. In 9 of these 26 children, the nurse gave the ORS to the children after the triage, so the rehydration therapy was started before the visit; this can explain the relative overrating of dehydration in these children. The correlation between the measurements obtained by the nurse with the physician's evaluations was rated as moderate in accordance with the valuation guidelines Cohen's kappa (κ=0.480; 95% confidence interval [CI], 0.073 to 0.534).
After that we ruled out the children whom a nurse
gave ORS before the physician's visit and we calculated the Cohen's kappa with the new data: the result was similar, with a moderate Cohen's kappa value (κ=0.556; 95% CI, 0.411 to 0.701). Pearson's chi-square test showed a moderate contingency between the measurements (contingency coefficient, 0.42).
RT validity
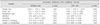
Results of correlation between RT, CDS scale scores and variables are shown in Table 3.
The highest degree of correlation was found between RT and weight loss of percentage calculated using a previous weight reported by the parents, when available (ρ=−0.27; 95% CI, −0.47 to −0.04; p=0.019); it confirmed the statistical significance of the parameter. The correlation between length of stay and RT was lower but still significant (ρ=0.22; 95% CI, 0.09 to 0.35; p<0.01).
The number of diarrhea associated with vomiting episodes in 24 hours was correlated with the increase in RT (ρ=0.33; 95% CI, 0.12 to 0.51; p<0.01).
The correlation between CDS scale scores and the different parameters was similar: we found the maximum degree of correlation between CDS and percentage of weight loss (ρ=−0.37; 95% CI, −0.55 to −0.15; p<0.01), with statistical significance. A significant correlation was found between CDS and length of stay (ρ=0.15; 95% CI, 0.01 to 0.28; p=0.03) and between CDS and the number of episodes of diarrhea associated with vomiting during the previous 24 hours (ρ=0.37, 95% CI, 0.16 to 0.54; p<0.01).
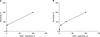
For the outcome of intravenous rehydration therapy, the AUC was 0.65 for the CDS (95% CI, 0.57 to 0.73; p<0.01). Sensitivity and specificity were found to be respectively 51.2% and 72.5%. AUC for the RT score was 0.65 (95% CI, 0.57 to 0.72; p<0.01). The sensitivity and specificity were evaluated as 33.0% and 97.6%, respectively (Fig. 4).
DISCUSSION
Proper assessment of dehydration is the critical step for a correct management and prompt rehydration treatment of children with acute diarrhea and vomiting. However, no specific parameter of dehydration is currently included in the triage line-up.
In our study, we evaluated the reliability of the RT performed by the triage nurses and compared the signs of dehydration, RT and CDS scale in a population of children who presented to our ED.
Our results confirmed that acute vomiting and diarrhea is a common cause of referring to ED and in most cases rehydration therapy with ORS is the only treatment needed and can be started immediately, even before the during the time the patient is waiting before the visit, as recommended by several authors [4813] and international guidelines [1113]. According to our results, the evaluation of RT in triage allowed nurses to give priority to patients who present dehydration and so to reduce the waiting time.
Our goal was twofold; first, to demonstrate the equivalence between RT measurement by triage nurse and attending physician and, then, to prove the reliability, validity and easiness of the RT in the evaluation of children at risk of dehydration because of diarrhea and vomit.
The Pearson's chi-square test evaluated the contingency between the two measurements (nurse and physician) as moderate, according to current statistical guidelines [24] (ρ=0.42). The Cohen's kappa, however, defined a moderate correlation (κ=0.56): the result could have been higher, but due to there an imbalance in the appearance frequency of the system variables, with an excess of non-dehydrated children, the “kappa paradox” phenomenon occurred [2526].
In most cases the triage nurse correctly assessed the hydration status of the children and ensured a prompt introduction of ORS and a speedy handling of the dehydrated patient who needs an earlier physician assessment. In 14.5% of our children we found a discrepancy in the evaluation of dehydration between nurses and physicians, mainly related to an overestimation by the nurse of the degree of dehydration (74.3%) compared to an underestimation (25.7%) of these cases. This discrepancy can be due to some limits of our study; the lack of data regarding the elapsed time between triage assessment and the physician visit and the number of inter-current episodes of vomiting or diarrhea could explain the nurses' underestimation. The children's grade of dehydration could get worse with a long time between triage evaluation and physician's visit. On the other hand, the assumption of ORS during the time spent in the waiting room could change in a better way the state of hydration of the children. The nurse's overestimation allows a good management of the patient; the prompt administration of ORS in case of not clinically detectable dehydration can be configured as a preventive treatment.
For the secondary outcome of our study we found that RT moderately correlated with other two parameters previously reported in the literature [11] as indicative of dehydration, such as weight loss (ρ=−0.27) and the length of staying in ED, assumed as a direct indicator of the time required to complete rehydration of the patient (ρ=0.22) and showed a similar correlation compared to the CDS scale.
The ROC curve pointed out that there's no differences between the two AUC; it means that the two methods are comparable to assess dehydration in children. Current guidelines on gastroenteritis in children [1113], consider the CDS scale as the best method to assess the presence and the severity of dehydration; the results obtained with the ROC curve in our population equate RT to CDS scale and demonstrate its validity and reliability.
RT has more specificity (97.6%) than CDS (72.5%) for the outcome of intravenous rehydration therapy need: children with a RT <2 seconds are certainly not dehydrated and a RT >2 seconds is indicative of rehydration therapy need.
It is noteworthy that weight loss estimation, considered as the ideal parameter to assess dehydration, is not frequently available in children and may limit the validity of our analysis.
Finally, all nurses of our ED learned to use RT in a few minutes, appreciated to have an easy, quick and reliable parameter for the dehydration assessment of the children at triage and reported that the CDS scale appeared more subjective than RT, difficult to score and time consuming.
The limits of our study consisted mainly by the small number of children referring to our A&E department with moderate or severe dehydration and by the lack of a recent weight data in most of our children.
In accordance with the literature [1113], the utility of dehydration estimation by the triage nurses was limited by the low proportion of children with RT >2 seconds.
The low sensitivity shown by the RT and CDS could therefore be attributable to the large number of children who were not or slightly dehydrated (RT <2), who did not need this therapy.
Another limitation to our study was the impossibility to calculate the weight loss due to unavailable recent weight in many of our children. To minimize this effect, we introduced in the final form and analysis the post rehydration weight as a surrogate of the weight loss and we have considered the difference in weight as a mirror of the rehydration rate. We also analyzed, whenever reported, the need of intravenous rehydration that could be considered as an indirect indicator of dehydration. In our population the low sensitivity shown by the RT and CDS compared to this treatment could be due to the low sample size that was on intravenous treatment. Besides, the rate of intravenous rehydration could also be related to other factors not dependent on hydration state such as persistent vomit, parental or patient non-compliance with oral rehydration solution, suspicious of acute abdomen, electrolyte imbalance.
To improve the quality of the study we added other evaluation parameters to the study's form; the length of waiting time, the number of vomits or diarrhea episodes during that period and the quantity of ORS solution taken by children before visit. We reached some results about the evaluation of the length of the waiting time, but for the other aspects the results were accurate, but partial and so we decided not to include them in this study to not distort the structure of the original study. Our intention is to propose it as multicentric using the new form, to evaluate the replicability especially of the RT in different hospitals and triage and to increase the number of children with dehydration and allow a more accurate statistical analysis.
Our study showed that the RT is a quick and easily measurable parameter that can be introduced during the triage assessment and represents a reliable and valid method for the valuation of dehydration in children. Although most children referring to the ED are not dehydrated, the nurse fast recognition of dehydration can allow a prompt start of ORS rehydration and determine a different priority access to physician assessment compared to the symptom reported by parents or the general appearance in patients with acute vomiting or diarrhea.
 XML Download