Abstract
The manufacturer of a linear accelerator (LINAC) has reported that the target melting phenomenon could be caused by a non-recommended output setting and the excessive use of monitor unit (MU) with intensity-modulated radiation therapy (IMRT). Due to these reasons, we observed an unexpected beam interruption during the treatment of a patient in our institution. The target status was inspected and a replacement of the target was determined. After the target replacement, the beam profile was adjusted to the machine commissioning beam data, and the absolute doses-to-water for 6 MV and 10 MV photon beams were calibrated according to American Association of Physicists in Medicine (AAPM) Task Group (TG)-51 protocol. To verify the beam data after target replacement, the beam flatness, symmetry, output factor, and percent depth dose (PDD) were measured and compared with the commissioning data. The difference between the referenced and measured data for flatness and symmetry exhibited a coincidence within 0.3% for both 6 MV and 10 MV, and the difference of the PDD at 10 cm depth (PDD10) was also within 0.3% for both photon energies. Also, patient-specific quality assurances (QAs) were performed with gamma analysis using a 2-D diode and ion chamber array detector for eight patients. The average gamma passing rates for all patients for the relative dose distribution was 99.1%±1.0%, and those for absolute dose distribution was 97.2%±2.7%, which means the gamma analysis results were all clinically acceptable. In this study, we recommend that the beam characteristics, such as beam profile, depth dose, and output factors, should be examined. Further, patient-specific QAs should be performed to verify the changes in the overall beam delivery system when a target replacement is inevitable; although it is more important to check the beam output in a daily routine.
Go to : 
REFERENCES
1.Low DA., Harms WB., Mutic S., Purdy JA. A technique for the quantitative evaluation of dose distributions. Med Phys. 1998. 25:656–661.

2.Hussein M., Clark CH., Nisbet A. Challenges in calculation of the gamma index in radiotherapy - Towards good practice. Phys Med. 2017. 36:1–11.

3.Dobler B, et al. Hybrid plan verification for intensity-modulated radiation therapy (IMRT) using the 2D ionization chamber array I'mRT MatriXX–a feasibility study. Phys Med Biol. 2010. 55:N39–55.

4.Almond PR, et al. AAPM's TG-51 protocol for clinical reference dosimetry of high-energy photon and electron beams. Med Phys. 1999. 26:1847–70. .7.
5.Lloyd S AM, et al. TG-51 reference dosimetry for the Hal-cyonTM: A clinical experience. J Appl Clin Med Phys. 2018. 19:98–102.
6.Kim JI, et al. A multi-institutional study for tolerance and action levels of IMRT dose quality assurance measurements in Korea. J Appl Clin Med Phys. 2013. 14:24–37.

7.Klein EE, et al. Task Group 142 report: quality assurance of medical accelerators. Med Phys. 2009. 36:4197–4212.
8.Park JM., Park SY., Wu HG., Kim JI. Commissioning Experience of Tri-Cobalt-60 MRI-guided Radiation Therapy System. Prog Med Phys. 2015. 26:193–200.

9.Li JG., Yan G., Liu C. Comparison of two commercial detector arrays for IMRT quality assurance. J Appl Clin Med Phys. 2009. 10:62–72.

10.Steers JM., Fraass BA. IMRT QA: Selecting gamma criteria using error curves. Med. Phys. 2016. 43:1982–1994.
11.So-Yeon Park, et al. Optimal Density Assignment to 2D Diode Array Detector for Different Dose Calculation Al-gorithms in Patient Specific VMAT QA. J Radiat Prot Res. 2017. 42:9–15.
12.Ezzell GA, et al. IMRT commissioning: Multiple institution planning and dosimetry comparisons, a report from AAPM Task Group 119. Med. Phys. 2009. 36:5359–5373.

13.Eclipse Photon and Electron Reference Guide. Document ID P1008611-002-B. Palo Alto, CA, USA: Varian Medical Systems Inc.;2014. 50.
Go to : 
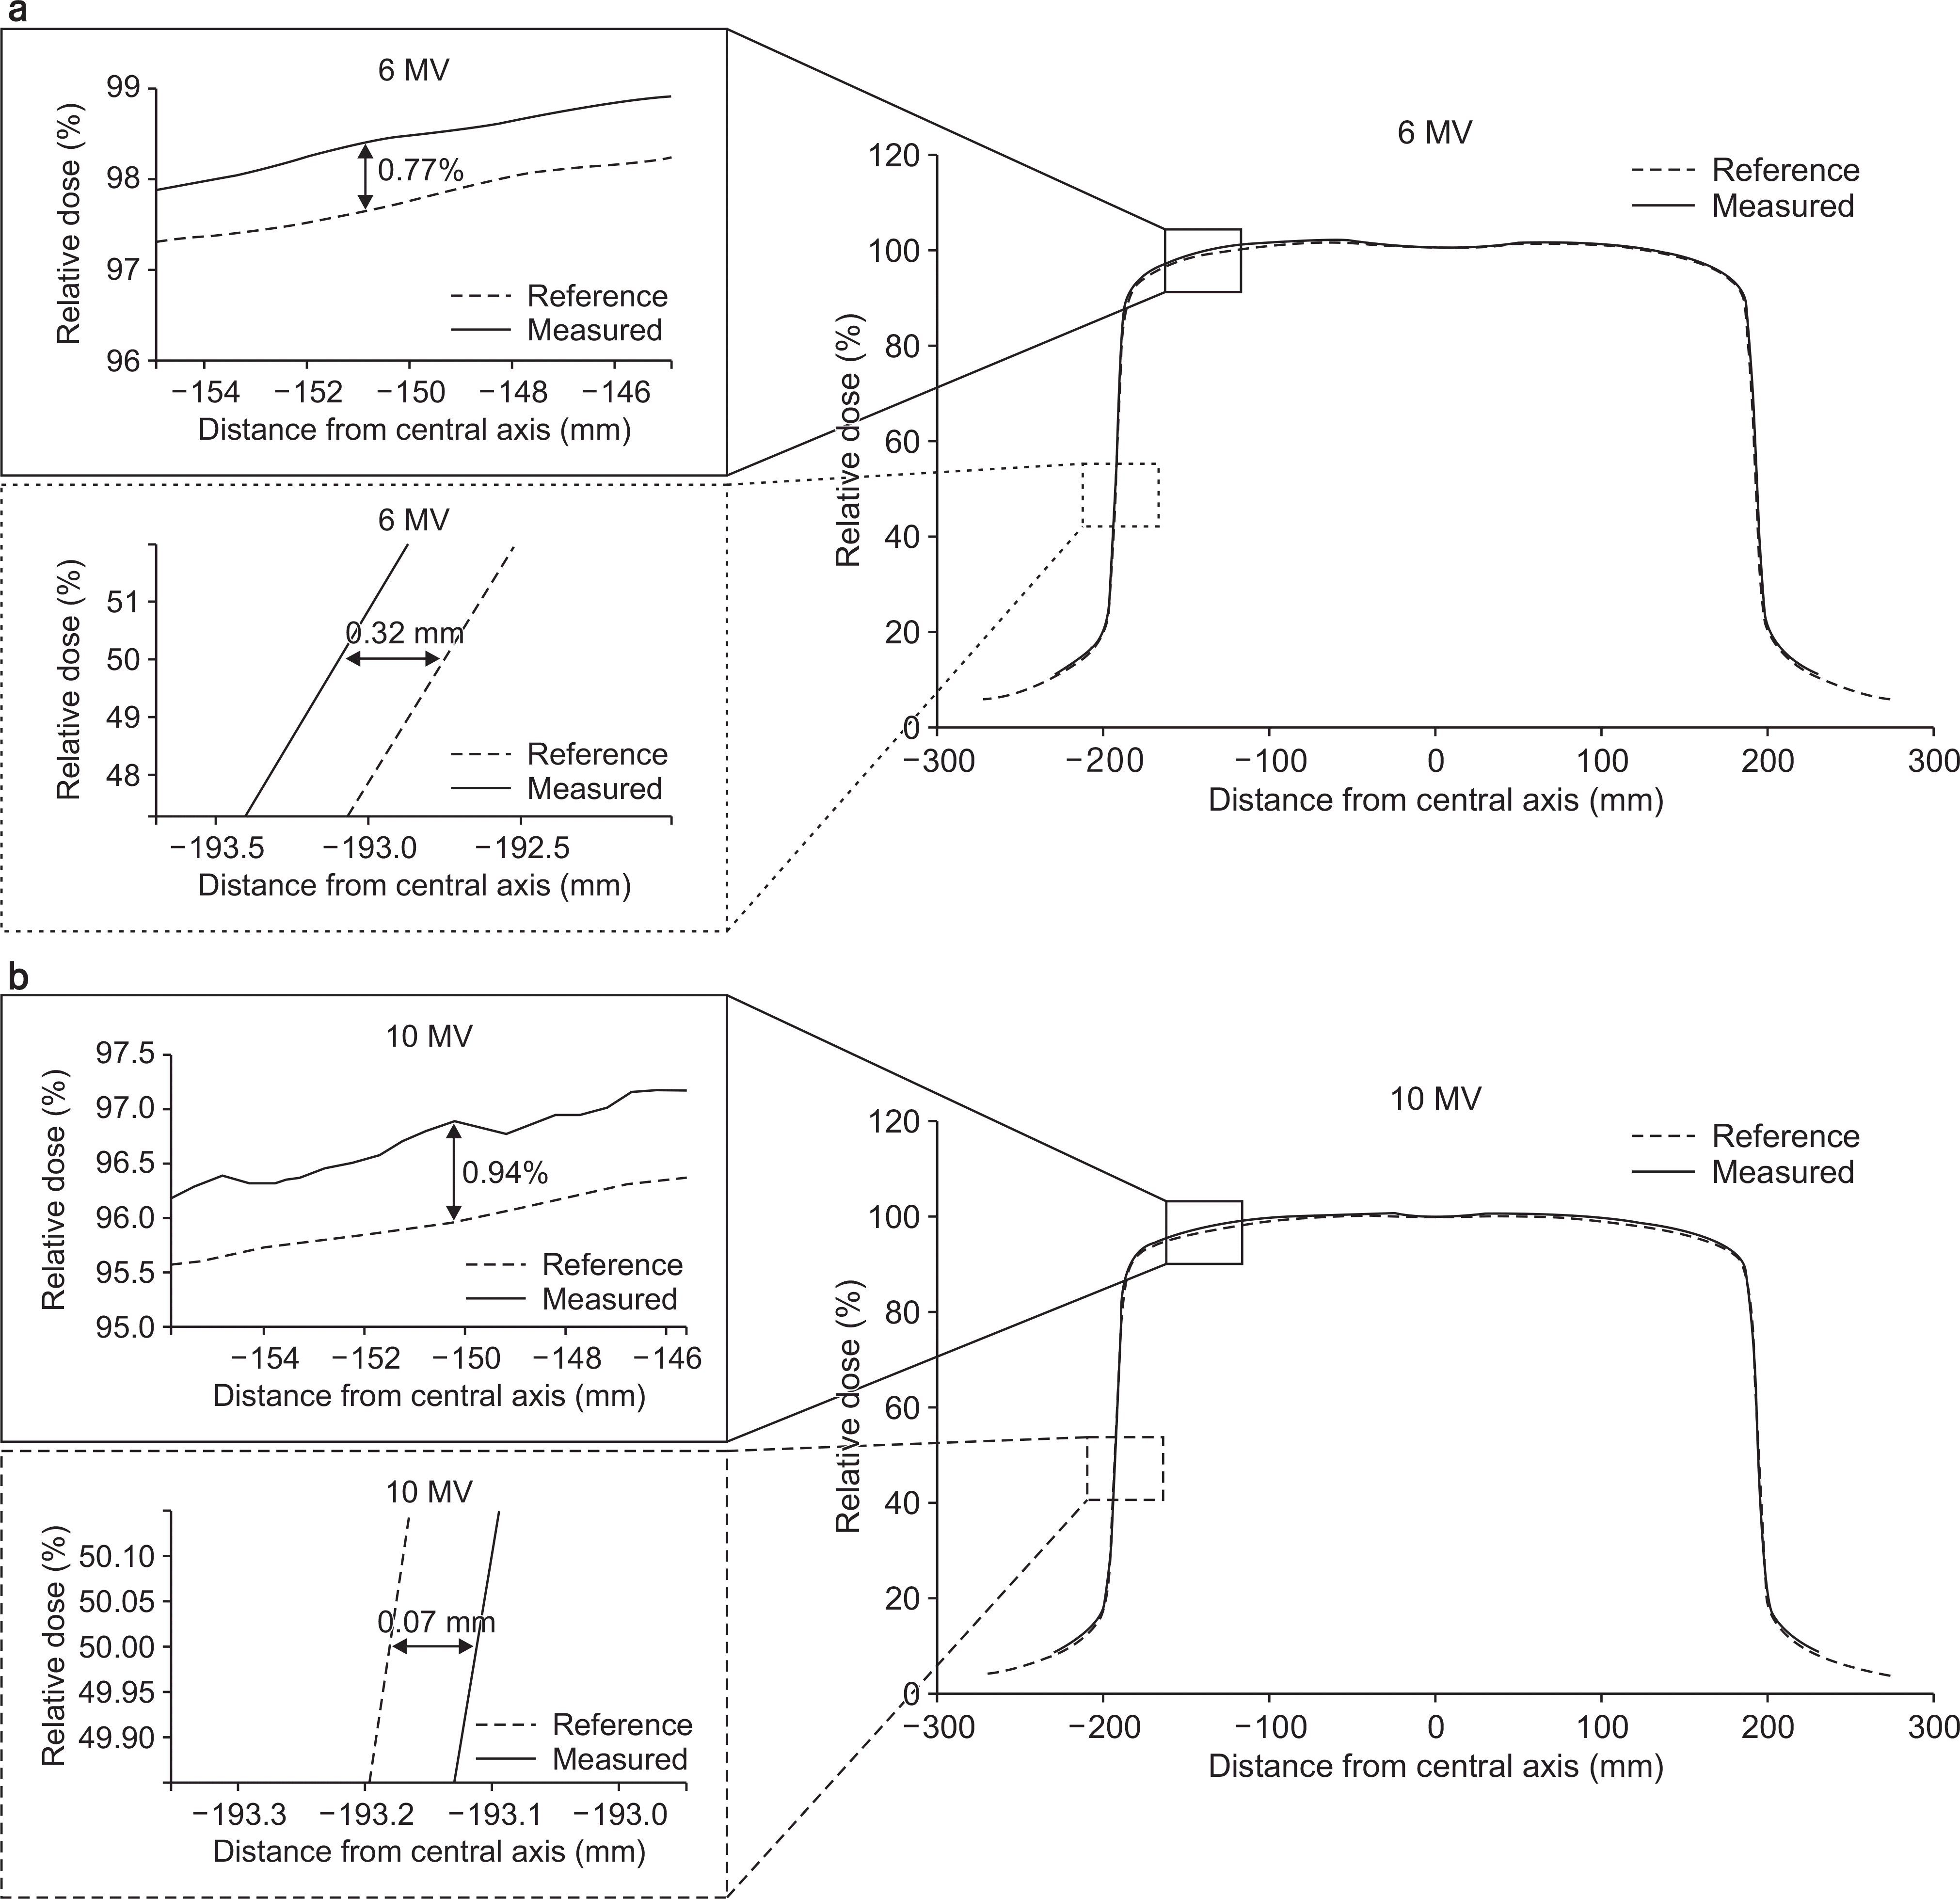
 | Fig. 2Profile comparison between reference (dashed line) and measurement (solid line) for (a) 6 MV, (b) 10 MV photon beam. The measurement condition was as follows: source-to-surface distance (SSD) of 100 cm, reference depth of 10 cm, and field size of 35×35 cm2. |
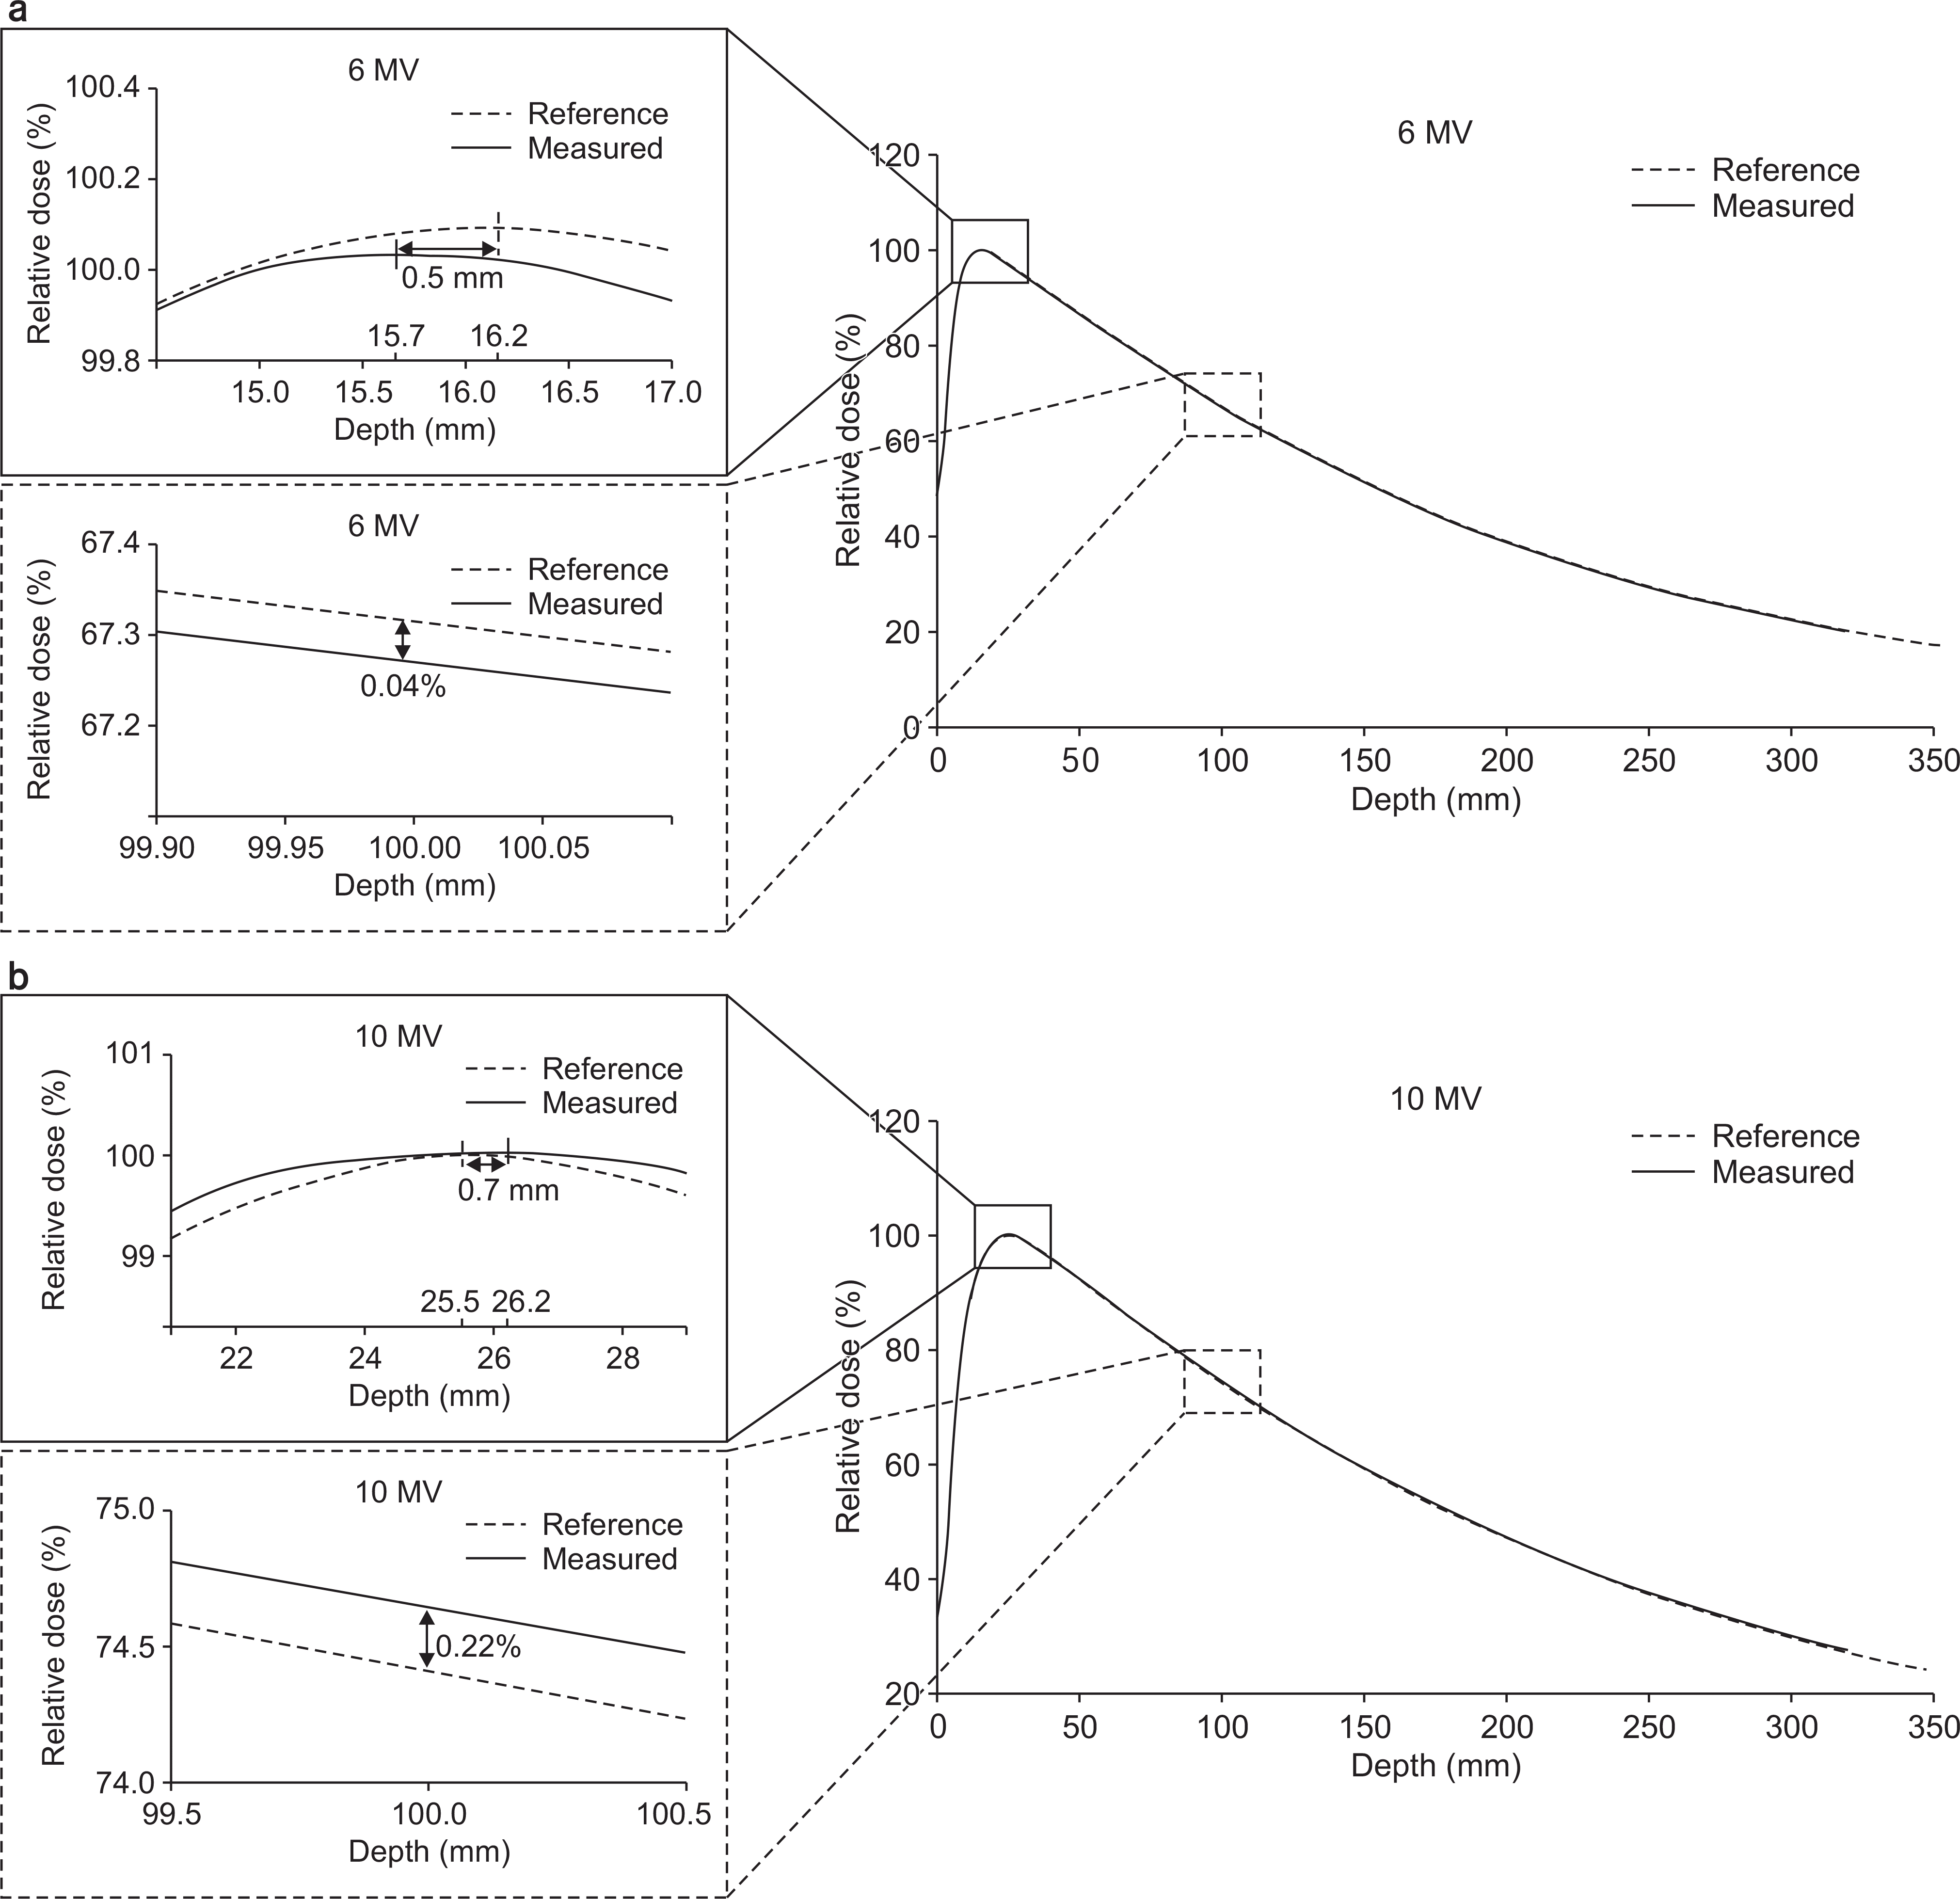
 | Fig. 3Percentage depth doses comparisons between reference (dashed line) and measurement (solid line) for (a) 6 MV, (b) 10 MV. |
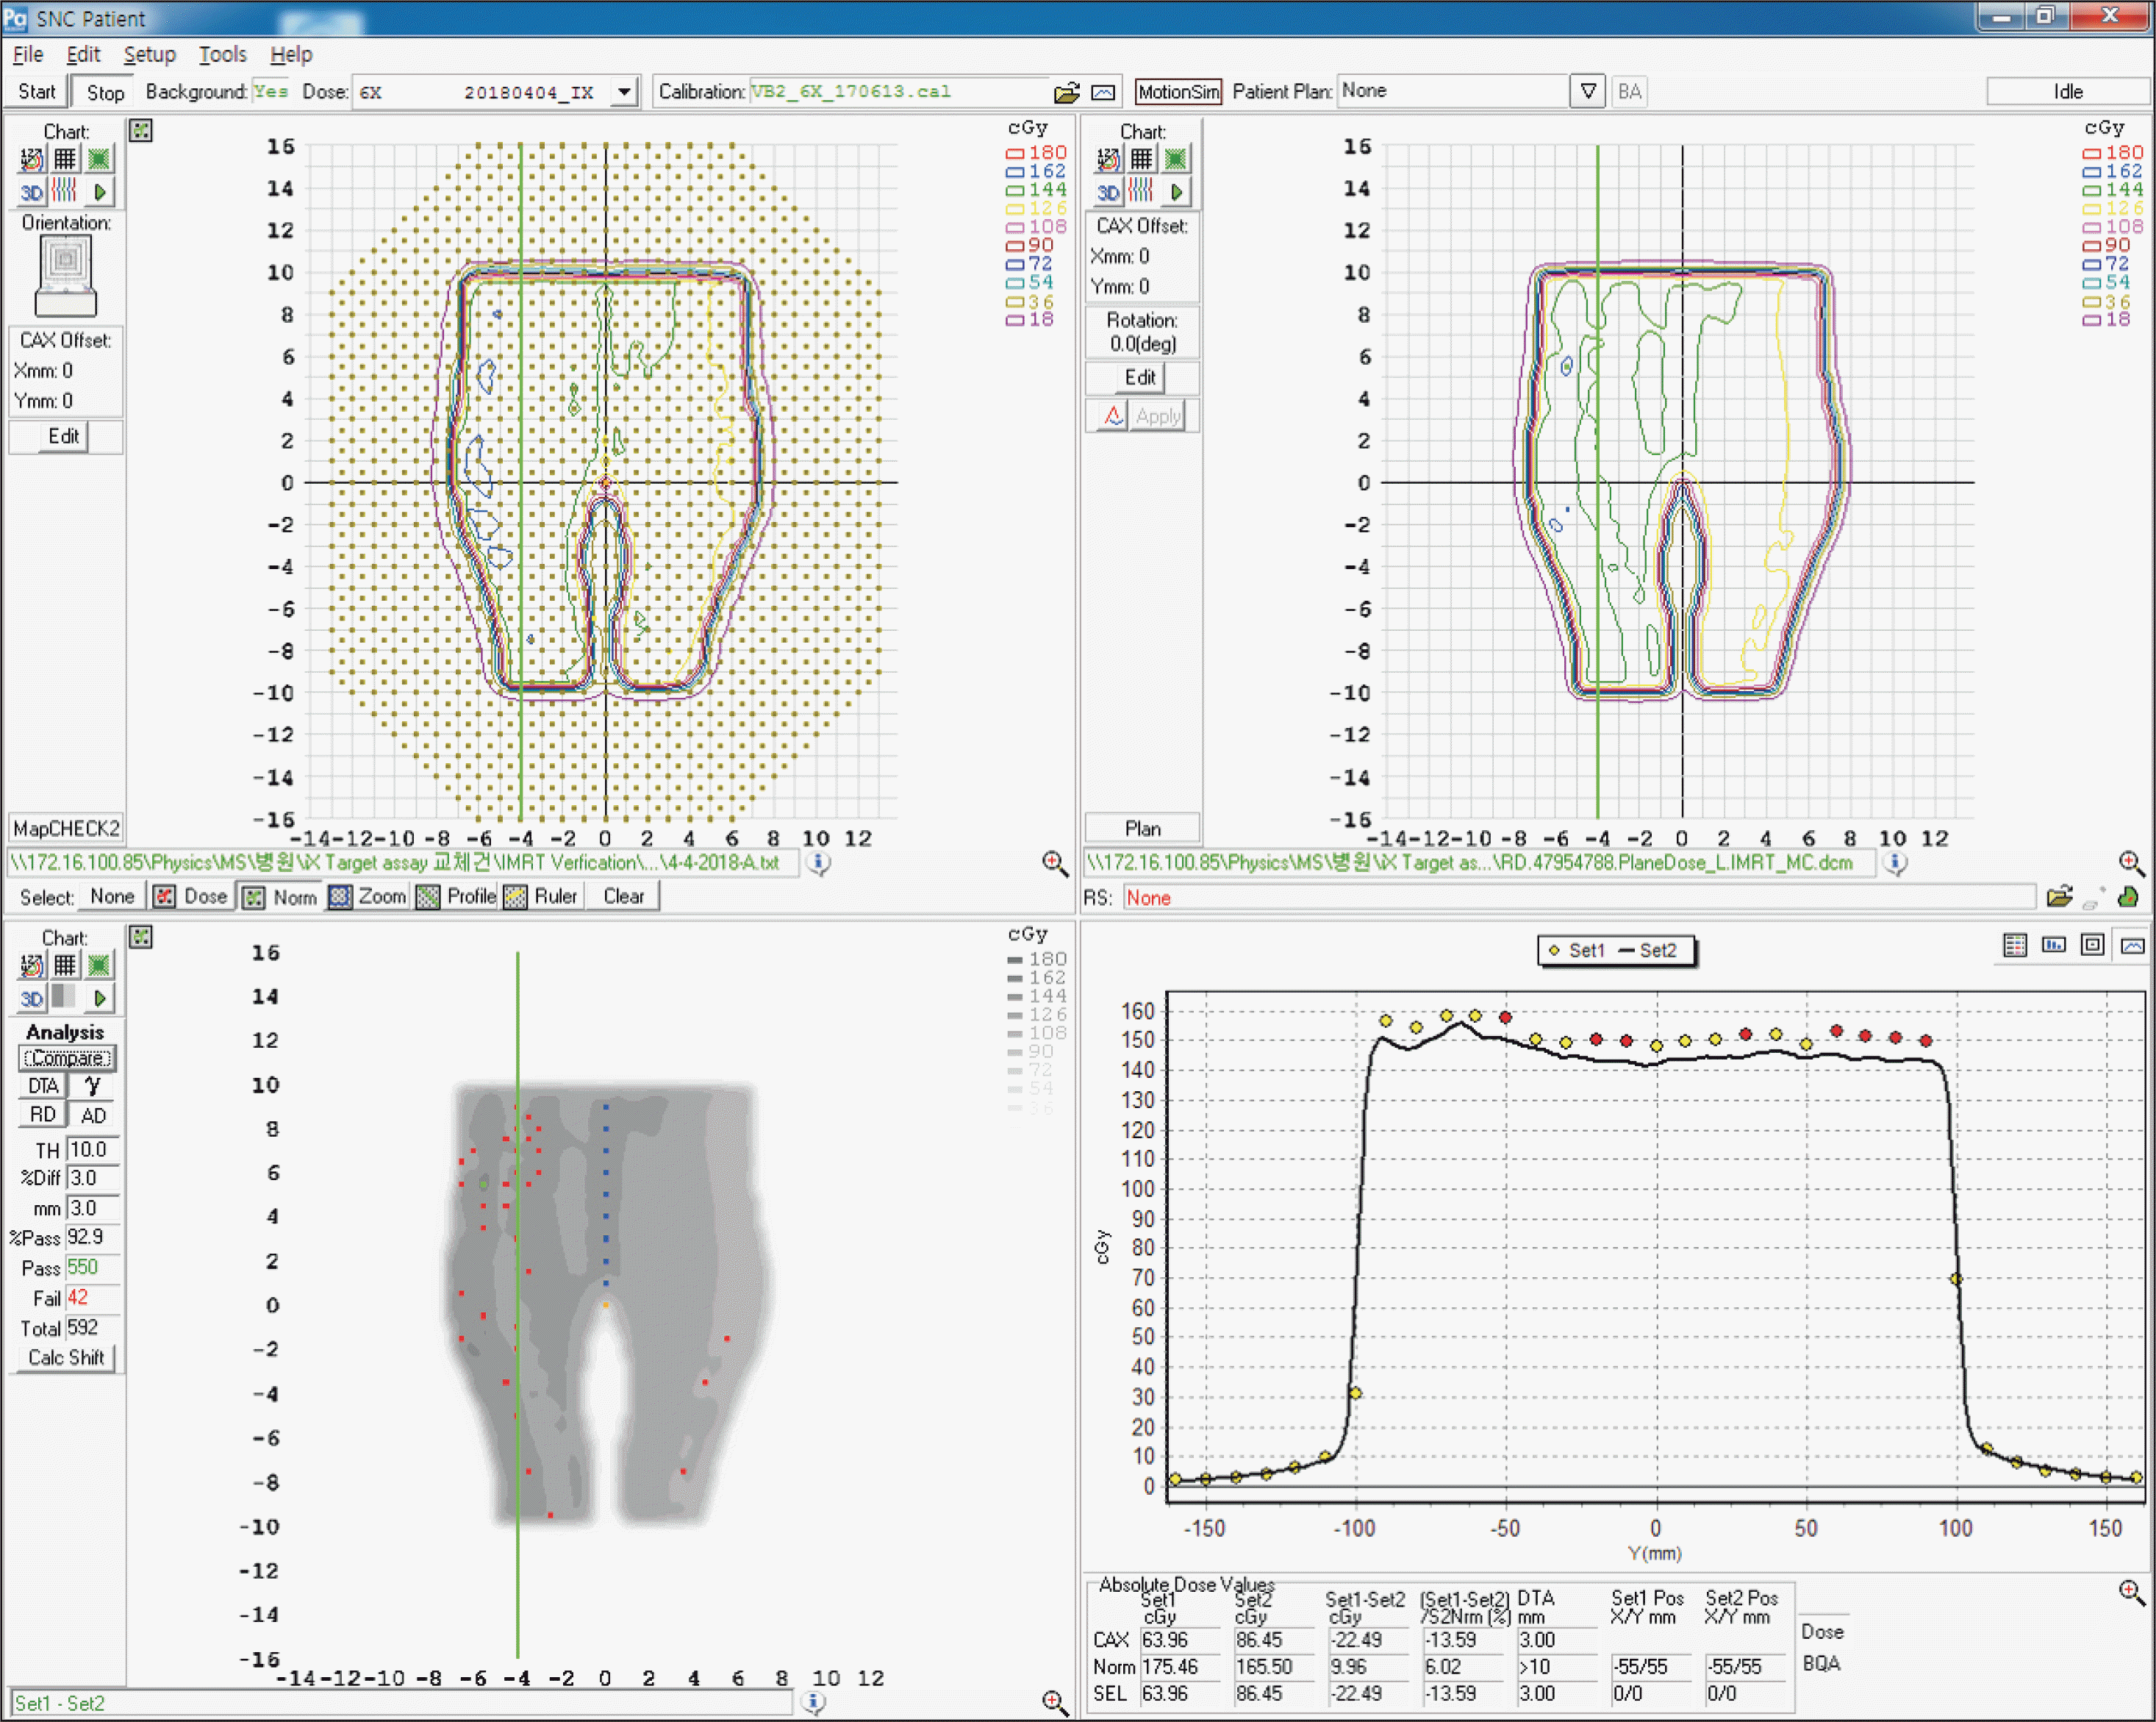
 | Fig. 4Sample gamma analysis graphical user interface (GUI) provided by SNC Patient software (Sun Nuclear Corporation, Melbourne, FL) for verification of intensity-modulated radiation therapy (IMRT) plan. |
Table 1.
Percent depth dose at depth 10 cm (PDD10) comparisons between reference and measurement for 6 MV and 10 MV photon beam.
Table 2.
Flatness and symmetry comparison between reference and measurement data for different field sizes and depths for 6 MV and 10 MV photon beams.
Table 3.
Output factors comparison between reference and measurement data for 6 MV and 10 MV photon beams.
Table 4.
Gamma passing rates for eight patients with two types of detectors.
| Patient | Energy | MapCHECK2 (∗Abs.) | MatriXX (†Rel.) |
|---|---|---|---|
| Patient 1 | 6X | 92.9% | 98.4% |
| Patient 2 | 10X | 99.5% | 99.9% |
| Patient 3 | 10X | 96.7% | 98.5% |
| Patient 4 | 6X | 92.9% | 98.6% |
| Patient 5 | 6X | 99.0% | 100.0% |
| Patient 6 | 6X | 99.8% | 100.0% |
| Patient 7 | 10X | 99.8% | 100.0% |
| Patient 8 | 6X | 97.2% | 97.3% |


 PDF
PDF ePub
ePub Citation
 Print
Print


 XML Download