

 PDF
PDF ePub
ePub Citation
 Print
Print


INTRODUCTION
Asthma is one of the most common chronic respiratory diseases affecting 1%–18% of the population in different countries, which is characterized by chronic airway inflammation with underlying heterogeneous inflammatory mechanisms that result in multiple clinical phenotype.1234 Although there is a positive declining trend for asthma mortality,5 asthma plus allergic rhinitis is the most frequently diagnosed multiple respiratory disorders, which has a significant impact on disease burden across the Asia-Pacific region.6 Obesity is also a major public health concern, whose prevalence has dramatically and concurrently increased with asthma over the last decades.7 Epidemiological studies have shown that obesity is associated with increased risk of incident asthma8 and other allergic diseases.9 It has also been proved that obesity is associated with worse clinical outcomes and decreased response to asthma medication,8 “Obese asthma” phenotype has been identified in unbiased cluster analyses,10 but the underlying mechanisms remain poorly understood.
As well known, obesity is associated with metabolic dysregulation which is one of the most important pathophysiological mechanisms underlying obesity-related diseases.11 In recent decades, there is growing evidence that metabolic alterations are associated with immunological inflammation and worse clinical outcomes in obese asthma.121314 At the same time, metabolomics has emerged as a new tool to identify metabolites as biological markers for disease state, susceptibility, to monitor response to treatment, and to determine the therapeutic potential targets.15 It is of great clinical relevance to search for metabolic signatures discriminating obese asthma based on metabolomics techniques, which may reveal the linking mechanisms of obesity and asthma, and improve current treatments of patients by allowing a more precision and personalized medicine.
To the best of our knowledge, there is only 1 metabolomics study exploring the pathophysiologic mechanisms of obese asthma.16 In fact, the previous study has produced promising results in defining a distinct obesity-asthma metabotype. However, like most of the other metabolomics studies,17 it just reported metabolic profiles in the exhaled breath condensate (EBC) and did not explore further correlations between relevant metabolites and clinical characteristics or inflammation biomarkers. Probably, it is more difficult to obtain a reliable interpretation and correlation of these metabolites with the disease based on EBC sample, and it can be more justified with the use of bronchoalveolar lavage fluid (BALF), or induced sputum for exploratory studies that aimed at obtaining a close molecular mechanism of a respiratory disease.18 Moreover, obesity is well known as a status of low-grade inflammation both systemically and in the lungs.1920 Therefore, it is more plausible to examine the metabolic alterations in the peripheral blood and sputum of asthmatics with obesity to improve understanding of the molecular pathophysiologic mechanism.
In this study, we performed gas chromatography time-of-flight mass spectrometry (GC-TOF-MS) using induced sputum, serum and peripheral blood monocular cells (PBMCs) samples to detect the local and systemic metabolites in obese asthmatic patients. Our data demonstrated separation between obese asthmatic subjects and lean asthmatic subjects and identified several novel metabolic signatures relevant to clinical and inflammatory profiles of asthma.
MATERIALS AND METHODS
Subjects and study design
This cross-sectional study assessed eligible patients with obese asthma (n = 11) and lean asthma (n = 22) who were recruited from the Asthma Clinic of West China Hospital, Sichuan University between August 2015 and February 2016. The obese asthma group was defined as having obesity with BMI ≥ 30.0 kg/m2, and the lean asthma group was defined as having normal weight between 18.5 and 25 kg/m2 according to the World Health Organization.21 Asthma was based on a physician's diagnosis with a history of variable respiratory symptoms (e.g., wheeze, shortness of breath, chest tightness and cough) and either spirometric testing with a 12% or 200 mL improvement in forced expiratory volume in 1 second (FEV1) after 400 mcg ventolin (GSK, Avda de Extremadura, Spain) or a 20% or greater decrease in FEV1 with standard doses of methacholine (PD20FEV1 < 12.8 µmol) according to the Global Initiative for Asthma (GINA) guidelines1 and the National Asthma Education and Prevention Program (NAEPP).22 Only stable asthmatic patients, who had no exacerbation, respiratory tract infection or change in maintenance therapy in the previous 4 weeks, were included. Excluding criteria included unexplained weight change during the past 3 months, the existence of a previous diagnose of chronic respiratory disease and severe systemic disease such as lung cancer, bronchiectasis, heart disease, hypertension, diabetes or psychiatric disorders; medication use that may alter systemic inflammation and metabolism (e.g., hormonal contraceptives or statins); pregnant women; contraindication to spirometry or inability to complete study procedures. All patients were refrained from food intake on the day of sample collection in the same Asthma Clinic. The Clinical Research and Ethics Committee of West China Hospital (No. 2014-30) approved the study protocol, and written informed consent was obtained from all subjects.
Obesity and clinical assessment
All patients underwent assessment of obesity, demographics, medication use and asthma status using formatted questionnaires. Obesity was assessed by BMI, waist-to-hip ratio (WHR) and body composition. Height (cm), weight (0.1 kg), and waist (cm) and hip (cm) circumferences were recorded; body composition such as fat mass (FM), visceral fat area (VFA) and percent body fat (PBF) was measured by the body composition analyzer (InBody S10, Body Composition Analyzer; Biospace Co. Ltd., Seoul, Korea) according to the InBody S10 user's manual. Asthma control was evaluated using the Asthma Control Test23 (ACT), and the Asthma Quality of Life Questionnaire24 (AQLQ) was used to evaluate the impact of asthma in 4 life domains. Atopy was determined by skin prick testing (SPT) as previously described.25 We measured exhaled nitric oxide (FeNO) before spirometric testing using a NIOX analyzer (Aerocrine, Solna, Sweden), according to American Thoracic Society/European Respiratory Society (ATS/ERS) recommendations. Spirometry (MedGraphics Corp., St. Paul, MN, USA) was performed in accordance with the ATS/ERS guidelines.26
Sputum induction and processing
Sputum induction and processing were performed based on standard methods as described in our previous studies.27 Sputum was induced after the pre-treatment of 400 mcg salbutamol (GSK) using 4.5% saline atomized by an ultrasonic nebulizer (Cumulus; HEYER Medical AG, Bad Ems, Germany). If FEV1 was ≤ 40% of predicted, sputum was induced with 0.9% saline after it was deemed safe by the supervising physician. Sputum plugs were collected and an aliquot of 200 μL of sputum plug was quick-frozen immediately by liquid nitrogen and stored at −80°C for subsequent metabolism analysis. Further, a volume of 1% dithiothreitol (SPUTOLYSIN Reagent; Calbiochem®, San Diego, CA, USA) was added equal to 4 times the remaining sputum w at 1,500 rpm for 10 minutes, and the sputum supernatant was aspirated and stored immediately at −80°C for subsequent detection. Total and differential cell counts were performed with centrifugation-smear (CYTOPRO 7620; WESCOR®, Inc., South Logan, UT, USA) and staining preparation by well-trained Chinese and Australia lab researchers.
Peripheral blood sample collection
Serum and PBMCs samples were collected using standardized methods provided in the Methods section in the supplement file. Serum and PBMCs samples were quick-frozen by liquid nitrogen and stored at −80°C prior to metabolism analysis.
Inflammatory mediators detection
C-reactive protein (CRP), leptin and adiponectin in serum was measured by sandwich ELISA (R&D SYSTEMS, Inc. Minneapolis, MN, USA). Interleukin (IL)-1β, IL-4, IL-5, IL-6, IL-8, IL-13 and tumor necrosis factor (TNF)-α in sputum supernatant as local inflammation were detected by a Luminex-based MILLIPLEX® MAP Human Cytokine/Chemokine Magnetic bead Panel Kit (EMD Millipore Corporation, Billerica, MA, USA), and were analyzed using the software of Milliplex Analyst 5.1 as it has been demonstrated that the Luminex-based xMAP® panel can be used for multi-analyte profiling of sputum using the routinely applied method of sputum processing with dithiothreitol.2829
Metabolomics profiling
Sputum and peripheral blood metabolites were analyzed according to the procedure as described in the previously published metabolomics profiling methods.3031 Briefly, the thawed sputum and serum were extracted with methanol following vortex for 30 seconds. Metabolites were extracted from PBMCs using extraction liquid (Vmethanol:Vchloroform = 3:1) following vortex for 30 seconds. The resuspended cells were snap-freezed in liquid nitrogen for 5 minutes, were thawed at room temperature, and were ultrasonized for 10 minutes in 4°C water bath. The freeze-thaw cycle is repeated 3 times. L-2-chlorophenylalanine (1 mg/mL stock in dH2O; Shanghai Hengbai Biotech Co Ltd, Shanghai, China) was added as an internal standard. The samples were centrifuged at 12,000 rpm for 15 minutes at 4°C. Supernatant was transferred to a 2-mL GC-MS glass vial and was vacuum-dried at room temperature. The derivatized samples were obtained after the residue was incubated with methoxyamine hydrochloride (20 mg/mL in pyridine) for 30 minutes at 80°C, were bis-(trimethylsilyl)-trifluoroacetamide (BSTFA) plus 1% (v/v) trimethylchlorosilane (TMCS) (REGIS Technologies, Morton Grove, IL, USA) for 2 hours at 70°C subsequently, and were cooled to room temperature prior to GC-MS analysis.
Metabolomic profiling was identified by GC-MS analysis, which was performed using an Agilent 7890 gas chromatograph system coupled with a Pegasus HT time-of-flight mass spectrometer. The system utilized a DB-5MS capillary column coated with 5% diphenyl cross-linked with 95% dimethylpolysiloxane (30 m × 250 μm inner diameter, 0.25 μm film thickness; J&W Scientific, Folsom, CA, USA). An aliquot of 1 μL of the analyte was injected in a splitless mode. Helium was used as the carrier gas, the front inlet purge flow was 3 mL/min, and the gas flow rate through the column was 1 mL/min. The initial temperature was kept at 50°C for 1 min and then raised to 290°C at a rate of 10°C/min, where it remained for 10 minutes. The injection, transfer line and ion source temperatures were 280, 270, and 220°C, respectively. The energy was −70 eV in an electron impact mode. The mass spectrometry data were acquired in a full-scan mode with the m/z range of 33-600 (85-600 in PBMCs samples) at a rate of 20 spectra per second after a solvent delay of 366 seconds in sputum samples, 295.8 seconds in serum samples and 460 seconds in PBMCs samples, respectively.
Multivariate statistical analysis and metabolic pathway analysis
Chroma TOF4.3X software of LECO Corporation and LECO-Fiehn Rtx5 database were used for raw peak exacting, the data baseline filtering and calibration of the baseline, peak alignment, deconvolution analysis, peak identification and integration of the peak area, missing values of raw data were filled up by half of the minimum value. In addition, internal standard normalization method was employed in this data analysis. The resulted 3-dimensional data involving the peak number, sample name and normalized peak area were fed to the SIMCA14 software package (Umetrics, Umea, Sweden) for principal component analysis (PCA) and orthogonal projections to latent structures-discriminate analysis (OPLS-DA). In order to obtain a higher level of group separation and get a better understanding of variables responsible for classification, supervised orthogonal projections to OPLS-DA were applied. The parameters for the classification from the software, R2Y and Q2Y, were used to evaluate the goodness-of-fit and goodness of prediction retrospectively. To further validate the model, the permutation tests (n = 200) was proceeded.
The LECO/Fiehn Metabolomics Library was used to identify the compounds with a similarity value for the compound identification accuracy, which is reliable if the similarity is < 700. To refine this analysis, the first principal component of variable importance projection (VIP) was obtained. The VIP values exceeding 1.0 were first selected as changed metabolites. The remaining variables were then assessed by Student's t test (P < 0.05), and variables were discarded with no significant change between 2 comparison groups. The identified differential metabolites were further searched on online database, Kyoto Encyclopedia of Genes and Genomes (KEGG), PubChem Compound, Chemical Entities of Biological Interest (ChEBI), Japan Chemical Substance Dictionary Web (NIKKAJI) and Chemical Abstracts Service (CAS), and the top altered pathways were identified by pathway topology enrichment analysis in MetaboAnalyst 3.0 (http://www.metaboanalyst.ca/) with the impact of each pathway calculated using the Relative-betweenness Centrality.32
Statistical analysis
As for demographic and clinical measurements, continuous variables are expressed as means ± standard deviations or medians (interquartile ranges), depending on their distribution. Categorical variables are reported as absolute numbers and percentages. Group comparisons for continuous data were performed using either unpaired Student's t-tests (parametric data) or the Wilcoxon rank sum test (non-parametric data), with categorical variables evaluated by the χ2 test or Fisher's exact test. Pearson's (parametric data) or Spearman's (non-parametric) correlation was used to describe the specific correlation between differential metabolites and obesity or clinical and inflammation profiles, as previously described.33 A P value of less than 0.05 was deemed statistically significant. Statistical analysis was performed with the SPSS software (version 21.0; IBM Corp., Armonk, NY, USA).
RESULTS
Clinical and inflammation characteristics
The ACT scores were significantly lower in obese asthmatics than in lean subjects (P = 0.032). There was no statistical difference observed between the 2 groups in demographic data, smoking, quality of life, asthma duration, asthma medications, airway obstruction in FEV1%predicted and FEV1/ forced vital capacity (FVC), FeNO and IgE levels. Peripheral blood and sputum cell profiles were generally balanced between the 2 groups (Table 1). We also compared the differences in body composition between the 2 groups. Obese asthmatic subjects, as expected, had significantly higher BMI, FM, fat free mass (FFM), VFA and WHR than lean asthmatic subjects (all P < 0.05) (Table 2).
Table 1
Characteristics of asthmatic patients grouped according to body mass index
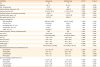
Data are normally distributed and presented as means (standard deviations); Data are nonparametric, presented as median (quartile 1, quartile 3). χ2 and t tests were used to compare groups.
Obese group, obese subjects with asthma; Lean group, lean subjects with asthma; ACT, asthma control test; AQLQ, asthma quality of life questionnaire; BDP, beclometasone dipropionate; ICS, inhaled corticosteroids; LABA, long-acting beta agonist; FeNO, fractional exhaled nitric oxide; FEV1, forced expiratory volume in 1 second; FVC, forced vital capacity.
*P value from the rank sum test; Significance were defined as P < 0.05.
![]()
Table 2
Obesity assessments and inflammatory mediators
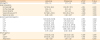
Data are normally distributed and presented as means (standard deviations); Data are nonparametric, presented as median (quartile 1, quartile 3). χ2 and t tests were used to compare groups.
Obese group, obese subjects with asthma; Lean group, lean subjects with asthma; BMI, body mass index; CRP, C-reactive protein.
*P value from rank sum test; Significance were defined as P < 0.05.
![]()
Obese asthmatic subjects had significantly higher leptin (P = 0.008) and lower adiponectin (P < 0.001) levels compared with lean asthmatic subjects, while the CRP level was comparable (P = 0.839). As for the inflammatory mediators in induced sputum supernatant, we found that IL-1β was significantly elevated in obese asthmatic subjects compared with lean asthmatic subjects (P = 0.047). However, there were no statistical differences in IL-6, IL-8, TNF-α. Interestingly, in comparison with lean asthmatic subjects, obese asthmatic subjects showed higher levels of IL-4 (53.5 [48.38–72.34] vs. 10.30 [0.60–29.26] pg/mL, P = 0.004), and IL-13 (3.92 [2.74–8.64] vs. 2.46 [1.96–3.04] pg/mL, P = 0.017) (Table 2).
Metabolic profiles discriminates between OA and LA subjects
OPLS-DA analysis showed that obese subjects were separated from lean asthmatics (Fig. 1). Description in full was included in the Results section in this article's supplement. The differential metabolites in induced sputum, serum and PBMCs between obese asthmatic and lean asthmatic subjects are listed in Table 3. As depicted in the heat map (Fig. 2), it indicated that, in induced sputum, there were significantly increased metabolites such as benzoic acid, 3-hydroxybutyric acid, hydrocinnamic acid, aspartic acid 2, xanthine, 4-aminobutyric acid 1, glutaric acid, gly-pro, d-glucoheptose 1, gluconic lactone 2, L-glutamic acid, phytosphingosine 2, beta-glutamic acid 1, pyrrole-2-carboxylic acid, pyrophosphate 3 and 3-aminopropionitrile 1, and reduced metabolites as indole-3-acetic acid and shikimic acid in subjects compared with lean asthmatic subjects. The most significant differential metabolites identified in sputum samples were further annotated on online database of KEGG (Fig. 3) with higher expression metabolites highlighted by red dots and lower expression labeled by blue dots. For the metabolic profile in serum, it showed an increase in valine, uric acid, N-Methy-DL-alanine and beta-glycerophosphoric acid, and a decrease in asparagine 1 and d-glyceric acid in subjects compared with lean asthmatic subjects, which was indicated in the heat map (Supplementary Fig. S1A). Meanwhile, PBMCs samples had an increase in 3-hydroxynorvaline 2 and a decrease in 3-hydroxybutyric acid, linolenic acid, isoleucine in the obese asthmatic patients comprised with lean asthmatic subjects (Supplementary Fig. S1B). Predictive accuracy of obese asthma and lean asthma using differential metabolites were assessed by calculating the areas under the receiver operating characteristic (ROC) curves for OPLS-DA model in SIMCA. The criterion parameter (YPredPS) retrieved from the current predictionset was used for thresholding and the ROC curve was created by plotting the true positive rate (TPR) versus the false positive rate {FPR = 1 − True Negative Rate (TNR)} at various threshold settings of the criterion parameter (YPredPS). In other words, the ROC curve visualizes the classifier's Sensitivity versus 1 − Specificity. Each point on the ROC curve represents a pair sensitivity/specificity values corresponding to a particular decision threshold. As results shown in Fig. 4, the predictive regression models for obese asthma using differential metabolites indicated an excellent accuracy for both induced sputum and PBMC with the area under the curve (AUC) of 0.966 and 0.916, respectively.
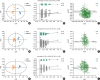 | Fig. 1OPLS-DA of metabolic profiles on samples from obese and lean asthmatic patients. (A, D and G) Score plot of OPLS-DA model obtained from OA and LA in sputum, serum and PBMCs samples retrospectively; The labels t[1] and t[2] along the axes represent the scores (the first 2 partial least-squares components) of the model, which are sufficient to build a satisfactory classification model. (B, E, H) Permutation Test of the OPLS-DA model obtained from OA and LA in sputum, serum and PBMCs samples retrospectively; Two hundred permutations were performed, and the resulting R2 and Q2 values were plotted. Green circle: R2; blue square: Q2. The green line represents the regression line for R2 and the blue line for Q2. (C, F, I) Loading plot of OPLS-DA model obtained from OA and LA in sputum, serum and PBMCs samples retrospectively; The pq[1] and pq[2] values refer to the weight that combines the X and Y loadings (p and q).OPLS-DA, orthogonal projections to latent structures-discriminate analysis; OA, obese asthma; LA, lean asthma; PBMC, peripheral blood monocular cell.
|
Table 3
Identification of differentially expressed metabolites in different samples
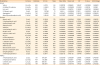
R.T., retention time; OA, obese asthma; LA, lean asthma; VIP, variable importance projection; PBMC, peripheral blood monocular cell.
![]()
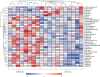 | Fig. 2Heatmap of identified differential metabolites in sputum samples between obese and lean asthmatic patients. Red squares indicate increased expression in OA, white squares indicate no significant change, and blue squares indicate decreased expression in OA.OA, obese asthma.
|
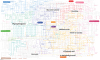 | Fig. 3The KEGG pathway of sputum samples with red/blue dots representing the differentially expressed compounds between obese and lean asthmatic patients. Higher expression was highlighted by red dots and lower expression was labeled by blue dots.KEGG, Kyoto Encyclopedia of Genes and Genomes.
|
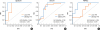 | Fig. 4The ROC curves of obese and lean asthma groups using an OPLS-DA model in sputum (A), serum (B) and PBMCs (C).ROC, receiver operating characteristic; OPLS-DA, orthogonal projections to latent structures-discriminate analysis; PBMC, peripheral blood monocular cell; TPR, true positive rate; FPR, false positive rate; AUC, area under the curve.
|
Pathway topology analysis
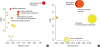
To analyze the most relevant pathways after identifying differential metabolites, the metabolic pathway topology enrichment analysis was applied with the impact value, and −log(p) were calculated to evaluate the importance of the pathways underlying the pathophysiology mechanism in obese asthma. As a result, the pathway topology analysis for induced sputum indicated 14 potentially metabolic pathways involved in the development of obese asthma (Fig. 5A), the most important of which were cyanoamino acid metabolism (P = 1.8 × 10⁻³; impact: 0.333), caffeine metabolism (P = 3.3 × 10⁻³; impact: 0.031), alanine, aspartate and glutamate metabolism (P = 4.5 × 10⁻³; impact: 0.103), phenylalanine, tyrosine and tryptophan biosynthesis (P = 5.8 × 10⁻³; impact: 0.098), pentose phosphate pathway (P = 8.4 × 10⁻³; impact: 0.043). For serum samples, 5 pathways were identified (Fig. 5B), 3 of which with the pathway impact higher than 0.01 were glyoxylate and dicarboxylate metabolism (P = 1.6 × 10⁻³; impact: 0.033), glycerolipid metabolism (P = 6.0 × 10⁻⁴; impact: 0.021) and pentose phosphate pathway (P = 6.0 × 10⁻⁴; impact: 0.022). Unfortunately, we did not uncover any divergent metabolic pathways in PBMCs samples between obese asthmatic and lean asthmatic subjects as most of the differential metabolites identified could not match corresponding metabolites in KEGG database.
Validations of obesity-associated differential metabolites
Obesity-associated differential metabolites were validated using the confirmation of relationship between these differential metabolites and anthropometrical parameters and biomarkers (Leptin and adiponectin) of obesity (Fig. 6 and Supplementary Table S1). As a result, it indicated that most of identified metabolites significantly correlated to anthropometrical parameters and biomarkers of obesity. The relationships between anthropometrical parameters of obesity and differential metabolites were fully described in the “Results” section in this article's supplement.
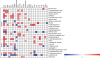 | Fig. 6Heatmap of correlation between differential metabolites and obesity, clinical and inflammation profiles in all subjects. Blue squares indicate significant negative correlations, white squares indicate non-significant correlations, and red squares indicate significant positive correlations.PBMC, peripheral blood monocular cell; BMI, body mass index; FFM, fat free mass; PBF, percent body fat; VFA, visceral fat area; WHR, waist-to-hip ratio; FEV1, forced expiratory volume in 1 second; FVC, forced vital capacity; ACT, Asthma Control Test; AQLQ, Asthma Quality of Life Questionnaire; IL, interleukin; TNF, tumor necrosis factor; CRP, C-reactive protein.
|
Correlations of differential metabolites with clinical and inflammatory profiles
We further explored whether there were significant correlations of differential metabolic profiling with clinical characteristics in all subjects with asthma (Fig. 6 and Supplementary Table S2). Interestingly, it found some differential metabolites such as aspartic acid 2, beta-glutamic acid 1, pyrrole-2-carboxylic acid, 4-aminobutyric acid 1, gluconic lactone 2 in induced sputum positively correlated to FEV1% and FEV1/FVC% reflecting airway obstruction (r < 0.45, P < 0.05). However, no differential metabolites in serum and PBMCs were statistically related with FEV1% or FEV1/FVC% except for isoleucine in PBMCs that positively correlated to FVC% (r = 0.37; P = 0.046). In induced sputum, phytosphingosine 2 had a liner correlation to ACT score (r = −0.508; P = 0.028) and glutaric acid was related with AQLQ score (r = 0.507; P = 0.027) when ACT and AQLQ were transformed into normal distribution parameter.
Asthma was well characterized by airway inflammation. Therefore, we observed relationships of differential metabolites with airway inflammation (Fig. 6 and Supplementary Table S3). Firstly, it was found that d-glucopheptose 1 was associated with the percentage of neutrophils in induced sputum (r = 0.536; P = 0.040). Secondly, it was indicated that differential metabolites in induced sputum were significantly related with airway inflammatory biomarkers. In terms of TH2high cytokines, the IL-4 level was inversely associated with shikimic acid (r = −0.598; P = 0.024), meanwhile IL-5 positively correlated to gly-pro (r = 0.651; P = 0.012) and IL-13 level to 3-hygroxybutyric acid (r = 0.593; P = 0.025). We also found that IL-1β levels correlated to d-glucoheptose 1 (r = 0.58; P = 0.029) and pyrophosphate 3 (r = 0.54; P = 0.047), and TNF-α levels to pyrophosphate 3 (r = 0.60; P = 0.024), and IL-8 levels to pyrophosphate 3 (r = 0.60; P = 0.023) and 3-aminopropionitrile 1 (r = 0.55; P = 0.04). Thirdly, for serum differential metabolites, it indicated d-glyceric acid was related with IL-13 (r = −0.48; P = 0.026), N-Methyl-DL-alanine with IL-1β (r = 0.52; P = 0.014), uric acid with IL-6 (r = 0.47; P = 0.026) and IL-8 (r = 0.48; P = 0.024). Fourthly, for differential metabolites in PBMCs, 3-Hydroxynorvaline 2 was related with IL-13 (r = −0.47; P = 0.048), 3-hydroxybutyric acid with IL-1β (r = −0.50; P = 0.036), and linolenic acid with IL-4 (r = −0.62; P = 0.006), IL-13 (r = −0.52; P = 0.027), and IL-1β (r = −0.51; P = 0.032).
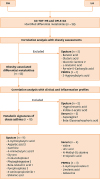
Finally, we screened 18 potential metabolic signatures of obese asthma (Fig. 7). The differential metabolites from subjects with obese and lean asthma identified in OPLS-DA analysis were first validated, and their relationships with obesity assessments (BMI, fat, FFM, PBF, VFA, WHR, leptin or adiponectin) by correlation analysis were in 22 metabolites. Then, we further validated the 22 obesity-associated metabolites in relation to clinical and inflammation profiles of asthma by correlation analysis. Finally, there were 18 metabolic signatures associated both with obesity and asthma, which were pyrophosphate 3, d-glucoheptose 1, shikimic acid, aspartic acid, beta-glutamic acid 1, 4-aminobutyric acid 1, phytosphingosine 2, xanthine, 3-aminopropionitrile 1, 3-hydroxybutyric acid, gly-pro in sputum (n = 11), and valine, uric acid, d-glyceric acid, N-Methyl-DL-alanine in serum (n = 4), and linolenic acid, 3-hydroxynorvaline 2, isoleucine in PBMCs samples (n = 3).
DISCUSSION
To the best of our knowledge, this is the first study to explore the relationship of obesity-associated metabolic signatures in induced sputum and peripheral blood with clinical and inflammatory profiles of obese asthma. As a result, our study showed that obese asthmatic subjects were characterized by worse asthma control and more systemic/airway inflammation, and metabolic profiles of obese asthma differentiated from lean asthma identifying 28 significantly regulated metabolites in obese asthma based on GC-TOF-MS in induced sputum, serum and PBMCs samples. Furthermore, validation analysis revealed 18 potential metabolic signatures of obese asthma, which significantly correlated to clinical and inflammatory profiles. Meanwhile, pathway topology analysis uncovered 8 most probable pathways involved in the development of obese asthma. Our findings indicated novel immunometabolic mechanisms in obese asthma, with providing more phenotypic and therapeutic implications.
Until now, most metabolomics studies focused on distinguishing asthma cases from healthy controls using serum, urine or breath, mainly for diagnostic purposes.17 There is a lack of studies investigating metabolic alterations directly in asthmatic lungs, which potentially generates unique perspectives for understanding disease mechanisms. Metabolomics analysis of BALF can provide an in-depth understanding of altered lung metabolism in experimental asthma and elucidate unique disease-relevant metabolite profiles.34 It is reasonable to use induced sputum samples as a typical bio-specimen with a complex mixture of cells, and large and small molecules for metabolic study, which is more advantageous to explore the underlining inflammation mechanism. In this study, we also investigated the metabolic changes of PBMCs for the first time, which is suggestive of systemic inflammation response in obesity and asthma. Unfortunately, no significantly differential pathways but only a few metabolites identified in PBMCs cell culture samples were identified. Several challenges such as quenching of cell cultures, differential rates of proliferation and addition of foreign molecules perhaps impede the accurate and informative investigation of metabolic alterations in PBMCs cell culture.
In terms of clinical characteristics, ACT scores were decreased in obese versus lean individuals, as confirmed in previous observations.35 Furthermore, a possible mechanism concerns systemic inflammation explaining the link between obesity and asthma36 is also found in our study as obese asthmatic patients had higher leptin and lower adiponectin levels in serum. Likewise, the biomarker of pro-inflammatory event (IL-1β) in sputum supernatant was significantly increased in asthmatic subjects with obesity compared with lean ones. This is in line with results of Kim et al.,19 who presented that obesity-associated asthma is facilitated by inflammation mediated by NLRP3, IL-1β and ILC3 cells. Other type 1 inflammatory mediators like IL-6, IL-8 and TNF-α were comparable between obese and lean asthma, which is also similar with the results from Sideleva et al.37 Interestingly, it was observed that type 2 cytokines such as IL-4 and IL-13 were elevated in obese patients. In fact, there are only a few studies investigating type 2 cytokines in obese asthma which also suggest an increased TH2 responses in obese asthmatic patients.38 Our previous study has further demonstrated that IL-4 and IL-13 mediated the effects of obesity on asthma control.39 Based on recently published studies, raised type 2 cytokines would play a unique protective role by limiting adipose tissue inflammation and obesity, which has been proved by Darkhal et al.40 that the overexpression of the IL-13 gene in high-fat diet (HFD)-fed mice inhibits adipose tissue inflammation and blocks HFD-induced obesity. However, the protecting mediators in the obese would perhaps worsen asthma control.
This study has produced promising results in defining a distinct obese asthma metabotype, which is in line with a previous study of nuclear magnetic resonance-based metabolic profiling of obese asthmatics on EBC.16 The clear separation between obese and lean asthmatic subjects in 3 different samples' metabolic profiles, strongly suggests that they represent somewhat pathophysiological processes for obese asthma. The identified differential metabolites in this study such as pyrophosphate, shikimic acid, aspartic acid, glutamic acid, 4-aminobutyric acid, phytosphingosine, xanthine, uric acid, asparagine, valine, alanine, linolenic acid and isoleucine as well as corresponding metabolic pathways are also confirmed in other studies in asthma.17 Notably, those identified differential metabolites in OPLS-DA between obese and lean asthmatic patients, have been further validated by correlation analysis with obesity, clinical profiles and inflammation biomarkers, which are suggestive of metabolic signatures of obese asthma.
Among those differential metabolites relevant to obesity, uric acid was found to be not only positively correlated to leptin level in serum, but also related with IL-6 and IL-8 in sputum supernatant, which has been confirmed in previous studies that elevated serum uric acid is associated with adipokines41 and systemic inflammatory cytokines.42 Additionally, Kool et al.43 have identified that uric acid is released in airways of allergen-chanllenged asthmatic patients and mice, which play an unexpected role in initiating and amplifying TH2 cell immunity and allergic inflammation in mice. In addition, linolenic was negatively related with IL-4, IL-13, and IL-1β. Our data also supports that dietary intake of linolenic acid are associated with decreased airway inflammation and improved asthma control.44 Thus, diet management of fatty acid deserves attention in asthma, especially patients with obese asthma.
Our study further found the relationships of differential metabolites with clinical profiling. As the results indicated, some metabolic signatures correlated to airway obstruction defined by FEV1% and FEV1/FVC%. For example, aspartic acid, glutamic acid and 4-aminobutyric acid participate in alanine, aspartate and glutamate metabolism, which is associated with glycolysis, gluconeogenesis and the citric acid cycle by transamination to glutamic acid. Our findings suggest that the energy requirement is different in obese asthmatic patients with respect to lean asthmatic patients, which is consistent with the results of the previous study.16 Meanwhile, it has been demonstrated that leptin's antiobesity effects are mediated by synaptic release of gamma-aminobutyric acid (GABA, 4-aminobutyric acid)45 and γ-aminobutyric acid A receptors (GABAARs) agonists acutely relax airway smooth muscle and alleviate bronchoconstriction.46 Consequently, GABA plays an important protective role both in obesity and asthma which may lead to new therapeutic strategies for the management of obese asthma. We also found that phytosphingosine had a negative liner correlation to ACT score, suggests elevated phytosphingosine in obese asthma would worsen asthma control, which requires more evidence to better understand underlying mechanisms, even although a recent study provides evidence that phytosphingosine has potential relevance in the pathogenesis of experimental asthma.47
Moreover, the identified metabolic signatures are proved to participate in the most important pathway involved in obese asthma based on topology analysis. Other than the pathways discussed previously, it is worth note that the glyoxylate and dicarboxylate metabolism has also been reported in the previous study16 as one of the most probable pathways involved in class separation between lean and obese asthmatic patients. Although glyoxylate and dicarboxylate metabolism has been related with mitochondrial dysfunction that would result in decreased ability to detoxify reactive oxygen species in aged female subjects.48 the related metabolic enzymes and genes that correlated the metabolic perturbations require further investigation to illustrate in obese asthma.
Interestingly, the pentose phosphate pathway has been identified in both sputum and serum samples, which is an important metabolic pathway parallel to glycolysis. It generates nicotinamide adenine dinucleotide phosphate and pentoses (5-carbon sugars) as well as ribose 5-phosphate, and the first one in the cell is to prevent oxidative stress. However, overexpression of glucose-6-phosphate dehydrogenase, a rate-limiting enzyme of the pentose phosphate pathway, promotes oxidative stress and expression of pro-inflammatory cytokines in macrophages, which induce insulin resistance in adipocyte.49 Our findings have suggested that anomalous pentose phosphate pathway perturbations in obese conditions might deteriorate energy homeostasis and oxidative stress, thereby accelerating inflammation in obese asthma.
Our study has several limitations that need to be addressed. First, the results need further replication and validation as the sample size in our study is limited and it is not well matched demographically (e.g., sex, smoking, and medication), even though there were no significant differences in baseline characteristics between the groups. Secondly, because of the cross-section study design, it cannot establish a causal relationship but rather an association. Thirdly, lack of validation of the identified metabolites in an additional population set as well as lack of healthy controls and obese subjects without asthma limits the interpretation of the differential metabolites in relation to asthma pathophysiology, while our validation analysis by exploring the relationships of differential metabolites with obesity assessments and clinical or inflammation profiles of asthma would strengthen the results.50 Fourthly, as for the libraries and unavailability of reference standards, some of the detected metabolites are unidentified, which somewhat limits the exploring of the potential metabolic signature.
In conclusion, obese asthma shows worse asthma control, and systemic and airway inflammation, and metabolic analysis indicates that obese asthma is characterized by a different metabolic profile from lean asthma. Obesity-associated metabolic signatures in induced sputum and peripheral blood correlated to clinical and inflammatory profiles of asthma, which indicates novel immunometabolic mechanisms in obese asthma, with providing more phenotypic and therapeutic implications, but needs further replication and validation.
 XML Download