

 PDF
PDF ePub
ePub Citation
 Print
Print


Ha-Na Kang1, Hey Suk Yun1, Young-Jin Choi1, Jae-Won Oh1 , Ui-Young Min2, Yoon-Sook Heo2, Young-Seop Lee2, Mijin Kim3, Kyu Rang Kim3, Baek-Jo Kim3
, Ui-Young Min2, Yoon-Sook Heo2, Young-Seop Lee2, Mijin Kim3, Kyu Rang Kim3, Baek-Jo Kim3
Abstract
Purpose
This study focused on the evaluation of the relation between pollen concentration and the outbreak of allergic disease (symptom index), and this outcome would be necessary to upgrade risk grade for the pollen forecasting system.
Methods
Airborne particles carrying allergens, such as pollen, were collected daily at the Seoul and Guri area by using 7-day Burkard samplers for 6 years. A total of 596 Subjects were recruited from Hanyang University Seoul Hospital (n=144 for spring, n=139 for autumn), and Hanyang University Guri Hospital (n=157 for spring, n=156 for autumn). Symptom index was evaluated and recorded by phone calling to study subjects daily or asking questionnaire when they visit outpatient clinic every week. Statistical analysis of data was performed by using correlation coefficients and regression models with time series graph.
Results
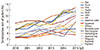
Two peak seasons of pollen concentration were May and September in Korea. In skin prick tests, the sensitization rate to ragweed pollen was gradually increased in children. In the same period, sensitization rates to airborne pollen, especially oak, birch for spring, and Japanese hop for autumn were increased annually. There was a significantly relationship between symptom index of allergic patients and allergic pollen concentrations in this study. Especially symptom index was significantly correlated to the concentration of oak pollen of day 1 in spring and to the concentration of Japanese hop pollen of day 0 in autumn.
Figures and Tables
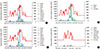 | Fig. 2The correlation between allergic pollen count and symptom (Sx) index in Seoul (1. March to 15. November 2013). (A) Allergic pollen of tree, (B) pine pollen, (C) pollen of allergic plants except pine, and (D) allergic pollen of weeds.
|
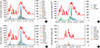 | Fig. 3The correlation between allergic pollen count and symptom (Sx) index in Guri (1. March to 15. November 2013). (A) Allergic pollen of tree, (B) pine pollen, (C) pollen of allergic plants except pine, and (D) allergic pollen of weeds.
|
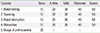
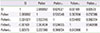
Table 1
The contents of questionnaire to patients (symptom index)
![]()
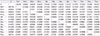
Table 2
Correlation coefficient between total spring pollen and symptom index (SI)
![]()
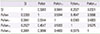
Table 3
Correlation coefficient between spring pollen and symptom index (SI)
![]()
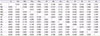
Table 4
Correlation coefficient between total fall pollen and symptom index (SI)
![]()
Table 5
Correlation coefficient between fall pollen and symptom index (SI)
![]()
References
1. Asher MI, Montefort S, Björkstén B, Lai CK, Strachan DP, Weiland SK, et al. Worldwide time trends in the prevalence of symptoms of asthma, allergic rhinoconjunctivitis, and eczema in childhood: ISAAC Phases One and Three repeat multicountry cross-sectional surveys. Lancet. 2006; 368:733–743.

2. Hwang SH, Jung SY, Lim DH, Son BK, Kim JH, Yang JM, et al. Epidemiology of allergic rhinitis in Korean children. Allergy Asthma Respir Dis. 2013; 1:321–332.
3. Beggs PJ. Impacts of climate change on aeroallergens: past and future. Clin Exp Allergy. 2004; 34:1507–1513.
4. Smith M, Emberlin J. A 30-day-ahead forecast model for grass pollen in north London, United Kingdom. Int J Biometeorol. 2006; 50:233–242.
5. Vázquez LM, Galán C, Domínguez-Vilches E. Influence of meteorological parameters on Olea pollen concentrations in Córdoba (south-western Spain). Int J Biometeorol. 2003; 48:83–90.
6. Kim JH, Oh JW, Lee HB, Kim SW, Chung HL, Kook MH, et al. Evaluation of the association of vegetation of allergenic plants and pollinosis with meteorological changes. Allergy Asthma Respir Dis. 2014; 2:48–58.
7. Oh YC, Kim HA, Kang IJ, Cheong JT, Kim SW, Kook MH, et al. Evaluation of the Relationship between Pollen Count and the Outbreak of Allergic Diseases. Pediatr Allergy Respir Dis. 2009; 19:354–364.
8. Oh JW, Lee HB, Kang IJ, Kim SW, Park KS, Kook MH, et al. The revised edition of korean calendar for allergenic pollens. Allergy Asthma Immunol Res. 2012; 4:5–11.
9. Ariano R, Canonica GW, Passalacqua G. Possible role of climate changes in variations in pollen seasons and allergic sensitizations during 27 years. Ann Allergy Asthma Immunol. 2010; 104:215–222.
10. Garcia-Mozo H, Galan C, Jato V, Belmonte J, de la Guardia C, Fernandez D, et al. Quercus pollen season dynamics in the Iberian peninsula: response to meteorological parameters and possible consequences of climate change. Ann Agric Environ Med. 2006; 13:209–224.
11. Teranishi H, Kenda Y, Katoh T, Kasuya M, Oura E, Taira H. Possible role of climate change in the pollen scatter of Japanese cedar Cryptomeria japonica in Japan. Clim Res. 2000; 14:65–70.
12. Kim JH, Oh JW, Lee HB, Kim SW, Kang IJ, Kook MH, et al. Changes in sensitization rate to weed allergens in children with increased weeds pollen counts in Seoul metropolitan area. J Korean Med Sci. 2012; 27:350–355.
13. Ziska LH, Epstein PR, Schlesinger WH. Rising CO(2), climate change, and public health: exploring the links to plant biology. Environ Health Perspect. 2009; 117:155–158.
14. Wayne P, Foster S, Connolly J, Bazzaz F, Epstein P. Production of allergenic pollen by ragweed (Ambrosia artemisiifolia L.) is increased in CO2-enriched atmospheres. Ann Allergy Asthma Immunol. 2002; 88:279–282.
15. Ziska LH, Gebhard DE, Frenz DA, Faulkner S, Singer BD, Straka JG. Cities as harbingers of climate change: common ragweed, urbanization, and public health. J Allergy Clin Immunol. 2003; 111:290–295.
16. Park HJ, Lee JH, Park KH, Kim KR, Han MJ, Choe H, et al. A six-year study on the changes in airborne pollen counts and skin positivity rates in Korea: 2008-2013. Yonsei Med J. 2016; 57:714–720.
17. Adkinson NF Jr, Middleton E Jr. Middleton's allergy principles and practice. 6th ed. Philadelphia: Mosby;2003.
18. Gonzalez-Barcala FJ, Aboal-Viñas J, Aira MJ, Regueira-Méndez C, Valdes-Cuadrado L, Carreira J, et al. Influence of pollen level on hospitalizations for asthma. Arch Environ Occup Health. 2013; 68:66–71.
19. Feo Brito F, Mur Gimeno P, Carnés J, Fernández-Caldas E, Lara P, Alonso AM, et al. Grass pollen, aeroallergens, and clinical symptoms in Ciudad Real, Spain. J Investig Allergol Clin Immunol. 2010; 20:295–302.
20. Annesi-Maesano I, Rouve S, Desqueyroux H, Jankovski R, Klossek JM, Thibaudon M, et al. Grass pollen counts, air pollution levels and allergic rhinitis severity. Int Arch Allergy Immunol. 2012; 158:397–404.
 XML Download