

 PDF
PDF ePub
ePub Citation
 Print
Print


INTRODUCTION
METHODS
Study population
Definition of END
Outcome measures
Measuring blood pressure in both arms and IABDs
Statistical analysis
RESULTS
Demographic characteristics and comparisons of patients with and without END
Table 1
Comparison of clinical characteristics according to presence of END
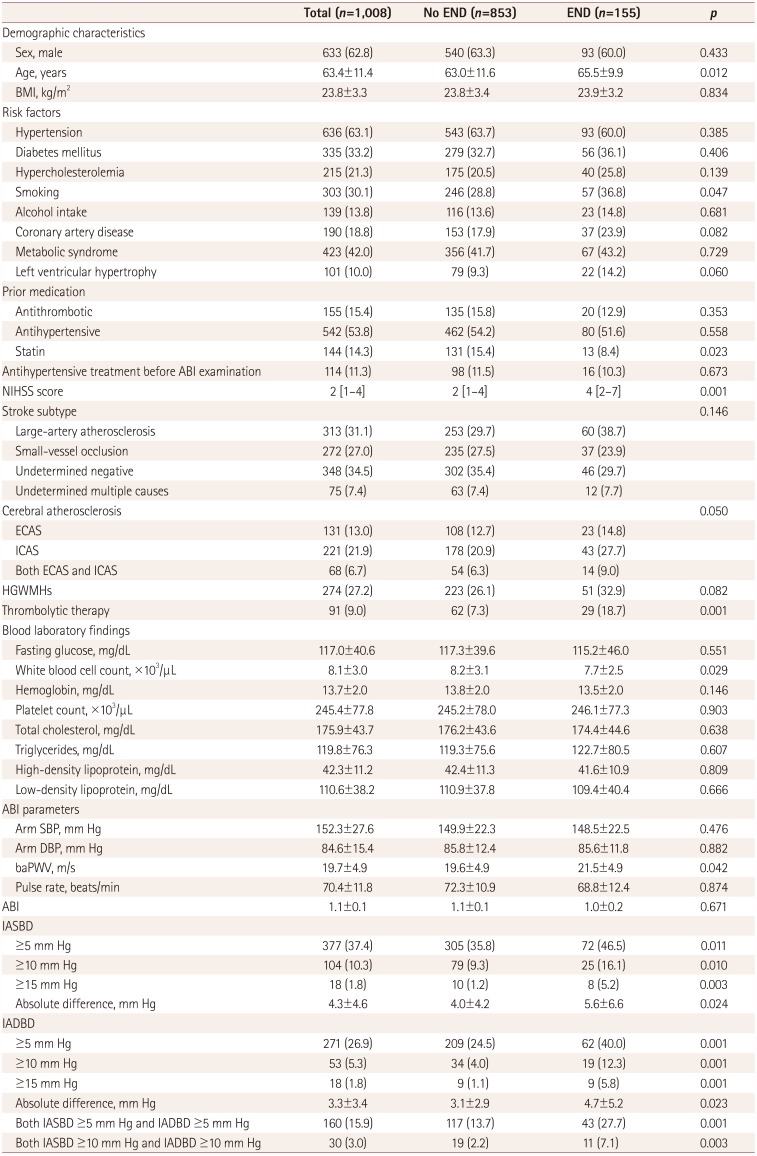
Data are n (%), mean±SD, or median [interquartile range] values.
ABI: ankle-brachial index, baPWV: brachial-ankle pulse wave velocity, BMI: body mass index, DBP: diastolic blood pressure, ECAS: extracranial cerebral atherosclerosis, END: early neurological deteriorat, HGWMHs: high-grade white matter hyperintensities, IADBD: interarm diastolic blood pressure difference, IASBD: interarm systolic blood pressure difference, ICAS: intracranial cerebral atherosclerosis, NIHSS: National Institutes of Health Stroke Scale, SBP: systolic blood pressure.
![]()
Association between IABD and END
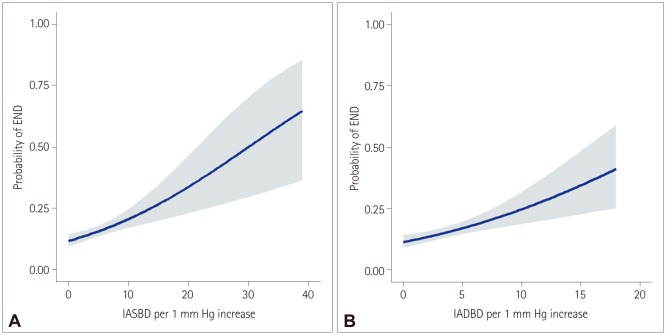
Fig. 1
Relationship between END and the IABD according to the IASBD (A) and the IADBD (B). Blue lines and gray shadows indicate the estimated probabilities and 95% CIs, respectively, for the development of END according to IASBD (A) or IADBD (B) based on the generalized additive model with splines. END: early neurological deterioration, IABD: interarm blood pressure difference, IADBD: interarm difference in the diastolic blood pressure, IASBD: interarm difference in the systolic blood pressure.
![]()
Table 2
Adjusted ORs and CIs of the IABDs for END in multivariate71 logistic regression
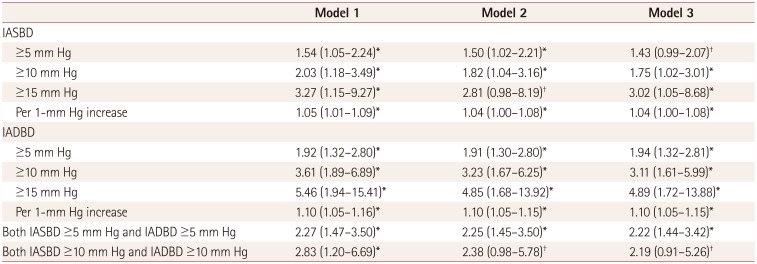
Data are OR (95% CI) values. The ORs of IABPs in model 1 were adjusted sex, age, body mass index, hypertension, diabetes mellitus, hypercholesterolemia, smoking, alcohol intake, coronary artery disease, metabolic syndrome, left ventricular hypertrophy, National Institutes of Health Stroke Scale score, and brachial-ankle pulse wave velocity. In model 2, the ORs of IABPs were adjusted for model 1 plus significant laboratory and imaging factors (white blood cell count, total cholesterol, low-density lipoprotein, thrombolysis, cerebral atherosclerosis, and high-grade white matter hyperintensities). Model 3 included sex, age, and covariates that were significantly associated with END in univariate logistic regression (p<0.1).
*p<0.05, †p<0.1.
END: early neurological deteriorat, IABP: interarm blood pressure difference, OR: odds ratio, IADBD: interarm diastolic blood pressure difference, IASBD: interarm systolic blood pressure difference.
![]()
Association of IABD with END in subgroup populations
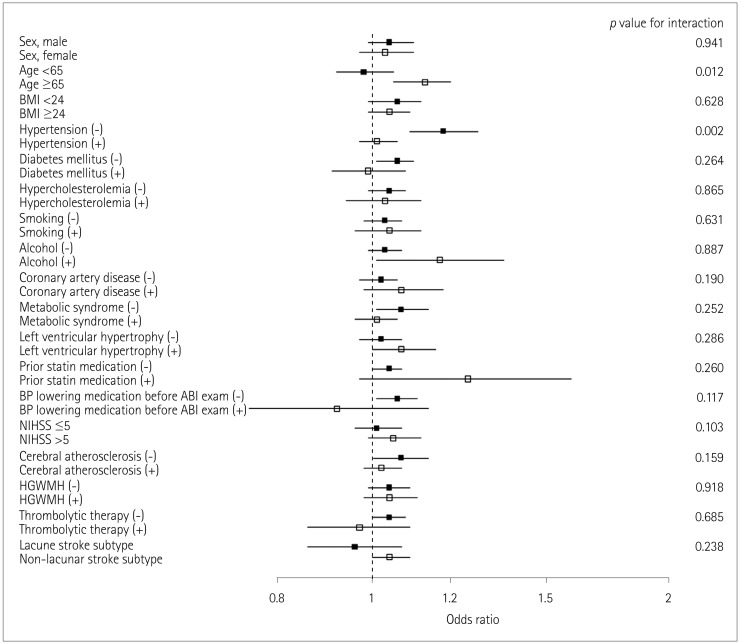
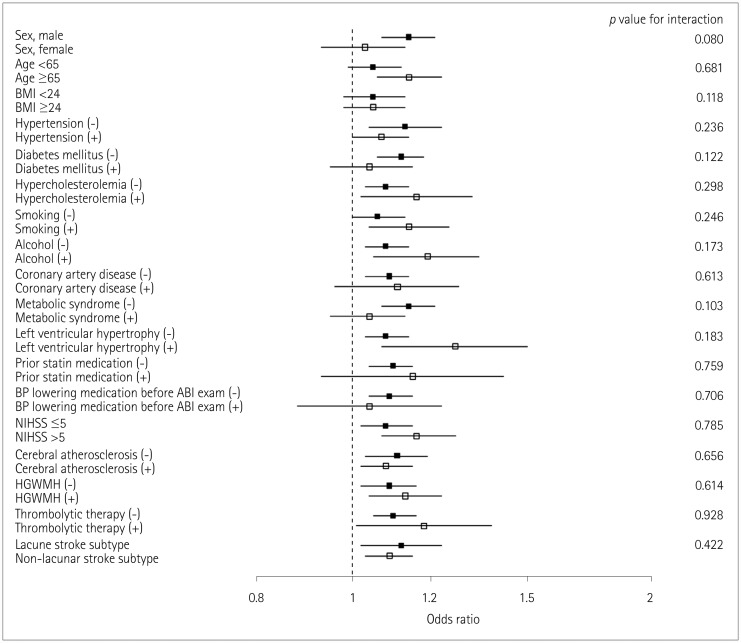
Fig. 2
Association of interarm BP difference with early neurological deterioration according to interarm difference in the systolic blood pressure subgroups. Subgroups were divided according to the median values of continuous or ordinal variables. p values are for interactions between subgroups. ABI: ankle-brachial index, BMI: body mass index, BP: blood pressure, HGWMH: high-grade white-matter hyperintensity, NIHSS: National Instititues of Health Stroke Scale.
![]()
Fig. 3
Association of interarm BP difference with early neurological deterioration according to interarm difference in the diastolic blood pressure subgroups. Subgroups were divided according to the median values of continuous or ordinal variables. p values are for interactions between subgroups. ABI: ankle-brachial index, BMI: body mass index, BP: blood pressure, HGWMH: high-grade white-matter hyperintensity, NIHSS: National Instititues of Health Stroke Scale.
![]()
Association between IABD and stroke outcome
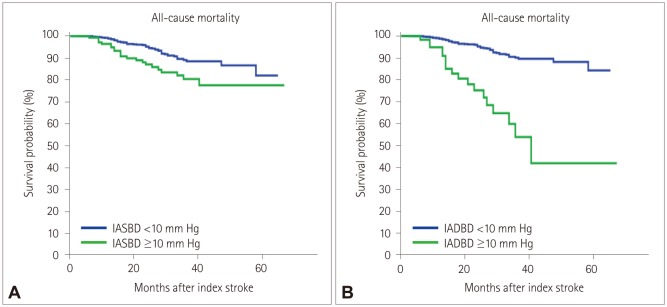
Fig. 4
Kaplan-Meier survival plots of noncardioembolic stroke patients vs. IASBD (A) and IADBD (B). These curves show that the occurrence of all-cause mortality depends on IASBD (p=0.001) (A) and IADBD (p=0.001) (B). IADBD: interarm difference in the diastolic blood pressure, IASBD: interarm difference in the systolic blood pressure.
![]()
Table 3
Results from the multivariate analyses of the functional outcome at 3 months and long-term all-cause mortality after the index stroke according to IASBD and IADBD
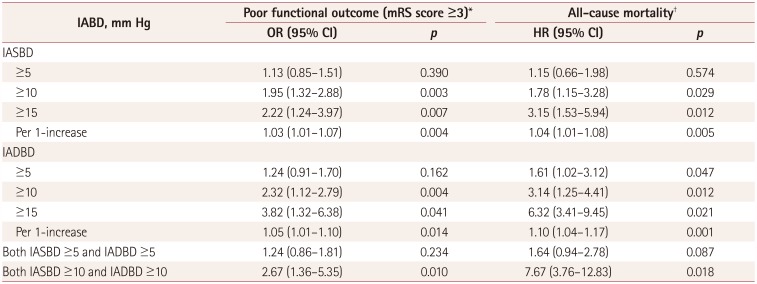
*Adjusted for sex, age, hypertension, metabolic syndrome, thrombolytic therapy, END, NIHSS score, stroke subtype, cerebral atherosclerosis, HGWMHs, and brachial-ankle pulse wave velocity, †Adjusted for sex, age, hypertension, diabetes mellitus, metabolic syndrome, thrombolytic therapy, END, NIHSS score, stroke subtype, cerebral atherosclerosis, HGWMHs, and brachial-ankle pulse wave velocity.
CI: confidence intervals, END: early neurological deterioration, HGWMH: high-grade white-matter hyperintensity, , HR: hazard ratio, IADBD: interarm diastolic blood pressure difference, IASBD: interarm systolic blood pressure difference, mRS: modified Rankin Scale, NIHSS: National Instititues of Health Stroke Scale, OR: odds ratio.
![]()
 XML Download