

 PDF
PDF ePub
ePub Citation
 Print
Print


INTRODUCTION
Parkinson's disease (PD) is a common neurodegenerative disorder characterized by motor symptoms (resting tremor, rigidity, bradykinesia, and postural instability) and nonmotor symptoms (autonomic nerve dysfunction, sleep disorders, pain, and dementia). Most patients will need either temporary or permanent medical-care services during the course of the disease. The progression of PD has a negative effect on the lives of patients themselves and increases the socioeconomic burden.123 From a socioeconomic perspective, it is necessary to understand changes in the epidemiological trends of PD and establish appropriate countermeasures.
Age is an important factor in the development of most brain degenerative diseases, including PD.4 The 2015 Revision of the World Population Prospects has quantified how the number of older persons has increased in most countries and regions, including South Korea, and has projected that this increase will accelerate in coming decades (http://esa.un.org/unpd/wpp).5 In parallel, the number of patients with PD is expected to increase rapidly in the near future.6
While the loss of dopaminergic neurons in the substantia nigra, gliosis, and eosinophilic cytoplasmic inclusion bodies is a key component of the pathology of PD, various etiologies have been proposed for the development of PD, including environmental toxins and endogenous and genetic factors that could potentially result in mitochondrial dysfunction, oxidative stress, protein misfolding, and defective proteolysis.789 Although the risk factors that are significantly associated with PD remain to be confirmed, exposure to well water, pesticides, herbicides, insecticides, industrial chemicals, farming, and living in a rural area have all been implicated as environmental risk factors.1011121314 In contrast, one study found that the incidence of PD was higher in urban than rural areas.15 South Korea has undergone rapid urbanization and industrialization since the middle of the 20th century, and the currently inhomogeneous distribution of industrialization and urbanization within South Korea has produced distinct regional differences in the area of agricultural land and a population concentration in large cities (http://esa.un.org/unpd/wpp).
Based on the changes in the population structure and environment caused by uneven urbanization and industrialization, we hypothesized that the long-term prevalence and incidence of PD in South Korea would be influenced by the aging population and the trends in geographic areas associated with urban or rural environments. We also hypothesized that the age-standardized, hereafter simply described as standardized, prevalence and incidence rates at a specific point in time for a given population structure would enable us to infer the trends regardless of changes in population structure.
To examine our hypotheses, we investigated trends in the crude and standardized prevalence and incidence rates of PD in South Korea using data from the Korean National Health Insurance Service (NHIS) program obtained from 2002 to 2013, and analyzed trends in the standardized prevalence and incidence rates of PD according to geographic characteristics in South Korea during the same period.
METHODS
Data acquisition
The NHIS is a universal health insurance program that offers medical-care coverage to all residents of South Korea (http://nhiss.nhis.or.kr). Almost all Korean residents are registered with the NHIS.
NHIS operates the NHIS sharing service to support policy and academic research using national health information materials. As part of the NHIS sharing service, the NHIS National Sample Cohort (NSC) was constructed based on data from the entire South Korea population in 2002. Researchers can apply for research materials online and use them after receiving approval from the NIHS. The NHIS NSC contains about one million subscribers to the NHIS and the Medical Aid program extracted using stratified sampling methods in 2002 and comprising approximately 2% of all Koreans. A 12-year cohort (2002–2013) of the NSC was tracked in terms of socioeconomic variables (residence location, year and month of death, cause of death, and income level) and medical-treatment details (health examinations, medical-care history, and medical-care institutions). These data enable long-term observations, and can be used to investigate causal relationships. Diseases in the NSC are registered using the sixth edition of the Korean Classification of Disease, which is modified from the International Classification of Disease (ICD-10) for use by the NHIS and medical-care institutions in South Korea.16
We inferred the distribution of a population by region and the area of arable land in South Korea using data from Statistics Korea (http://www.index.go.kr) and the Korean Statistical Information Service (http://www.kosis.kr).
This study had a population-based cohort design and was conducted using the NHIS NSC (NHIS-2017-2-325) and approved by the Institutional Review Board of Kangwon National University Hospital (IRB No. KNUH-2016-02-012-001).
Analysis strategy
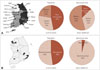
In addition to analyzing the epidemiologic features of PD in South Korea, we analyzed regional differences in the prevalence and incidence of PD by dividing South Korea into three regions based on administrative and geographic characteristics, and into two regions based on the degree of urbanization. The three regions based on administrative and geographic characteristics were metropolitan Seoul (Seoul, Incheon, and Gyeonggi-do), eastern Korea (Busan, Daegu, Ulsan, Gangwon-do, Gyeongsangbuk-do, and Gyeongsangnam-do), and western Korea (Gwangju, Daejeon, Chungcheongbuk-do, Chungcheongnam-do, Jeollabuk-do, Jeollanam-do, and Jeju Special Self-Governing Province). Geographically, metropolitan Seoul is a flat area with the smallest proportion of agricultural land among the three regions, while economically it is industrialized and urbanized. Eastern Korea is a mountain area and comprises a large proportion of agricultural land. Western Korea is a flat area with the largest proportion of agricultural land among the three regions (Fig. 1A).17
In terms of the degree of urbanization, the metropolitan area comprised Seoul, Incheon, Busan, Daegu, Ulsan, Gwangju, and Daejeon, and the nonmetropolitan area comprised Gyeonggi-do, Gangwon-do, Gyeongsangbuk-do, Gyeongsangnam-do, Chungcheongbuk-do, Chungcheongnam-do, Jeollabuk-do, Jeollanam-do, and Jeju Special Self-Governing Province (Fig. 1B). Most metropolitan cities in South Korea contain more than one million people.
The inhomogeneity of urbanization is certainly likely to be affected by geographic characteristics. However, in this study, South Korea was divided into three regions according to administrative and geographic characteristics and into two regions according to the degree of urbanization. Each subscriber in the cohort resided in one of the above regions.
We measured the area of agricultural land in each region in 2002 under the assumption that the area of agricultural land indirectly reflects the degree of exposure to pesticides, herbicides, farming, and rural living.
There were two potential problems with analyzing the NSC from 2002 to 2013. First, some of the subscribers are disqualified over time due to death or emigration, and are replaced by newborn infants. Because this study analyzed patients with PD aged 40 years or older, it is possible that some of the disqualified or replaced subscribers constituted confounding factors when we inferred the prevalence and incidence of PD in South Korea since 2003. Second, the demographic structure of the cohort has changed with the ongoing increases in age and life expectancy. Because PD is a degenerative disease associated with age, the changes in the prevalence and incidence in the cohort over time may be exaggerated compared to the actual rates for South Korea. We applied a standardization method1819 to minimize these cofounding effects, using the population in 2002 as the standard population to calculate the standardized overall prevalence and incidence of PD and that in different geographic and urban/rural regions. We examined whether there were linear trends in the crude and standardized prevalence and incidence rates of PD during the study period.
Inclusion and exclusion criteria
From the NSC data set we selected subscribers who were aged 40 years or older in 2003. A case of PD was defined as a subscriber who took at least one anti-PD drug for more than 3 months within the first year after an initial diagnosis with classification code G20 in the ICD-10 protocol. The anti-PD drugs included L-dopa and L-dopa-modifying drugs, ergot/nonergot dopamine agonists, amantadine, catecholo-methyl transferase inhibitors, anticholinergics, and selegiline. We excluded subscribers with secondary (G21) or atypical (G22 and G23) parkinsonism. We also subdivided the PD patients into younger (aged 40–65 years) and older (aged >65 years) groups.
We were unable to decide whether some of the subjects in 2002 satisfied the inclusion and exclusion criteria, and so we excluded subscribers with ICD-10 classification code G20 registered in 2002 because the time of onset of their disease was unclear (n=223).
Statistical analyses
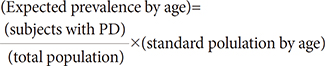
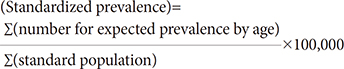
We applied the test of homogeneity to determine whether or not the structure of population differed within each of the two or three regions. The crude prevalence per 100,000 in South Korea overall and within each region was calculated by dividing the number of subjects classified as ICD-10 code G20 in each year by the total number of subjects in that year. The standardized prevalence rate of PD can be used to calculate comparable prevalence rates of PD by year with the following formulas:
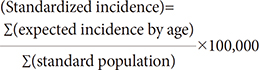
We similarly calculated the crude incidence rate of PD per 100,000 South Koreans and for each of the regions. The standardized incidence of PD corrected for the age structure of the standard population of South Korea and of the regions can be used to calculate comparable incidence rates of PD by year with the following formulas:
Trend analysis was applied to South Korea as a whole and to each region to investigate the trend variation in the prevalence and incidence of PD during the study period. We assumed that the trends in the prevalence and incidence of PD were compatible with a linear model. The Cochran-Armitage trend test was used to determine whether there were significant increasing (or decreasing) linear trends in the prevalence and incidence rates of PD.2021 The statistical analysis was performed using the statistical package SAS for Windows (version 9.4, SAS Institute, Cary, NC, USA).
RESULTS
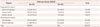
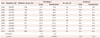
In 2003, the NSC contained 395,097 subjects aged 40 years old or older, of which 306 had newly diagnosed PD (Table 1 and 2). The number of subjects had increased to 495,160 in 2012, with 820 diagnosed as PD (Table 2). As the age of the population in the cohort increased, there were more cases in the cohort that were aged 40 years or older than the number of persons who had been disqualified due to death or immigration. Fig. 1 shows the proportion of the population and areas of agricultural land in the regions based on urbanization and geographic characteristics in 2002. The population structure did not differ significantly between the two urbanization regions or between the three geographic regions in the homogeneity test (p>0.05) (Supplementary Fig. 1 in the online-only Data Supplement).
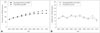
The crude prevalence of PD per 100,000 subjects aged 40 years old or older in South Korea increased gradually from 77.5 in 2003 to 165.6 in 2012, which was the last year of the study. The standardized prevalence of PD also increased from 75.8 to 136.8 during the same period (Fig. 2A). In the trend analysis, both the crude and standardized prevalence rates of PD increased in subjects aged 40 years old or older (p<0.0001) (Table 2). Both the crude and standardized prevalence rates of PD increased faster in the older group than in the younger group (p<0.0001).
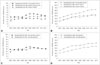
In the region-specific analysis based on administrative and geographic characteristics, the standardized prevalence of PD per 100,000 in 2003 was highest in metropolitan Seoul (younger group=39.7, older group=317.9), followed by western Korea (younger group=30.6, older group=226.7) and eastern Korea (younger group=23.0, older group=185.7). In the trend analysis, the standardized prevalence rates of PD in the three regions increased gradually regardless of group, and their order did not change over the entire observation period (p<0.05) with the exception of the younger group in eastern Korea (Fig. 3A and B). There was a prominent increasing trend in the standardized prevalence of PD in the older group. The standardized prevalence of PD in the older group increased faster in metropolitan Seoul than in western and eastern Korea (p<0.0001).
In the analysis of prevalence based on the degree of urbanization, the standardized prevalence rates of PD per 100,000 in 2003 in the younger and older groups were 37.9 and 311.2, respectively, in metropolitan areas, and 27.4 and 208.8 in nonmetropolitan areas. In the trend analysis, the standardized prevalence rates of PD in the two regions increased gradually for all periods regardless of group (p<0.05) with the exception of the younger group in the metropolitan region (Fig. 3C and D). The increasing trend in the standardized prevalence of PD was especially prominent in the older group, as was also the case in the region-specific analysis.
The crude incidence of PD per 100,000 South Koreans aged 40 years or older was 14.2 in 2003 and 12.1 in 2012; the corresponding standardized rates of PD per 100,000 were 13.9 and 10.3, respectively (Fig. 2B). The rate fluctuated every year from 2003 to 2012, and the trend analysis showed no change in the trends for the crude or standardized incidence (p>0.05) (Table 2).
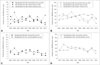
In the regional analysis based on the administrative and geographic characteristics in 2003, the standardized incidence rates of PD per 100,000 in the younger and older groups were 8.2 and 62.4, respectively, in metropolitan Seoul, 2.0 and 40.0 in eastern Korea, and 5.6 and 36.3 in western Korea. There were no significant trends in either group regardless of region for all periods (p>0.05) (Fig. 4A and B). The standardized incidence of PD in the younger group was lower in eastern Korea than in the other two regions, while the standardized incidence in the older group was lower in western Korea than in metropolitan Seoul over almost all of the analyzed periods.
In the analysis according to the degree of urbanization, the standardized incidence rates of PD per 100,000 in 2003 were 6.3 and 48.4 in the younger and older groups, respectively, in metropolitan areas, and 5.0 and 46.5 in nonmetropolitan areas. There was no significant trend in either the metropolitan or nonmetropolitan area (p>0.05) (Fig. 4C and D).
DISCUSSION
We limited the PD patients in this study to those classified as ICD-10 code G20 who had taken anti-PD drugs for at least 3 months, and we used a standardized method to adjust for demographic changes in the cohort over time. To analyze possible environmental influences on the occurrence of PD, we made regional comparisons after dividing South Korea into regions that indirectly reflect urban and rural environments. We were unable to obtain clinical information for the PD patients, such as the Hoehn-Yahr stage or the score on the Unified Parkinson's Disease Rating Scale. Such data are important for the clinical diagnosis of PD and for differentiating PD from other neurodegenerative diseases such as atypical and secondary parkinsonism. Even with a careful diagnostic approach based on a full history and a neurological examination, the diagnostic accuracy of PD reportedly still only reaches 75–90%.2223242526 We therefore defined a patient with PD as one classified as ICD-10 code G20 and who had been taking anti-PD drugs for at least 3 months. Although the finding of no trend in the standardized incidence of PD registered in the NHIS NSC during all observations might imply that the diagnosis accuracy of PD has remained relative constant, there is a risk that the actual number of patients with PD differed from this.
We found that both the crude and standardized prevalence rates of PD in the NSC increased during all observation periods, and there was a tendency for the difference between the crude and standardized prevalence rates of PD to increase over time. These results indicated that the prevalence of PD in the NSC was probably affected by demographic changes associated with the time point of the measurement. The process of age adjustment through standardization can help to reduce any bias in the interpretation of the results. The trends we observed in the standardized prevalence of PD suggest that this involves factors other than the change in population structure resulting from an increasing proportion of elderly in the population. Because the incidence of PD in the NSC was relatively constant over the study period, the change in the life expectancy of PD patients is one possible reason for this; however, we did not evaluate this. Some studies have found that the life expectancy of PD patients was lower than that of the general population,272829 although a recent study found no significant difference in the life expectancy of PD patients who receive regular specialist care using all currently available therapies.30 Our results also suggest that the life expectancy of patients with PD is increasing, in the same that the life expectancy of normal subjects has been increasing in recent decades.5
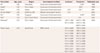
In the analysis by administrative and geographic regions, the standardized prevalence in the younger group was constant over time except in metropolitan Seoul, where it increased from 39.7 per 100,000 in 2003 to 46.4 per 100,000 in 2012. In contrast, the standardized prevalence in the older group increased rapidly in all three regions, with it being approximately twofold higher in 2012 than in 2002. Other studies conducted in South Korea and other Asian countries have obtained different results (Table 3).31323334353637 We believe that methodological differences including in how PD patients are defined, the inclusion and exclusion criteria, and the statistical approaches have contributed to the differences among studies. The time of observation could also be an important factor affecting the measured prevalence of PD given the increasing life expectancy of the normal population.
The effects of urbanization were greater in the older group than in the younger group. We believe that this was due to a change in life expectancy and the relatively constant incidence of PD. A particularly interesting finding was that the standardized prevalence was highest in metropolitan Seoul. The standardized prevalence in the older group was approximately 1.5-fold higher in the metropolitan region than in the nonmetropolitan regions. We found no significant association between agricultural area and the prevalence of PD, despite previous studies finding that rural life is a risk factor for developing PD. It is not clear why the prevalence was higher in urban areas. One possible reason is that the presence of many general hospitals in urban areas increases the opportunity for those living in a metropolitan area to be diagnosed with PD.
We found no significant change in either the crude or standardized incidence of PD in the NSC during the study period, although there was a significant difference between the crude and standardized incidence rates of PD that increased over time. These results demonstrate the need for age adjustment through standardization to reduce bias.
In contrast to our expectations, the standardized incidence of PD in South Korea did not change over the study period. Also, subanalyses of agricultural and urban areas showed no significant trends. This finding of a constant incidence rate of PD differs from previous studies, and the exact reason for our finding is unclear. Because the diagnostic accuracy of PD has been constant for the last 2 decades,2223242526 we assume that the actual incidence of PD in South Korea has also been constant.
There was a tendency for the standardized incidence of PD to differ among the three regions of metropolitan Seoul, eastern Korea, and western Korea. The standardized incidence in the younger group tended to be lower in eastern Korea, while that of the older group tended to be higher in metropolitan Seoul. We postulated that there is an association between the actual incidence of PD and the environment. Another interesting finding is that the standardized incidence of PD varied widely during the entire observational period. One possible explanation is the applied inclusion criteria, such as taking the anti-PD drug for at least 3 months, or a time mismatch between diagnosis and the actual onset of illness. Another explanation could be that the level of environmental risk exposure changed during the time preceding the study period; however, further study is necessary to identify the exact cause.
One limitation of this study is that the subjects in the cohort might have resided in different regions prior to the cohort study, which could have biased the measured occurrence of PD in South Korea. The other limitation is that we could not determine whether any difference in residence location would directly affect the contact with external risk factors.
In conclusion, we have applied age standardization to estimate the actual trends in the prevalence and incidence rates of PD in the NSC by minimizing the impact of changes in population structure. The standardized prevalence of PD increased steadily from 2003 to 2012 in South Korea, while the standardized incidence of PD remained fairly constant. The prevalence and incidence rates of PD differed with the administrative and geographic regions, and with the degree of urbanization.
 XML Download