

 PDF
PDF ePub
ePub Citation
 Print
Print


INTRODUCTION
METHODS
Participants
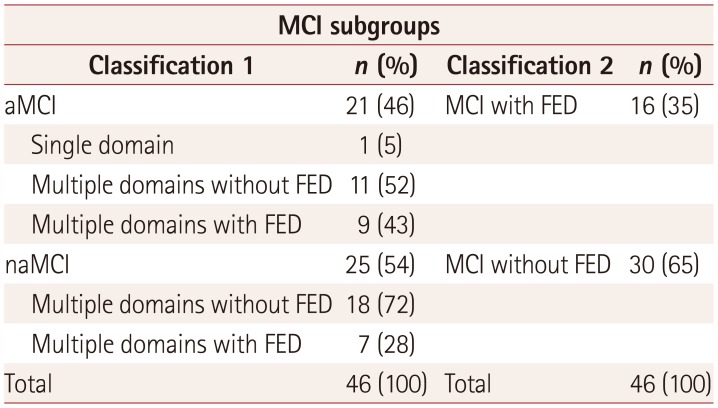
Table 1
Numbers of patients with MCI in the different subgroups
![]()
Table 2
Demographic data and audiometric test results for each group
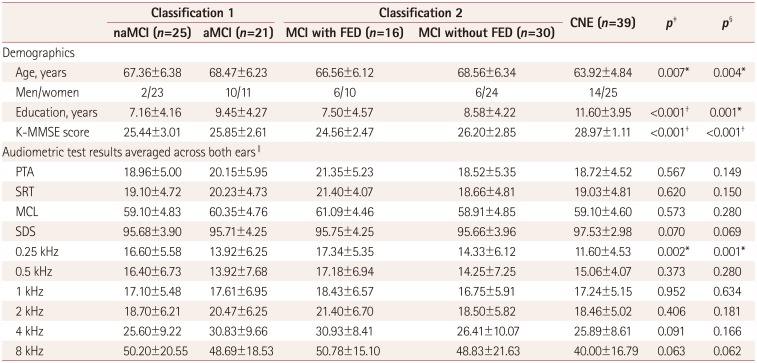
Data are mean±SD values.
*p<0.01, †p<0.001, ‡One-way ANOVA was used to assess differences between the naMCI, aMCI, and CNE groups, §One-way ANOVA was used to assess differences between the MCI with FED, MCI without FED, and CNE groups, ∥Audiometric test results are expressed as dB HL values, except for SDS being expressed as percentages.
aMCI: amnestic mild cognitive impairment, CNE: cognitively normal elderly, FED: frontal-executive dysfunction, K-MMSE: Korean version of the Mini Mental State Examination, MCI: mild cognitive impairment, MCL: most-comfortable loudness level, naMCI: nonamnestic mild cognitive impairment, PTA: pure-tone average, SDS: speech discrimination score, SRT: speech reception threshold.
![]()
Experimental measurements
Audiometric assessments
Neuropsychological assessments
Table 3
Comparisons of neuropsychological test scores between MCI subgroups
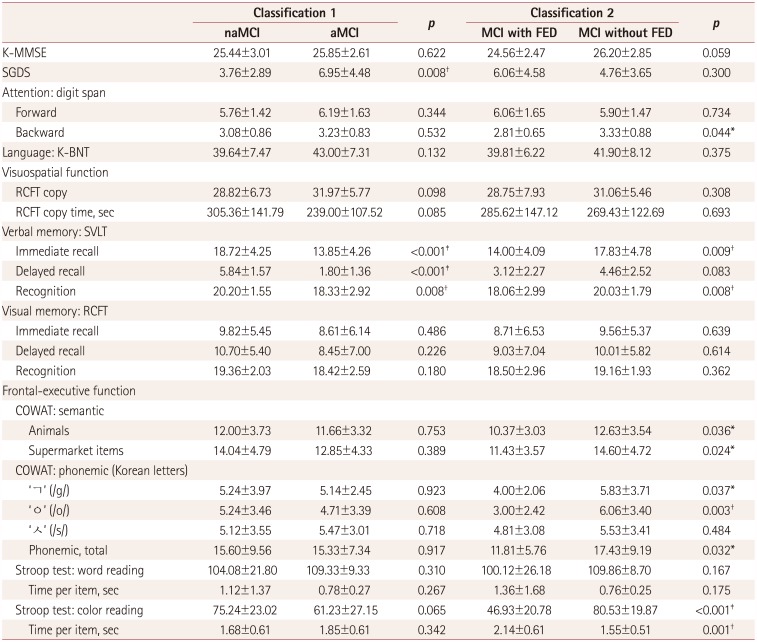
Data are mean±SD values.
*p<0.05, †p<0.01, ‡p<0.001.
aMCI: amnestic mild cognitive impairment, COWAT: Controlled Oral Word Association Test, FED: frontal-executive dysfunction, K-BNT: Korean version of the Boston Naming Test, K-MMSE: Korean version of the Mini Mental State Examination, MCI: mild cognitive impairment, naMCI: nonamnestic mild cognitive impairment, RCFT: Rey Complex Figure Test, SGDS: short version of the Geriatric Depression Scale, SVLT: Seoul Verbal Learning Test.
![]()
Neuropsychological assessments
Stimuli
Procedures
Statistical analysis
RESULTS
Comparisons of sentence recognition scores among the MCI with FED, MCI without FED, and CNE groups
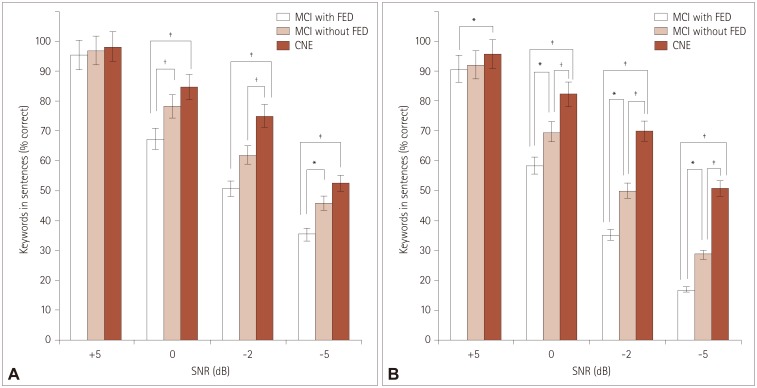 | Fig. 1Percentage of keywords correctly recognized according to SNR for speech-spectrum noise (A) and multitalker-babble noise (B) in the MCI with FED, MCI without FED, and CNE groups. *p<0.05, †p<0.01, ‡p<0.001. CNE: cognitively normal elderly, FED: frontal-executive dysfunction, MCI: mild cognitive impairment, SNR: signal to noise ratio.
|
Comparisons of sentence recognition scores among the naMCI, aMCI, and CNE groups
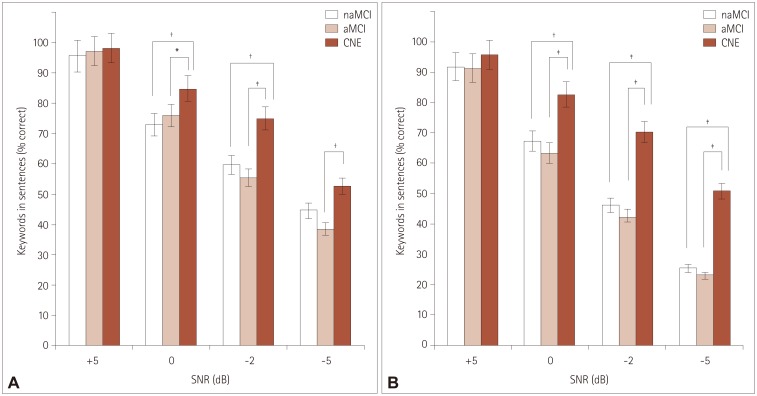 | Fig. 2Percentage of keywords correctly recognized according to SNR for speech-spectrum noise (A) and multitalker-babble noise (B) in the naMCI, aMCI, and CNE groups. *p<0.05, †p<0.01, ‡p<0.001. aMCI: amnestic mild cognitive impairment, CNE: cognitively normal elderly, MCI: mild cognitive impairment, naMCI: nonamnestic mild cognitive impairment, SNR: signal to noise ratio.
|
Comparisons of rates of functional decline in speech perception performance across noise levels between groups
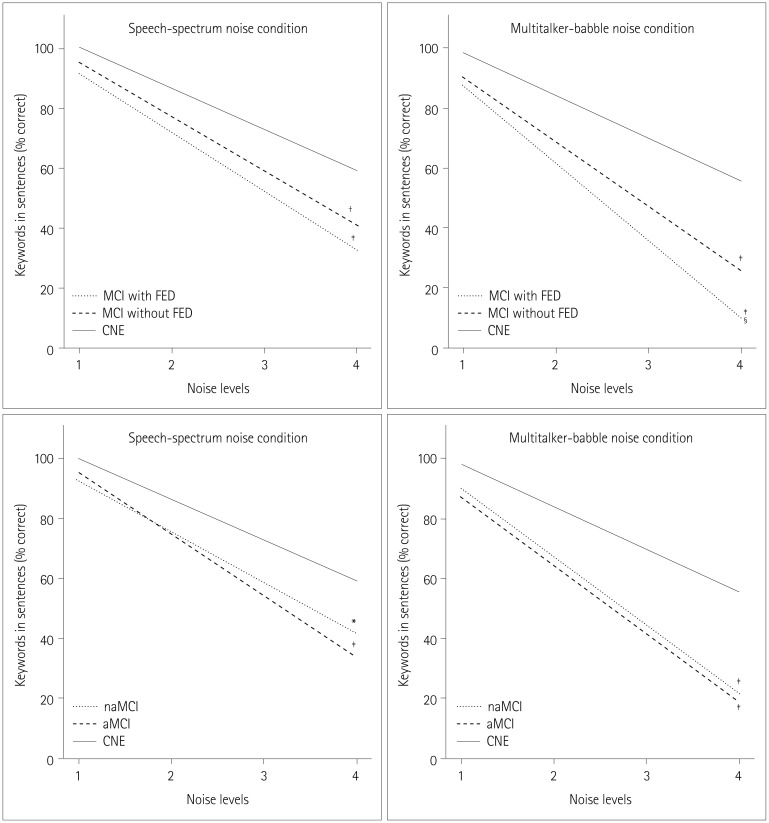 | Fig. 3Differences between groups in the rates of functional decline in speech perception performance across noise levels. Difference in slope: *p<0.05 vs. CNE, †p<0.01 vs. CNE, ‡p<0.001 vs. CNE, §p<0.05 vs. MCI without FED. aMCI: amnestic mild cognitive impairment, CNE: cognitively normal elderly, FED: frontal-executive dysfunction, MCI: mild cognitive impairment, naMCI: nonamnestic mild cognitive impairment.
|
Correlations between sentence recognition scores at an SNR of −5 dB under multitalker-babble noise (the most-difficult listening condition) and neuropsychological test scores for each group
Table 4
Partial correlation coefficients for sentence recognition scores at a signal-to-noise ratio of −5 dB under multitalker-babble noise with neuropsychological test scores adjusted by the pure-tone average in each group
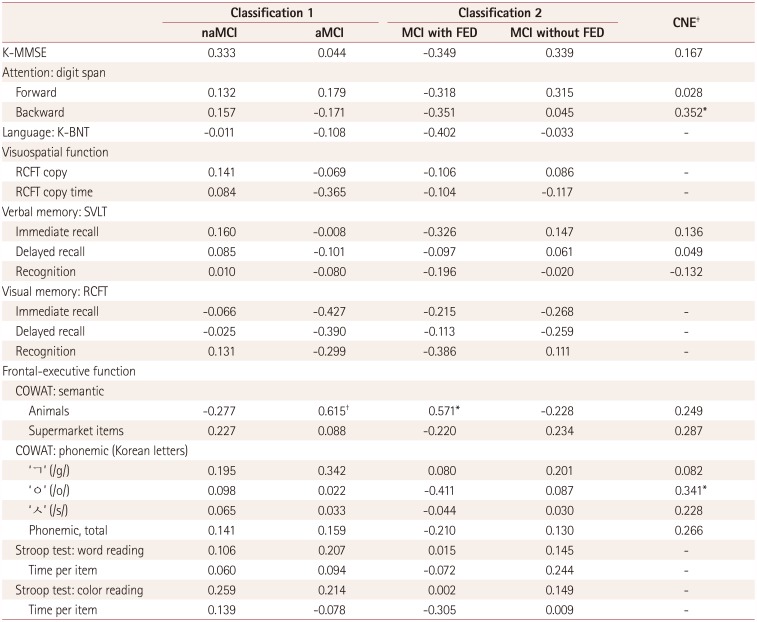
*p<0.05, †p<0.01, ‡Only the K-MMSE, SVLT, COWAT, and digit span tests were applied to the CNE group.
aMCI: amnestic mild cognitive impairment, CNE: cognitively normal elderly, FED: frontal-executive dysfunction, K-BNT: Korean version of the Boston Naming Test, K-MMSE: Korean version of the Mini Mental State Examination, MCI: mild cognitive impairment, naMCI: nonamnestic mild cognitive impairment, RCFT: Rey Complex Figure Test, SVLT: Seoul Verbal Learning Test.
![]()
 XML Download