Abstract
Objectives
Oral-specific measures are often preferred for examining oral disease outcomes; however, generic measures can add additional important information. This study measured oral health-related quality of life, reflecting the multidimensional characteristics of oral health, and we compared sub-dimensions of the Oral Health Impact Profile 14 (OHIP-14) with the EuroQual-5D (EQ-5D).
Methods
Data from 305 patients were collected from patients who visited the dental university hospital in 2016-2017 and included EQ-5D, OHIP-14, and self-rated general/oral health questionnaires. A factor analysis was performed to identify sub-dimensions of the EQ-5D and OHIP-14, and a cluster analysis was conducted to examine the degree of overlap among the sub-dimensions of two measures.
Results
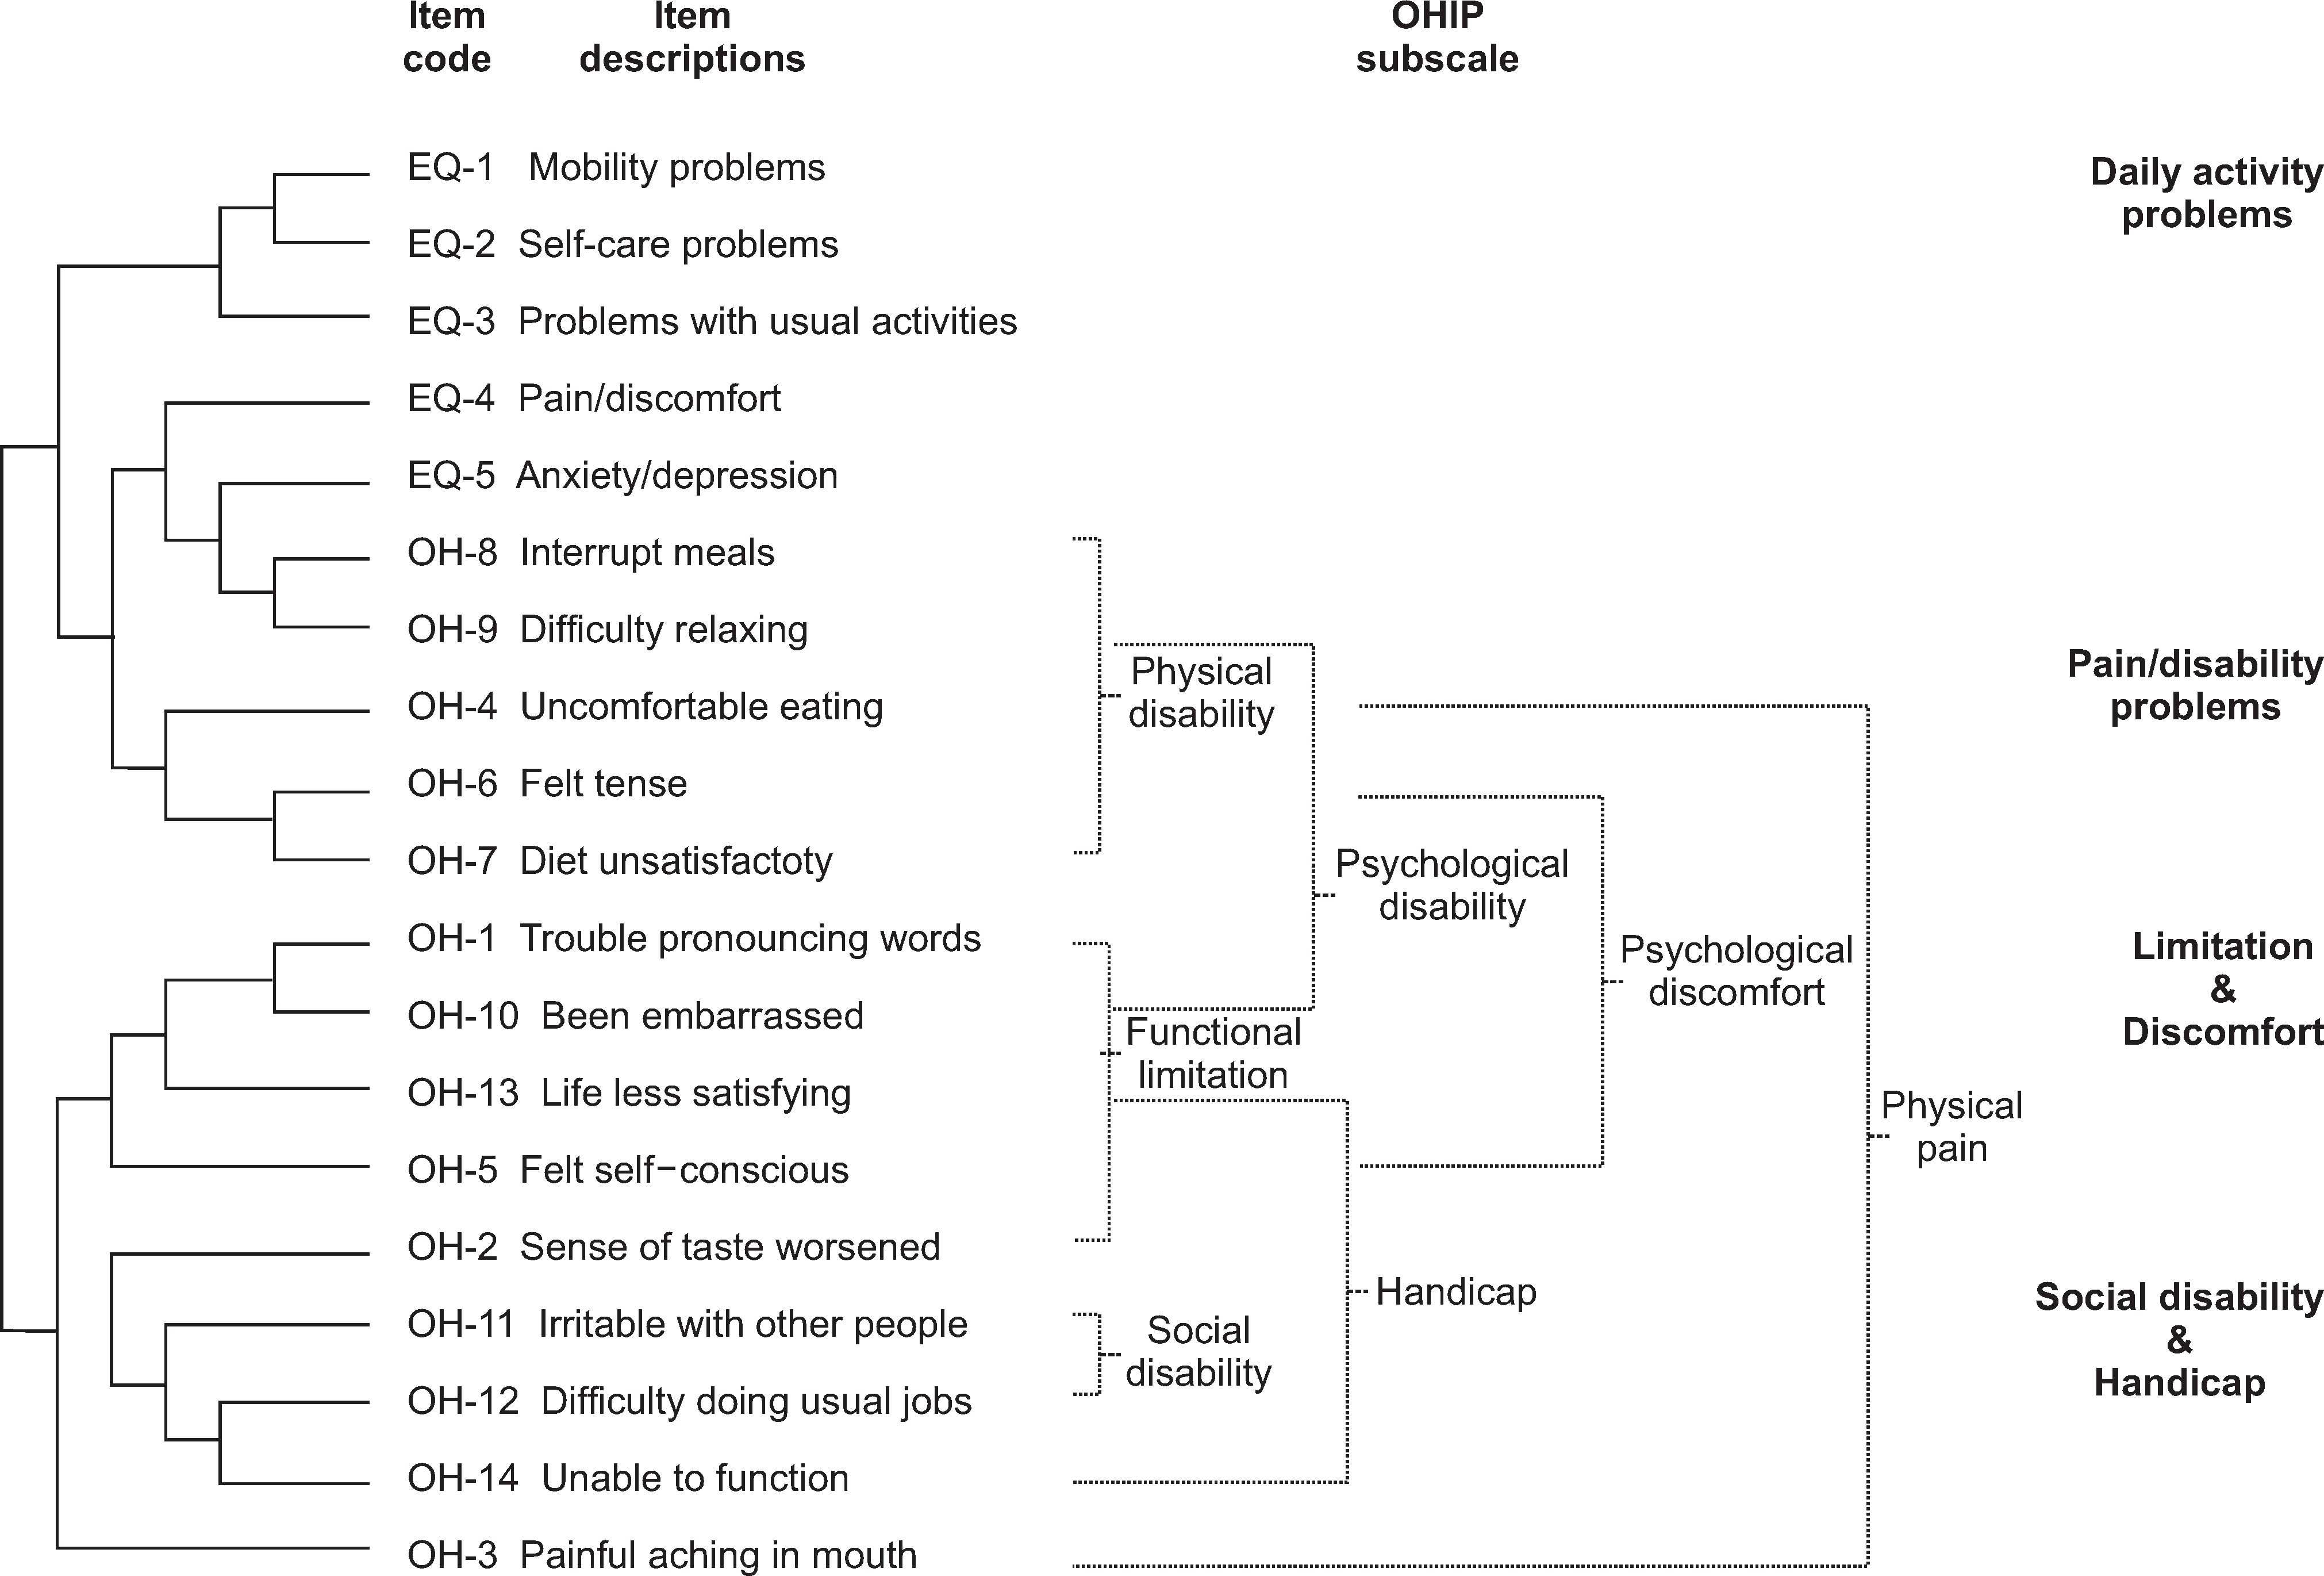
In the factor analysis, a range of OHIP-14 items (physical pain, physical disability, and handicap) loaded on factor 3, along with EQ-5D items. In the analysis of groups with relatively low oral qualities of life, moving from the bottom towards the top of the dendrogram, the next major branch split was the dimension of EQ-5D pain/discomfort, anxiety/depression items, which clustered between the OHIP-14 interrupted meal and difficult relaxing subscales.
References
1. Brennan DS, Spencer AJ. Mapping oral health related quality of life to generic health state values. BMC Health Serv Res. 2006; 6:96. doi:10.1186/1472-6963-6-96.

2. Brennan DS, Spencer AJ. Dimensions of oral health related quality of life measured by EQ-5D+ and OHIP-14. Health Qual Life Outcomes. 2004; 2:35. doi:10.1186/1477-7525-2-35.
4. Eker L, Tüzün EH, Daşkapan A, Baştuǧ ZÖ, Yakut Y. The relationship between EQ-5D and SF-36 instruments in patients with low back pain. Fiz Rehabil. 2007; 18:3–10.
5. Seong SS, Choi CB, Sung YK, Park YW, Lee HS, Uhm WS, et al. Health-Related Quality of Life using EQ-5D in Koreans. J Rheum Dis. 2004; 11:254–262.
6. Oh H. Important significant factors of health-related quality of life(EQ-5D) by age group in Korea based on KNHANES(2014). J korean data Inf Sci Soc. 2017; 28:573–584.
7. Park H, Kim S, Bae S. Current Status of Health-related Quality of Life Research in Korea. J Rheum Dis. 2002; 9:s1–s17.
8. Jo M. The Utility Estimation of EQ-5D-5L Health States. Ulsan. 2011. 1–23.
9. Brazier J, Akehurst R, Brennan A, et al. Should patients have a greater role in valuing health states? Appl Health Econ Health Policy. 2005; 4:201–208. doi:10.2165/00148365-200504040-00002.

10. Slade G, Spencer A. Development and evaluation of oral health impact profile. Community Dent Heal. 1994; 11:3–11.
11. Slade GD. Derivation and validation of a short-form oral health impact profile. Community Dent Oral Epidemiol. 1997; 25:284–290. doi:10.1111/j.1600-0528.1997.tb00941.x.

12. Heydecke G, Locker D, Awad MA, Lund JP, Feine JS. Oral and general health-related quality of life with conventional and implant dentures. Community Dent Oral Epidemiol. 2003; 31:161–168.

13. Kang H. A Guide on the Use of Factor Analysis in the Assessment of Construct Validity. J Korean Ac ad Nurs. 2013; 43:587–594.

14. Lee E. Development and Psychometric Evaluation of a Quality of Life Scale for Korean Patients with Cancer (C-QOL). J Korean A cad Nurs. 2007; 37:324–333.

15. Shin H, Ahn E. Measurement of oral health related with quality of life using EQ-5D and OHIP-14. J Korean Acad Oral Health. 2018; 42:27–33.

16. Fayers PM, Hand DJ. Factor analysis, causal indicators and quality of life. Qual life Res. 1997; 6:139–150. doi:10.1023/A:1026490117121.
17. Choi J, Seo D. Decision trees and its application. J Korean Off Stat. 1999; 4:61–83.
18. Kwak M, Rhee S. Finding factors on employment by adult life cycle using decision tree model. J Korean Data Inf Sci Soc. 2016; 27:1537–1545.

19. Sharma S, Kumar A. Cluster analysis and factor analysis. The Handbook of Marketing Research: Uses, Misuses, and Future Advances. 2006. 365–393.

20. Yong AG, Pearce S. A Beginner’s Guide to Factor Analysis : Focusing on Exploratory Factor Analysis. TQMP. 2013; 9:79–94.
21. Fayers PM, Hand DJ, Bjordal K, Groenvold M. Causal indicators in quality of life research. Qual life Res. 1997; 6:393–406. doi:10.1023/ A:1018491512095.
22. Reedy J, Wirfält E, Flood A, et al. Comparing 3 dietary pattern methods-cluster analysis, factor analysis, and index analysis-with colorectal cancer risk. Am J Epidemiol. 2010; 171:479–487. doi:10.1093/aje/kwp393.
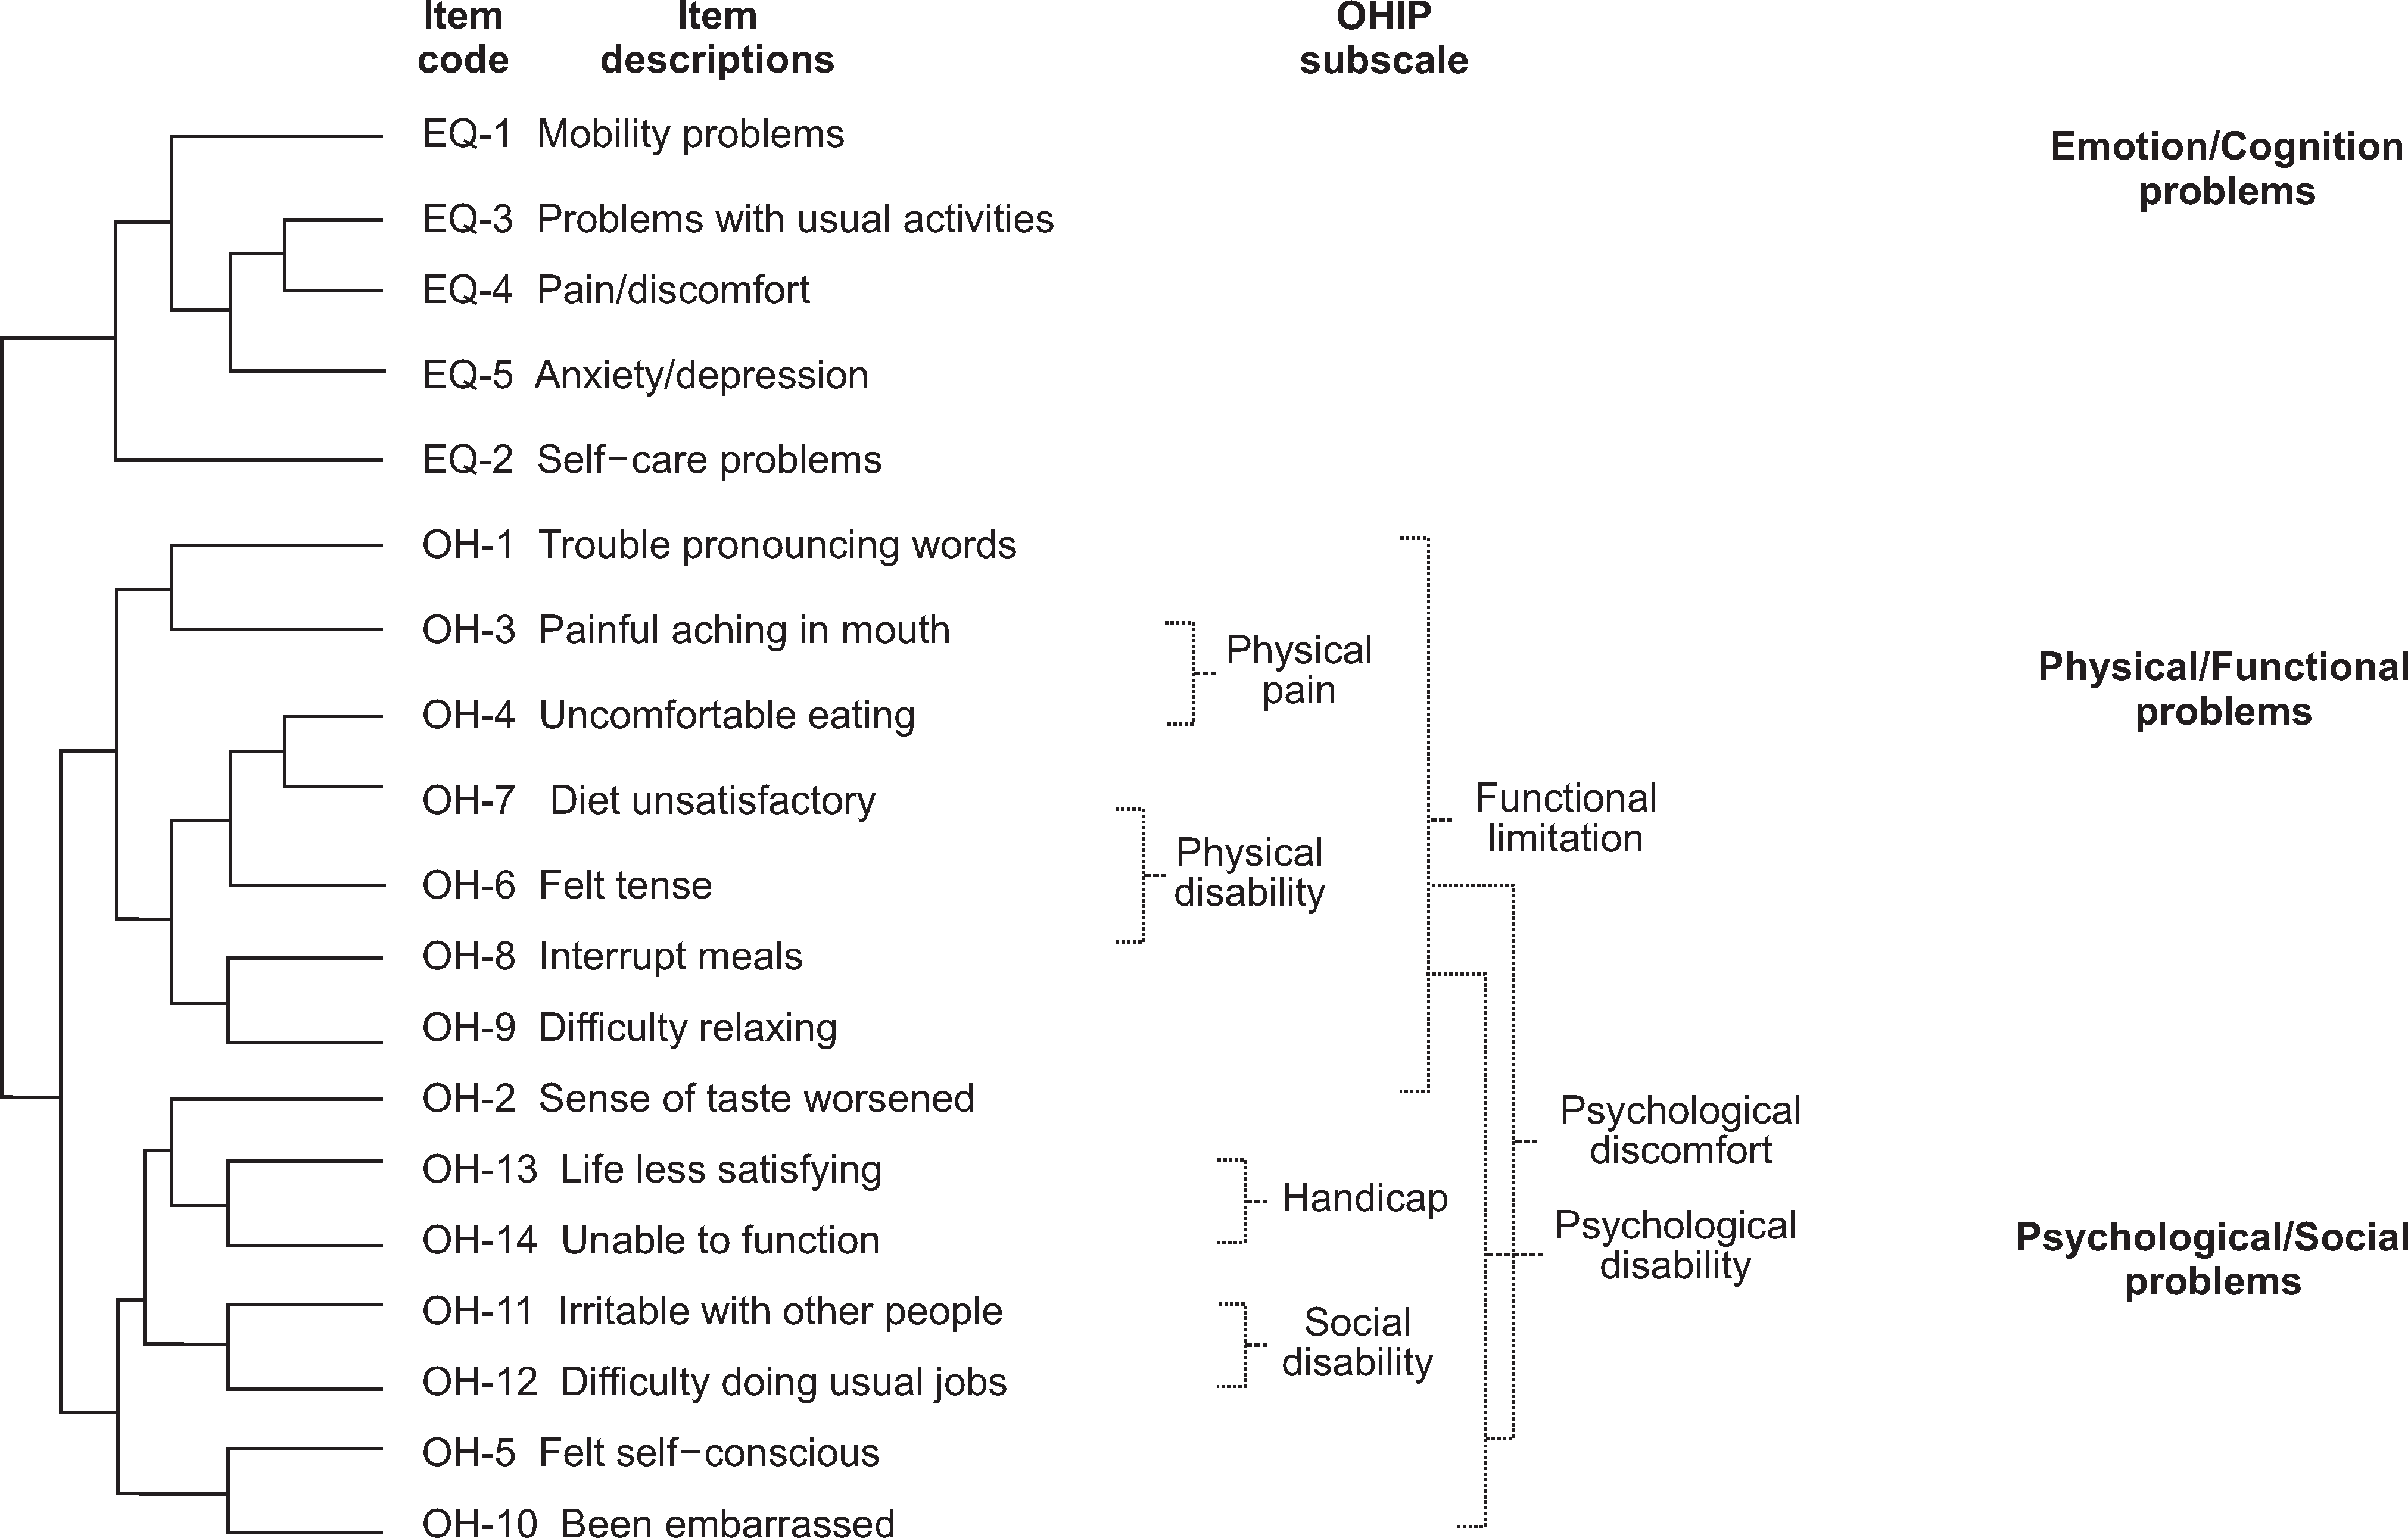
Fig. 1.
Cluster analysis of EQ-5D and OHIP-14 items for the groups with high quality of oral health.

Table 1.
General sample characteristics
| Classification | Total N (%) |
|---|---|
| Sex | |
| Male | 137 (45.97) |
| Female | 161 (54.03) |
| Age | |
| Below 65 years | 251 (84.2) |
| Above 65 years | 47 (15.8) |
| Education | |
| <Elementary | 59 (19.3) |
| Middle-high | 134 (43.9) |
| >College | 112 (36.7) |
| SRGH | |
| ≥Good* | 137 (45.5) |
| ≤Poor† | 164 (54.5) |
| SROH | |
| ≥Good* | 228 (75.5) |
| ≤Poor† | 74 (24.5) |
Table 2.
Self-rated health, Oral Health Impact Profile 14 (OHIP-14), EuroQol-5D (EQ-5D) scale scores
|
SROH§ |
OHIP‡ |
EQ-5D‡ |
||
|---|---|---|---|---|
| ≥Good* N (%) | ≤Poor† N (%) | Mean (SE) | Mean (SE) | |
| SRGH§ | ||||
| ≥Good* | 283 (92.70) | 22 (7.30) | 19.55 (1.04) | 1.12 (0.11) |
| ≤Poor† | 188 (61.59) | 117 (38.41) | 11.55 (0.84) | 0.55 (0.07) |
| OHIP‡ | ||||
| Mean (SE) | 17.36 (0.78) | 8.45 (1.19) | ||
| EQ-5D‡ | ||||
| Mean (SE) | 0.93 (0.08) | 0.49 (0.11) | ||
Table 3.
Factor analysis of OHIP-14 and EQ-5D items


 PDF
PDF ePub
ePub Citation
 Print
Print


 XML Download