

 PDF
PDF Citation
 Print
Print


INTRODUCTION
Stroke mimics (SMs) might accidentally be identified as strokes, resulting in late diagnoses of their exact pathologies and unsuitable early thrombolytic therapy with its possible risks [1]. The proportion of SMs among suspected strokes differs considerably from medical research [2] cited as 19% [3], 14% [4] and 13% [5]. According to the published literature, forecasters of SMs are younger individuals, more frequently females, with fewer risk factors for stroke [6] than real stroke cases. Also, symptoms such as global aphasia, negligible or no weakness [7], a recognized history of cognitive decline, non-neurologic abnormal clinical signs and a dropped level of consciousness are predictors of SMs. On the other hand, clinical characteristics of acute strokes are a precise time of onset, definite focal symptoms, abnormal vascular signs and symptoms, a lateralization of symptoms [8], an elevated National Institutes of Health Stroke Scale (NIHSS) score, an arterial occlusion on computed tomographic angiography (CTA) or magnetic resonance angiography (MRA) and scattered atherosclerosis on CTA or MRA [9].
Thrombolytic complications were rarely documented in SMs [4]. No symptomatic intracranial hemorrhage (SICH) was described before. Only one SM case after intravenous thrombolysis died within three months [6]. For other complications and mortality, SMs have favorable outcomes. This study aimed to explore the common SMs presenting within the first 4.5 hours of onset of “stroke symptoms” to hospitals, the main differences between true strokes and SMs in clinical, imaging features, the rate of thrombolysis, outcomes, and complications. A few studies have been done on SMs among the possible stroke cases; it is expected, this study would augment the published literature, and contribute to the knowledge by making clinicians more SMs aware.
MATERIALS AND METHODS
Patients selection
All cases with neurological symptoms that could be suggestive of stroke, who were admitted to the emergency department by the responsible medical physician, between 1st May and 31st October 2011 within 4.5 hours of symptoms onset, were retrospectively reviewed in a stroke database. Those cases admitted after 4.5 hours from onset of symptoms and those with the undetermined onset of symptoms (such as cases with awakening stroke symptoms) were excluded. All clinical information and investigations were verified and documented in the ongoing registry of stroke patients by the Stroke Research Unit staff according to acute stroke care protocol [4].
When indicated, patients underwent routine non-enhanced computed tomography (NNCT), perfusion computed tomography (PCT) and CTA and magnetic resonance imaging (MRI). When MRI was immediately available during the working days hours it was the preferred method; otherwise, NNCT was the method of choice in other situations during the early 4.5 hours of thrombolysis. If the CT result was non-conclusive of the appropriate diagnosis, PCT, CTA or MRI was used next. SICH was the most severe and frequent complication particularly documented. “SICH was defined as blood at any site in the brain on the CT scan, documentation by the investigator of clinical deterioration, or adverse events” [10].
The final diagnoses were made by consultants of stroke medicine or neurology, in consultation when needed by consultants of psychiatry. SMs were regarded as the lack of an acute ischemic lesion on all follow-up imaging scans besides an alternative discharge diagnosis [411]. On the other hand, true strokes were supposed in all patients with baseline characteristics, symptoms, signs and disease course distinctive for association with an intracranial vascular region with positive or non-conflicting brain imaging [6]. A definite or probable transient ischemic attack (TIA) was a definite or probable stroke that resolved within 24 hours [9].
Data fields
The data collected contain baseline characteristics (age, sex), stroke risk factors, clinical features of patients, provisional diagnoses, NNCT scan findings, PCT scan findings, other available imaging findings, whether the patient was treated with intravenous tissue plasminogen activator, onset to thrombolysis time, outcomes of thrombolysis, final diagnoses.
Statistical analysis
Version 20 of IBM-SPSS was used (SPSS Inc., Chicago, IL, USA). The level of significance (p-value) for all tests was 0.05. All missing data were excluded from the analysis of all the variables. The data collected contain both continuous and nominal variables. The majority of the variables were nominally coded by the yes or no answer. For these variables χ2 based and Fisher's exact tests were used. Fisher's exact test was performed in particular when the number of any patients group was less than 5, for example, MRI reports vascular stenosis, occlusion or both. For each continuous variable, an initial check was done independently for normality. In continuous variables that followed the normal distribution, and were independent of each other, the independent t-test was applied. On the other hand, if the condition of normality had not been satisfied, the rank-sum test (Mann-Whitney U test) was performed instead.
Ethical consideration
This study did not need approval from a local ethics committee, according to our consultation of the National Research Ethics Service (NRES) Queries Team because it was carried out from an anonymous secondary database available in the ongoing registry, at the Stroke Research Unit. Permission from the hospital authority to access the anonymous secondary database was given to us to carry out the study.
RESULTS
The number of all admissions of suspected strokes to the hyperacute stroke center from the emergency department, between 1st May and 31st October 2011 was 537, only 232 admissions (43.2%) were within the therapeutic window for thrombolysis (4.5 hours after onset of symptoms). The number of true strokes was 195 admissions and 37 admissions for mimics, which represented 15.9% of all admissions whereas true strokes represented 84.1% as shown in Table 1. The common SMs were psychiatric disorders (43.2%), followed by migraines (16.2%), then unrecognized seizures (8.1%), brain tumors (8.1%), and systemic infections (8.1%) as can be seen in Table 2. Age was the most differentiating clinical feature between SMs and true strokes (p = 0.003), with older age associated more with true strokes. All risk factors for stroke did not differ significantly between SMs and true strokes as demonstrated in Table 3, although hypertension showed a slight trend to be more linked to true strokes (p = 0.069).
Table 1
Stages of diagnoses of strokes and SMs
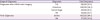
Table 2
Final diagnoses of SMs
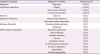
Table 3
Baseline characteristics distribution between SMs and true strokes
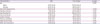
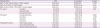
There was no remarkable statistical difference in gender between the 2 groups, although there was an inclination for SMs to appear more common in females (represented 59.5% of all cases of SMs); while, true strokes were more partially leaning toward males (comprised 54.9% of all case of true strokes) as can be seen in Table 3. Common symptoms and signs of stroke such as face symptoms, arm/leg symptoms or aphasia were not distinctive of true strokes, i.e., they could be seen prevalently in SMs. In contrast, Cortical signs such as sensory inattention, neglect (p = 0.001) and hemianopia (p < 0.001) were more pathognomonic of true strokes rather than SMs. Cerebellar or brain stem signs excluding dysarthria; on the other hand, were significantly common in SMs than true strokes (p = 0.045) as shown in Table 4. The median for NIHSS scores (4) in SMs was lower than the median for the same scores in true strokes (8) (p = 0.009). Acute ischemic imaging features in the initial brain imaging showed substantial differences between true strokes and SMs, remarkably in favor of true strokes (p = 0.008) except old infarcts which were frequently seen in SMs as demonstrated in Table 5. Similar features were seen in PCT, CTA, and MRI report.
Table 4
Neurological assessments distribution between SMs and true strokes

Table 5
Imaging findings distribution between strokes and mimics
Only 2 cases of 37 cases of SMs (5.4%) were given thrombolysis without bleeding sequel intra-cranially. These stroke-mimics cases were very challenging to diagnose — during the remaining few hours of the therapeutic window of thrombolysis with the limited provided technical & specialist staff and facilities — and have typical features of stroke in addition to other atypical/strange symptoms. Those patients considered by the responsible consultant highly probable cases of stroke and thought with the clinical information available they will likely to benefit from thrombolysis with small risks of complications.
DISCUSSION
This retrospective study has shown that SMs constitute nearly 16% of all suspected stroke patients presented to a hyper-acute service within 4.5 hours of symptom onset. This percentage according to literature is in the middle between 6.5% [4] in one study and 19% reported in another study [3], and was close to the studies, which reported 13% [5] and 14% [12]. These differences in the percentage of SMs depend on a total number of patients, duration of the study, the settings of hours which ranged from 3–24 hours since admission, and the protocol that was followed to identify SMs.
In this series we found SMs patients tend to be younger, female, and normotensive; they lack cortical signs and often had fewer known stroke risk factors less than true strokes. Those findings were similar to other studies as reported by Zinkstok and colleagues [6]. Independent cardiovascular risk factors were more common in true strokes than SMs excluding hyperlipidemia and current smoking in our series. Smoking as a social habit is prevalent in the South London society and cannot be used to determine a difference in the diagnosis. Hyperlipidemia is more complicated as it is related to eating habits and diets, the level of exercise and metabolic state of the body which can vary in strokes and SMs. What we found agrees with other studies, which show the lesser occurrence of cardiovascular risk factors in SMs cases, even if this is not a steady discovery, and when recognized it demonstrated an inclination rather than a statistically remarkable difference [13].
Strikingly cerebellar or brainstem signs are more predictors of mimics rather than true strokes. Such “irregular” features of stroke combined with age more youthful than that were associated with stroke should imply more thorough investigation for SMs [14]. Hatzitolios and colleagues [1] found that primary symptoms of the patients that mimicked a stroke were: dizziness, fainting or both (27.3%), aphasic disturbances (27.3%), dysarthria (11.1%), headache and/or diplopia (11.1%), hiccup and/or swallow disturbances(5.6%). Compared to acute ischemic strokes, mimics are more expected to present with seizure history and confusion and to lack lateralizing features [9].
Signs of potential acute ischemia such as small vessel diseases, atheroma, occlusion or stenosis were more prone to occur in real strokes as was shown in our imaging results. Signs of old ischemia such as old infarcts similar to previous strokes and TIAs were shown to be not significantly different in actual strokes from SMs, indicating that SMs can occur in patients with old infarcts or TIAs. A similar study showed that arterial occlusion on CTA or MRA was seen in 57.8% of acute ischemic strokes patients but was not noticed in aborted strokes or mimics [10]. Disseminated atherosclerosis on CTA or MRA was linked to stroke rather than mimics (86.6% and 58.8% of acute ischemic strokes and aborted strokes cases respectively, vs. 21.4% of mimics) [10].
Interestingly, this series of cases differed from other studies in the literature, in which psychiatric disorders represented the highest proportion (43.2%) of all SMs, significantly higher than average in other studies (25%–30%) [8]. It was also slightly above the range reported by Brunser and colleagues [15] from several studies (4%–40%). This result could be explained by the higher number of cases of anxiety and acute stress reactions in this series which was represented by at least 11 cases out of the total 37 (29.7%). The high number of psychological disorders may have been likely to be related to the higher percentage of female gender in the stroke mimic group.
Migraines came in the second proportion with 16.2% similar to the range of the other studies (10.6%–45.0%) [15]. Unrecognized seizures came unusually in the third proportion (8.1%), which were usually the most frequent diagnoses in other studies, but still above the lower end of the range reported in the literature (6%–40%) [516]. Seizures should be assumed when tonic-clonic movements come before focal neurologic signs when events are similar, or when changes in consciousness take place. Nonetheless, acute ischemic stroke can intermittently feature seizures, accumulating another level of complexity to the diagnostic problem [16].
Systemic infections came with a 5.4%, slightly lower than what is written in the literature (7%–14%) [15]. Also, brain tumors came with a proportion of 5.4%, which is within the range of other articles (4%–13%) [15]. Confusional conditions such as dementia, and transient global amnesia reported in one study as 3%; whereas, here in this series they comprised 5.4%, slightly higher, which is probably due to the lower number of cases of SMs in this study [5]. Finally, there was only one case of multiple sclerosis as a demyelinating disease, which was similar to the prospective published study done by Norris and Hachinski [5].
We realized that in this series, there were no cases of metabolic disturbances such as severe hypoglycemia or hyponatremia; that was commonly found in other studies as reported by Brunser et al. [15] to range from 3% to 30%. It is probable that such cases were identified in the emergency department by early blood tests and excluded from admission to the hyper-acute stroke unit.
Limitations of this work are: first, it was a retrospective study, not fully fitted with the of the objectives of this study. Second, there was no specific protocol followed by the clinical team, page hyperacute stroke unit, as the literature recommended all patients with suspected strokes, should undergo NNCT, PCT and CTA as one set immediately after suspicion and stabilization of the patients then followed later with MRI advanced techniques [17]. The clinical team relied on their clinical experience which was undoubtedly subject to human error, and it was difficult to control this factor in this research.
Clinicians could rely to some extent on differences in clinical features between the 2 groups of SMs and real strokes as pointers towards the probability of SMs among suspected stroke cases; the differences in the imaging features augment the clinical suspicion according to accuracy and sensitivity of the imaging scan. Large prospective studies targeting the issue of SMs during the therapeutic window of thrombolysis, as well as, following the suggested protocol of CT, PCT and CTA in the literature during this window is strongly recommended.
 XML Download