

 PDF
PDF ePub
ePub Citation
 Print
Print


INTRODUCTION
Colorectal cancer (CRC) is the third most common cancer worldwide. About 500,000 die of CRC all over the world in a year and are about half of the annual incidence [1]. Although early detection by screening and advances in therapeutic strategies decreased mortality of CRC [234], the survival of stage IV patients is poor yet. Hematogenous metastasis, the major cause of death, is detected in 20%–50% of the patients at diagnosis [567], and survival of stage IV patients has been regarded poor but details of their survival are not well understood. By the way, efforts to divide the survival of stage IV patients have emerged due to the recent improvement in survival by the advances in surgical and medical treatment. The 7th edition of American Joint Committee on Cancer/Union for International Cancer Control (AJCC/UICC) staging system separated stage IV to IVa and IVb (M1a and M1b) [8]. This reforming reflects the need for stratification of the survival of stage IV.
Lymph node (LN) metastasis is the most important prognostic factor in CRC without hematogenous metastasis or peritoneal seeding. However, it is not clear whether the LN metastasis is also a prognostic factor in stage IV patients. There are debate on that issue [9] because some studies reported that LN metastasis was a prognostic factor in stage IV [31011121314], while others did not [715161718]. It is not clear either if the effect of LN metastasis differs according to the resection of metastases. The debate is because there are few studies on that issue and few papers showed the survival functions discriminated by the LN status.
Improved safety of aggressive surgery and development of new chemotherapeutics may extend the survival of stage IV patients [1920]. However, in order to elevate the cure rate of stage IV, identification of potentially curable patients through the stratification of survivals, by more understanding of the survival factors, is mandatory. Therefore, this study was to identify the effect of LN metastasis on the survival of stage IV CRCs.
METHODS
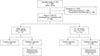
This study was performed by retrospective review of stage IV colorectal adenocarcinoma patients, operated from January 2003 to December 2010, from the prospectively collected Seoul Colorectal Group database. This study was reviewed and approved by the Institutional Review Board of the Seoul National University Hospital (H-1312001536). During that period, stage IV patients were 1,285 of the total 12,625 CRC patients operated for the primary resection. Patients with peritoneal seeding (n = 349) or preoperative chemotherapy (n = 86) were excluded. Therefore, the number of patients with stage IV by hematogenous metastasis, enrolled in this study, was 850 (Fig. 1). Patients of stage IV by recurrences were not included in this study. Clinicopathological characteristics and survivals were compared according to the degree of LN metastases.
Primary tumor was resected in every patient and there were no patients in whom LN metastasis could not be evaluated due to non-resection of the primary tumor, such as colostomy procedure only. Simultaneous metastasectomy was decided by each operator. It was defined as curative resection when all the metastatic lesions were resected simultaneously and as palliative resection when metastatic lesions were not resected. Metachronous metastasectomy was performed in 15 of the patients with palliative resection and these patients were not included in the survival function analyses. In 37 patients (4.4%), ten or less LN's were harvested and twelve of them underwent curative resection. Metastases were detected in all the LN's harvested in 10 patients (1.2%) and 2 of them underwent the metastasectomy. However, these two patients were classified as palliative resection. Postoperative chemotherapy was performed in 738, not performed in 96 (11.3%) and unknown in 16 patients (1.9%). Median follow-up duration was 34.3 months (range, 1–119 months). Operative mortalities (within 30 postoperative days) were 7 cases.
The patients were grouped as patients without LN metastasis (N0M1 group) and with LN metastasis (N + M1 group) by according to N stage progression. And overall survival (OS) was evaluated in all enrolled patients and compared in patients with curative resection and in patients with palliative resection, respectively. Additionally, OS of stage III patients during the study period (n = 5,452) was surveyed to compare with the survival of N0M1 group.
TNM stage is based on the criteria of AJCC/UICC staging system 7th edition [8]. However, subclassification of stage III patients (IIIA–IIIC) was based on the 6th edition because T stage was not identified as T4a or T4b of those pathologies in this study.
Statistical analyses were performed by using the IBM SPSS Statistics ver. 20.0 (IBM Co., Armonk, NY, USA) and R ver. 3.2.1 (R Foundation for Statistical Computing, Vienna, Austria; https://www.r-project.org). Pearson chi-square or Fisher exact test were used for categorial variables and Student t-test or 1-way analysis of variance were used for continuous variables. For multiple comparisons, Bonferroni correction was applied. Kaplan-Meier method was used for estimating the cumulative survival rates and log-rank test was used for the comparison between the groups. Additionally, Cox proportional hazard model was used for the univariable and multivariable analysis for the contributors in survival. P-value less than 0.05 was considered significant.
RESULTS
Clinicopathological features between patients with and without LN metastases
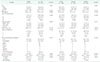
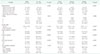
The number of patients without LN metastasis (N0M1) was 77 and comprised 9.1% of the total, operated stage IV patients by hematogenous metastases. In clinical features, N + M1 patients were younger and preferred rectal cancers to right (Padj = 0.030) or left (Padj = 0.044) colon cancer (Table 1). However, pathological features of N + M1 were distinct from N0M1, having gradual change to high grade differentiation and advanced T stages (P < 0.05, Linear-by-linear test). Angiolymphatic invasion (ALI), perineural invasion, and venous invasion were less in N0M1 (Table 2). There were five patients (6.5%) in N0M1 and 301 (38.9%) in N + M1 who have all the 3 invasions.
N0M1 patients have lower recurrence and better survival.
Follow-up was not possible in 13 patients with curative resection (two in N0M1 and 11 in N + M1). The recurrence rate was significantly higher in N + M1 group (52.0% vs. 72.8%, P = 0.002). However, there were no differences in the site of first recurrence (Table 3).
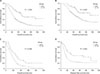
The 5-year OS rate was higher in N0M1 than N + M1 in 835 patients, excluding 15 metachronous metastasectomy patients. The survival of N0M1 was better in both curative and palliative resection group. The 5-year disease free survival (DFS) in patients with curative resection was also better in N0M1 (Fig. 2). Chemotherapy regimens were not different fundamentally between N0M1 and N + M1 or among N stages (Table 4).
Prognositic factors and survivals are stratified according to the N stage progression.
We compared the N + M1 patients according to the N stage progression (N1–N2b). Of the clinical factors showing differences between N0M1 and N + M1, only the curative resection rate was different, but the others such as age were not, with N stage progression within N + M1. By the way, tumor size tended to increase contrary to comparison between N0M1 and N + M1 (Table 1). That is, there were no common clinical factors showing differences in both comparisons between N0M1 and N + M1 and among N stages within N + M1. However, the poor pathological features accumulated according to the N stage progression, except for VI, as they were more prevalent in N + M1 than N0M1 (Table 2). And N stage progression increased recurrence rate (P < 0.001, Linear-by-linear test), although no differences in sites of first recurrence (Table 3).
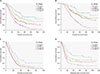
The survival curves were stratified and significantly different between each 2 groups (P < 0.05). The survival curves were also stratified when the patients were separated by curative resection or not. However, 5-year OS's were different neither between N1M1 and N2aM1 in curative resection group nor between N2aM1 and N2bM1 in palliative resection group (Fig. 3).
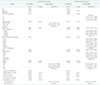
To identify the factors affecting the survivals, we applied multivariable cox proportional hazard model with all the clinicopathological factors as well as N stage and chemotherapy. In curative resection group, tumor location, N stage and chemotherapy were significant factors in multivariable analysis. In palliative resection group, American Society of Anesthesiologists physical status classification, tumor size, multiplicity, site of metastasis, CEA, differentiation, N stage and chemotherapy were the significant factors in multivariable analysis. Therefore, N stage and chemotherapy were the consistently significant factors in both curative and palliative groups (Table 5).
Effect on survival decrease by hematogenous metastasis is comparable to N2a node metastases
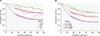
We compared the survivals of N0M1 and stage III patients to assess the effects on survival by the LN metastasis and hematogenous metastasis, each, because the survival of N0M1 is so excellent. Only the N0M1 with curative resection were compared to stage III because surgical resections in stage III are basically curative intent. The 5-year OS of N0M1 group was similar to that of stage IIIb (by AJCC/UICC 6th edition). If the stage III patients were classified according to N stage only, the 5-year OS of anyTN0M1 patients was not different from those of anyTN1M0 or anyTN2aM0 but significantly higher than that of anyTN2bM0 (Fig. 4).
DISCUSSION
The 5-year OS of the study patients (27.7% ± 1.7%) was better than that of surveillance, epidemiology, and end results (SEER) data [2122]. However, 5-year OS of patients with curative resection, 47.5% ± 2.7%, was very similar to those of de Jong et al. [11] and Nitsche et al. [14]. And 5-year DFS of patients with curative resection, 26.0% ± 2.3%, was comparable to that of D'Angelica et al. [12]. The superior survival of our patients to SEER data is probably because we included only patients with primary tumor resection and excluded patients with peritoneal seeding. Survivals of patients with primary tumor resection were reported better than those without resection [232425] and survival of patients with periotoneal seeding was inferior to that of hematogenous metastasis [10]. We excluded peritoneal seeding because there is not an objective standard for quantitative assessment of periotoneal seeding yet. We included neither metachronous stage IV nor metachronous metastasectomy in order to compare survival functions. Also, preoperative chemotherapy patients were excluded to reflect the stage at the time of diagnosis [26]. Many previous reports said that LN metastais was a prognostic factor in stage IV patients. However, most of them could not show the survival functions because they included both synchronous and metachronous stage IV and because they did not put curative and palliative resection apart.
After Dukes demonstrated that invasion depth of colonic wall and LN metastases were important prognostic factors [27] and after Pierre Denoix suggested TNM staging system [28], AJCC have announced TNM stage classifications since 1977. However, for a long time, stage IV has been regarded merely as a stage of poor prognosis and of which prognostic factors were not drawn attention. Advances of imaging diagnosis made liver and lung metastases detectable preoperatively only in recent decades. And although anatomical liver resection was described as early as 1950s [29], it is lately that liver resection was positioned as a standard therapy for the liver metastasis [12]. Therefore, attentions and interests have not been paid for patients in whom exact assessment and proper treatment were not possible. However, advancement in preoperative imaging and improved survivals by the liver resection as well as new chemotherapeutics made stratification of the survivals necessary to differentiate better group from poorer group. Detailed analysis of survivals in stage IV can delineate subgroup with excellent survival and help improving the survival of overall stage IV patients ultimately.
We could recognize by this study that N0M1 patients have better survival than N + M1 patients. N0M1 is a systemically spread disease but is a potentially curable disease. Better survival of N0M1 than N + M1 is due to neither more curative resection nor more active chemotherapy. DFS of patients with curative resection as well as OS of patients with palliative resection was better in N0M1 than in N + M1. Therefore, survival differences between the two groups are inherent in the LN metastases. That is also supported by that N+M1 patients had poorer pathological characteristics in differentiation, T stage, ALI, etc. Also, although quantitative comparison of metastatic burden is not possible, we observed that the number and size of metastatic liver tumor was lager in N + M1 than N0M1 (mean number of metastatic lesion: 2.41 vs. 1.56; mean maximal size of metastatic lesion: 2.87 vs. 2.27) of the patients in whom liver was the only site of metastasis and curative resection was performed. Poorer survival with N stage progression within N + M1 can be explained by the sequential accumulation of the pathologically poor characteristics. Thus, N stage is a prognostic factor in stage IV CRC patients by hematogenous metastasis, too. Therefore, resection of metastatic lesion is strongly recommended, if possible, when there is no evidence of advanced LN metastasis. Interestingly, meanwhile most pathological factors such as differentiation, T stage, ALI and PNI sequentially progressed from N0M1 to N2bM1, the clinical factors, for example age, did not. This implies that demographic features favoring hematogenous or LN metastases may be different. The meaning of this discrepancy between clinical and pathological features is worthwhile to be investigated in the future study.
Natural course of progression in CRCs are generally observed as; after the primary tumor develop, LN metastasis occurs initially and hematogenous metastasis develops finally. Are N0M1 patients accidental, then? However, sequential changes in the composition of pathological factors with the N stage progression (N0M1–N2bM1) mean N0M1 group is an inevitable one, not a chance, although the incidence is low. This fact rouses suspicions that LN metastasis and hematogenous metastasis are not sequential but only independent events. That is, hematogenous metastasis can occur earlier than LN metastasis, essentially. Because the LN metastasis is far more frequent than the hematogenous metastasis (5452: 77 ⋍ 71: 1 in our series) we could not but observe LN metastases as earlier events; and because hematogenous metastasis has not been resectable for a long time and caused death, we could not but regarded as a final stage. That is, LN metastasis and hematogenous metastasis are not a way station and a final destination in the progression of CRC, but only independent events and, accordingly, the effects of survival decreases are independent each, if resected. We could notice it by the far lower survival curve of N2bM1 than N2aM1 or N1M1 (N2b is the poorer and major determinant than M1 from Fig. 3B) and by the similar curve of N2aM1 and N1M1 (nonsignificant difference of M1 from N1 or N2a) in patients with curative resection. However, in patients with palliative resection, the effect of N stage is masked by the unresected M1 and the survival curves have different patterns. As the N+M0 patients have hematogenous metastasis sometime if not treated, N0M1 patients will get LN metastasis too, so it is impossible to know which of the LN or hematogenous metastasis was first in N+M1 patients. However, observation of details in rare cases like N0M1 would broaden our understanding of the mechanism of LN metastasis and hematogenous metastasis and would provide important clues to CRC progression.
This study has weakness of enrolling small number of patients and of not showing the disease specific survivals. Therefore, further study with large scale is necessary.
In conclusion, LN metastasis is an important prognostic factor in stage IV CRC by hematogenous metastasis. However, the effect of survival decrease is determined by the resection of metastases as well. N stage progression accumulates pathologically poor prognostic factors. AnyTN0M1 with curative resection has equivocal survival to anyTN2aM0 and is potentially curable stage. Therefore, active metastasectomy was recommended, if resectable, when advanced LN metastases were not determined.


 XML Download